Authors: Belen Moreno Santamaria, Fernando del Ama Gonzalo, Danielle Pinette, Benito Lauret Aguirregabiria and Juan A. Hernandez Ramos
Source: Sustainability 2020, 12(18), 7564; MDPI
DOI: https://doi.org/10.3390/su12187564
(This article belongs to the Special Issue Sustainable Building and Indoor Air Quality)
Abstract
New light envelopes for buildings need a holistic vision based on the integration of architectural design, building simulation, energy management, and the curtain wall industry. Water flow glazing (WFG)-unitized facades work as transparent and translucent facades with new features, such as heat absorption and renewable energy production. The main objective of this paper was to assess the performance of a new WFG-unitized facade as a high-performance envelope with dynamic thermal properties. Outdoor temperature, variable mass flow rate, and solar radiation were considered as transient boundary conditions at the simulation stage. The thermal performance of different WFGs was carried out using simulation tools and real data. The test facility included temperature sensors and pyranometers to validate simulation results. The dynamic thermal transmittance ranged from 1 W/m2K when the mass flow rate is stopped to 0.06 W/m2K when the mass flow rate is above 2 L/min m2. Selecting the right glazing in each orientation had an impact on energy savings, renewable energy production, and CO2 emissions. Energy savings ranged from 5.43 to 6.46 KWh/m2 day in non-renewable energy consumption, whereas the renewable primary energy production ranged from 3 to 3.42 KWh/m2 day. The CO2 emissions were reduced at a rate of 1 Kg/m2 day. The disadvantages of WFG are the high up-front cost and more demanding assembly process.
1. Introduction
The residential and commercial building sector accounts for almost 40% of the European Union final energy consumption [1]. Thus, the goal of achieving a highly energy-efficient building stock by 2050 was set by The Energy Performance of Buildings Directive (EPBD 2018) [2]. In the United States, recent studies have shown that heating and cooling account for more than 30% of energy consumption in buildings [3]. Other non-OECD countries, including China and India, will be responsible for half of the global increase in energy consumption until 2040 [4]. The development of new materials, new heating and ventilation technologies, and energy-saving measures have improved the thermal performance of buildings in winter conditions [5]. However, in summer conditions, the increasing standards of life and the affordability of air-conditioning technologies have contributed to increasing the energy needs for cooling over the last decade [6]. Nowadays, air conditioning in office and commercial facilities accounts for 15% of the total electricity consumption in the world [7,8,9]. Occupants and equipment are responsible for internal heat gains, and large glass areas increase solar radiation gains, especially in warm climates, thus leading to the increased total electricity consumption for the purposes of cooling [10,11].
The design of advanced glazed facades is the most promising component in building design with the highest impact on building performance [12]. In this paper, advanced facades refer to a broad spectrum of constructive solutions that allow for the dynamic response of the building envelope. They can actively manage the heat flow and energy transfer between the building and its external environment, leading to a potentially significant reduction in heating and cooling loads [13]. Advanced glazed facades include passive solutions, such as Low-E coatings, which reflect the indoor heat when the outdoor temperature is low [14], and highly selective coatings that reflect direct and diffuse solar heat radiation in summer. Scientific literature has confirmed this potential energy reduction [15,16]. However, the most promising results can be accomplished with dynamic technologies that can adapt to different outdoor conditions.
Polymer dispersed liquid crystal (PDLC), Suspended Particle Devices (SPDs), and electrochromic (EC) glass switch from transparent to colored or vary transmission and reflection parameters [17,18]. The system is limited by its high initial cost and the need for an energy management system integrated with the rest of the equipment, especially the ventilation system. Controlling the relative humidity is essential in radiant panels to prevent condensation issues, especially in summer. The integrated piping does not allow movable panels, so its use is limited to buildings with mechanical ventilation [19]. Nevertheless, the measures to improve the energy performance of buildings do not focus only on the building envelope. Building designers must consider all technical and mechanical systems in a building, such as passive elements; heating, ventilation, air conditioning (HVAC); the energy use for lighting and ventilation; and other measures to improve thermal and visual comfort [20].
Water flow glazing (WFG), as an advanced facade technology, combines passive (coatings and polyvinyl butyral (PVB) layers) and active solutions (variable water mass flow rate) to absorb or reject infrared radiation and reduce the temperature of the interior glass pane [21,22]. Flowing water captures most of the solar infrared radiation, while a significant part of the visible component goes through the glazing [23,24]. WFG radiant panels can be used as components of a heating or cooling hydronic system with little difference between the water and the indoor temperature [25]. Finally, WFG can work as an integrated solar collector to provide water heating in warm seasons, and the excess of hot water can be stored in buffer tanks [26]. The use of the facade and interior partitions as radiant heating and cooling devices have advantages compared with convective cooling systems.
Using radiant ceilings or walls can reduce energy consumption between 10% to 70% compared with all-air systems [27]. This article showed some of the accomplishments of the research project: “Industrialized Development of Water Flow Glazing Systems” (InDeWag), supported by program Horizon 2020–the EU.3.3.1: Reducing energy consumption and carbon footprint by smart and sustainable use. The water flow glazing unitized facade is made of three components: glazing, circulating device, and aluminum frame [28]. The glazing comprises different layers and interfaces according to determined spectral and thermal properties. The circulating device includes a water pump moving the fluid in a closed circuit, a heat exchanger, and temperature and flow sensors to monitor and control the heat. Finally, the aluminum frame provides the unitized module with structural stability.
Despite the fast pace of product innovation, a gap has been created between the new advanced facades and the available building simulation tools to model and assess building energy performance [29]. Monitoring activities are essential to support simulation models, especially in transient state [30], when changing the boundary conditions can affect the results of dynamic simulations by more than 30% [31]. Although there are commercial building energy simulation tools that include dynamic simulations [32], very few include WFG [33,34]. The authors of this paper developed a set of equations that take into account multiple direct and diffuse reflections between the glazing surfaces, the absorptance of glass and water layers, the spectral properties of coatings, and the convective heat transfer coefficient [35,36].
Then, a simulation tool was developed to allow building designers to make decisions on the glazing type. Finally, the equations and the simulation tool were validated through the real results taken from a demonstrator placed in Sofia, Bulgaria. In addition to an accurate simulation tool, the actual challenge was to develop a monitoring system to reveal characteristic patterns of users, and to finally discover relevant design criteria that might be applicable to different orientations throughout the year. The monitoring system applied in this case study has been tested in other facilities over the last few years, and results were shown in previous articles [37,38].
This paper focused on a methodology to select and assess the performance of different WFG configurations in a test facility in Sofia, Bulgaria. Hence, to achieve this goal, it was essential to (i) simulate the steady state to select the optimum WFG in each orientation at the first stage of the design process, (ii) validate the first results by including transient boundary conditions, (iii) analyze the performance of the selected glazing in a real facility, and (iv) estimate the final energy savings, the potential renewable energy production, and CO2 emissions in summer and winter conditions.
2. Materials and Methods
Commercial building energy simulation (BES) software does not consider WFG as a component of the heating and cooling systems. It is essential to provide building designers with a simple method to select the correct glazing and evaluate its performance at the beginning of the design stage. The first subsection defines three tested WFGs in terms of spectral properties. The second subsection shows the mathematical model that defined the dynamic thermal properties of the glazing. The third subsection describes the components and industrialization process of the unitized WFG.
2.1. Determination of Spectral Properties
The International Glazing DataBase (IGDB) is a collection of optical data for glazing products. Spectral transmittance and reflectance are measured in a spectrophotometer and contributed to the IGDB by the manufacturer of the glazing product, subject to a careful review. The IGDB currently only allows the inclusion of specular glazing materials without patterns, such as monolithic glass, plastic, laminates, applied films on glass, or thin-film coated glass. The products included in the WFG catalog are low-emissivity (Low-E) glass, high selective glass, and solar polyvinyl butyral (PVB) interlayers to increase sun energy absorbance. The solar energy spectrum can be divided into the ultraviolet (UV) light, visible light, and infrared (IR) light, depending on the wavelength. The wavelengths of the ultraviolet light range from 310 to 380 nanometers. The visible light ranges from 380 to 780 nanometers. The infrared light spectrum is transmitted as heat into a building and begins at wavelengths of 780 nanometers. Solar heat radiation has shortwave energy, and it is known as near-infrared (NIR), whereas the heat radiating off warm objects has higher wavelengths and is known as far-infrared (FIR). Three different WFGs were tested:
- Case 1 was made of the following layers: Planiclear (8 mm), 2 Saflex R solar (SG41), Planiclear (8 mm), water chamber (24 mm), Planiclear (8 mm), Planiclear (8 mm), 4 Saflex R standard clear (RB11), Planiclear (8 mm), a low-emissivity coating Planitherm XN, an argon chamber (16 mm), Planiclear (6 mm), 4 Saflex R standard clear (RB11), Planiclear (6 mm).
- Case 2 was made of the following layers: diamant glass (10 mm), an argon chamber (16 mm), a low-emissivity coating Planitherm XN, Planiclear (8 mm), 2 Saflex R solar (SG41), Planiclear (8 mm), water chamber (24 mm), Planiclear (8 mm), 4 Saflex R standard clear (RB11), Planiclear (8 mm).
- Case 3 was made of the following layers: diamant glass (10 mm), a highly reflective coating Xtreme 60.28, an argon chamber (16 mm), Planiclear (8 mm), 4 Saflex R standard clear (RB11), Planiclear (8 mm), water chamber (24 mm), Planiclear (8 mm), 4 Saflex R standard clear (RB11), Planiclear (8 mm).
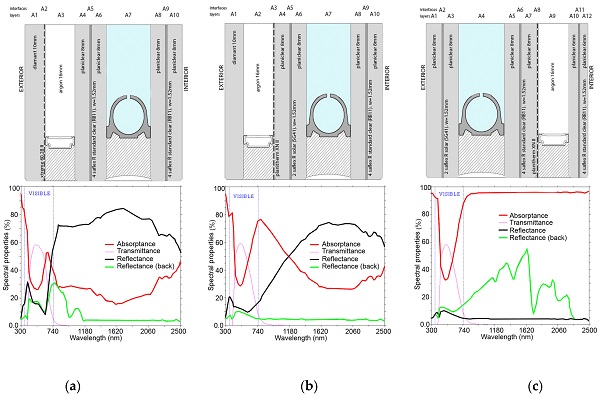
Figure 1 shows the front and back reflectance (R), transmittance (T), and absorptance (A), as a function of the angle of incidence. It illustrates the glass panes, coatings, and the position of the air and water chambers. Case 1 showed the highest infrared absorptance (A), the lowest front reflectance (R), and the lowest infrared transmittance (T). It seemed the best option to heat up water. Case 2 showed a high near-infrared (NIR) absorptance, low far-infrared (FIR) absorptance, and high front far-infrared (FIR) reflectance. The absorptance was not as high as in Case 1, but its ability to reflect heat made it the right solution for large glass areas in warm climates. Case 3 showed very low infrared absorptance and very high infrared front reflectance. This case would have been the best option to reject energy and prevent heat from entering the indoor space, but it would not have been appropriate to heat up water.
2.2. Determination of Heat Transfer Coefficients (h) and Dynamic Thermal Transmittance (U)
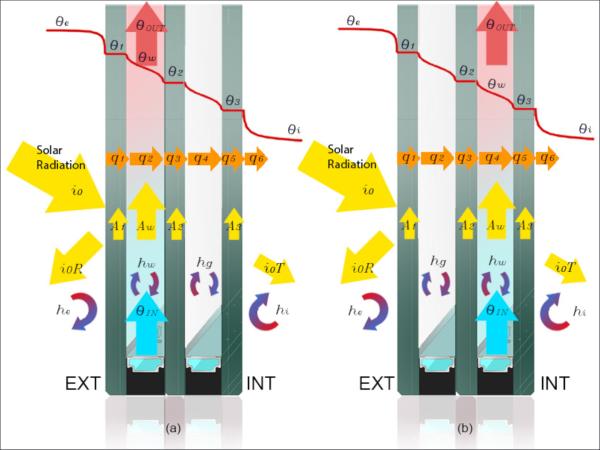
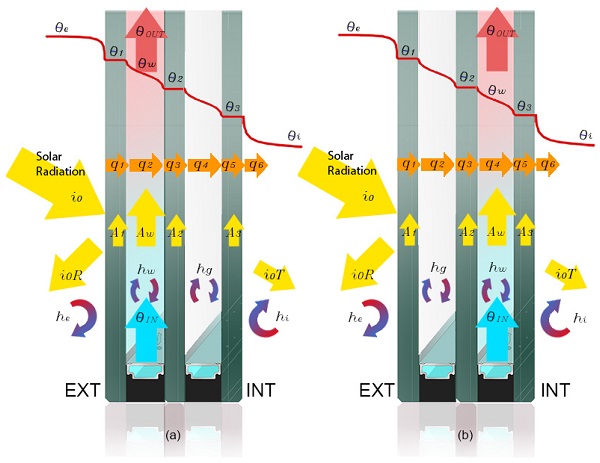
Water absorbs the solar near-infrared radiation and increases the temperature as it flows through the window. The mass flow rate and the thermal properties of glass panes must be studied to allow designers to apply energy-management strategies. Sometimes it might be interesting to increase the water temperature and store that energy for heating purposes. Other times it might be appropriate to reject as much solar radiation as possible without heating the water. The thermal transmittance (U) measures the heat transfer through the glazing and the European Standard determines its value [39,40]. Figure 2 illustrates the heat transfer coefficients (hi, hw, hg, and he), the temperature distribution in the WFG layers (θi, θ1, θ2, θ3, θw, θe), and the absorptance of layers (A1, A2, Aw, A3).
The Equation (1) gives the outdoor heat flux:
![]()
where he is the outdoor convective coefficient, θ1 is the superficial temperature of the outermost glass pane, and θe is the outdoor temperature. The beam solar irradiance, diffuse irradiance, and the angle of incidence should be given. Regarding indoor boundary conditions, the indoor heat flux is given by the Equation (2):
![]()
where hi is the indoor convective coefficient, θ3 is the superficial temperature of the inner glass pane, and θi is the indoor temperature that can be a constant value or calculated solving the indoor thermal problem. Newton’s law also models the heat transfer inside gas chambers. The heat flux in a gas chamber between two parallel surfaces is expressed by Equation (3):
![]()
where hg is the heat transfer coefficient of gas chambers, this coefficient considers the radiative heat transfer between the parallel glass panes and the natural convective transport. This value can be constant or calculated, knowing the emissivity of the two glass planes and an experimental correlation for the natural convective transport. In the water chamber, the situation is different. Heat flux is proportional to the temperature difference between the water temperature θw and the glass pane temperatures. This coefficient takes into account the heat transport mechanism forced by the water flow inside the chamber. Since the water is opaque to far-infrared, the radiative heat transfer mechanism is not present in the water chamber. Hence, the heat flux through glass panes in contact with the water chamber is expressed in Equation (4) for glass panes outside the water chamber, and Equation (5) when the glass pane is after the water chamber:

where hw is the heat transfer coefficient for the water chamber. By default hw = 50.
When it comes to considering the absorptance of layers (Ai), the heat flux can be expressed as in Equation (6).
![]()
Spectral and thermal properties of WFG have been explained in previous articles [35]. The authors used data from commercial software and developed equations to evaluate the influence of water flowing through glass panes. Equation (7) considers the energy balance at each layer and Newton’s definition of heat flux.
![]()
Equations (8)–(17) show the heat flux of WFG with water chamber indoors.
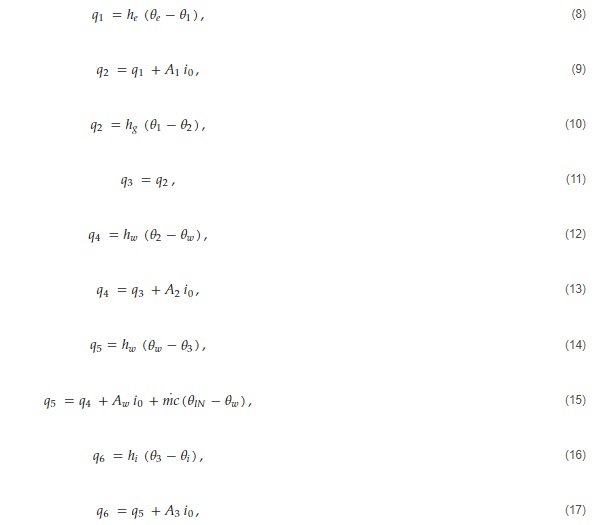
where hi is the interior heat transfer coefficient; he, the exterior heat transfer coefficient; hg, the air-cavity heat transfer coefficient; and hw, the water heat transfer coefficient. The thermal transmittances (Ue, Ui) depend on the heat transfer coefficients. Equations (18) and (19) refer to WFG with the water chamber outdoors (Case 1), and Equations (20) and (21) show the expressions for WFG with a water chamber indoors (Cases 2, 3).
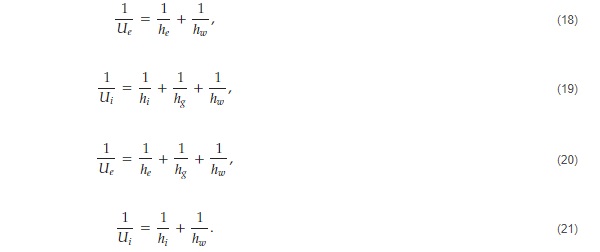
U represents the thermal transmittance between the room and outdoors, and Uw represents the thermal transmittance between the water chamber and indoors. The thermal transmittance (U) is almost zero when the flow rate is the design flow rate because the water chamber isolates the building from outdoor conditions. When the water flow stops, the thermal transmittance depends mainly on the air chamber. Equations (22) and (23) show the expressions for U and Uw, respectively:

where ṁ is the mass flow rate and c is the specific heat of water.
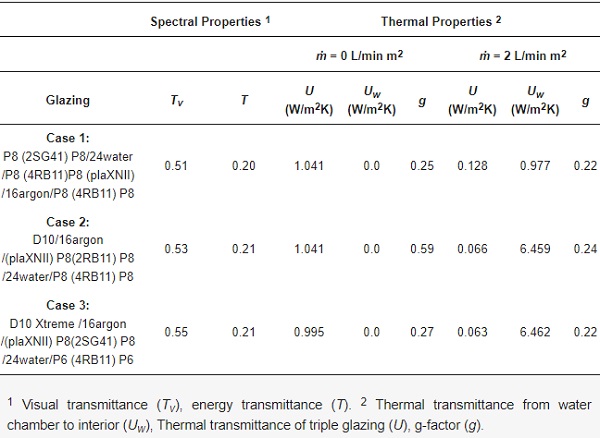
Table 1 shows a complete description of the different layers and the selected glazing average values. Visual transmittance (Tv) is the measurement of visible light (380 to 780 nm) passing through the glazing. The thermal parameters depended on the mass flow rate. If the water was flowing, the g-factor became lower. When the water chamber was stopped, the amount of energy entering the building increased. The thermal transmittance (U) was almost zero at the design flow rate (2 L/min m2). When ṁ = 0, U depended on the air chamber. The thermal transmittance (Uw) as defined in Equation (22) measures the heat losses or gains between the water chamber and the indoor air. Uw = 0 when ṁ = 0. At the working flow rate, its value was high (6.4 W/m2K) when the water chamber was close to indoors, and it was low (0.9 W/m2K) when the water chamber was outdoors.
The first case had the water chamber outdoors and a low-emissivity coating in face 4. When ṁ = 0, the U value was 1.041 W/m2K, and the g-factor was 0.25. At the operating ṁ, the g-factor became 0.22 and the U value, 0.128 W/m2K. The visual transmittance (Tv = 0.51) was the lowest of the selected cases. The second case had a water chamber facing indoors. A low-emissivity coating was placed in face 3 and a solar PVB layer in the central pane. The U value ranged from 0.066 to 1.041 W/m2K and a variable g-factor was 0.24 when the flow was ON, and 0.59 when the flow was OFF, adapting to the outdoor environment in both summer and winter conditions. The visual transmittance was 0.53. The third case had a highly selective coating in face 2. It yielded a U value of 0.995 W/m2K when the flow was OFF, and 0.063 W/m2K when the flow was ON. The g-value varied between 0.22 and 0.27. The visual transmittance (Tv = 0.55) was the highest of the selected cases. The energy transmittance (T), did not show significant variations, and it ranged from 0.20 in Case 1 to 0.21 in Cases 2 and 3.
Table 1. Spectral and thermal properties of the studied WFGs.
2.3. Description of the WFG Unitized Module
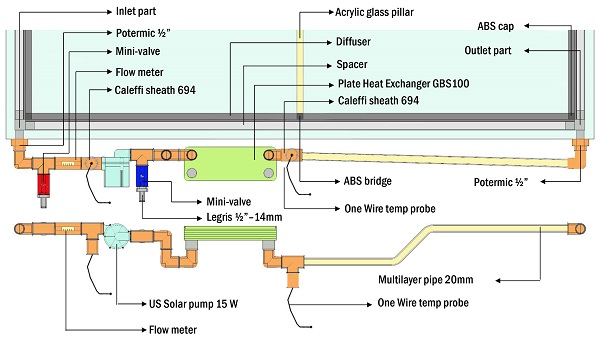
All the test cases were triple glazing with a 16 mm argon cavity and a 24 mm water cavity. The water cavity spacer was designed to lead the design flow rate. The circulating device was made of a plate heat exchanger and a solar water pump. The WFG units were manufactured and assembled in the glass factory and prepared for deployment on-site with an aluminum frame that enclosed the circulating device. The maximum dimension of the panel was 3000 mm high by 1300 mm width. The circulating device main components were a plate heat exchanger and a solar water pump. Its design allowed hydraulic and electrical independence of the modules with a reduced size. The operating flow rate was set to 8 l/min for a 4 m2 module. The circulating device was made of a water pump, selected according to the desired flow rate, and a plate heat exchanger based on the glazing heat capacity. Figure 3 shows a drawing of the circulator with its materials and primary components. Inlet and outlet temperatures were measured using one-wire temperature probes, and a flow meter was placed just before the glazing inlet.
The modular unit hid the complexity of the hydraulic installation, so it became a plug and play product with essential advantages from the product marketing point of view. Depending on the glass selection, the WFG modules offered a broad spectrum of capabilities depending on the location, facade orientation, and use of the building.
3. Results
The objective of this section is to compare the thermal performances of different glazings using simulation tools and real data. The heat transfer coefficients (hg, hw) define convective heat transfer mechanisms of the air and water chambers. Optics and Window software tools were used to validate the absorptance and transmittance of commercial glass panes [41]. Optics allows analyzing the spectral properties at normal incidence, whereas Window considers spectral properties of glazing using different angles of incidence. In order to validate the simulation of the complete thermal problem, isolated glazing was considered. The assumption that indoor air temperature was constant and diffuse indoor irradiance was zero simplified the problem. Two different cases were tested: steady and transient boundary conditions.
3.1. Steady Boundary Conditions
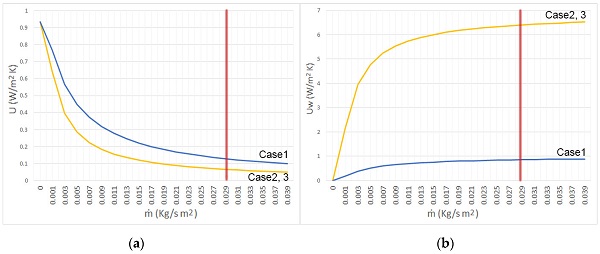
If boundary conditions do not vary with time, the steady state does not depend on thermal mass and specific heat of components. Hence, a benchmark test case based on constant boundary conditions was the easiest way to start with validation. The study comprised three different cases of WFG. When the system was circulating, the design flow rate was 2 L/min m2, and the inlet temperature was set at a constant value θIN. When the flow rate was stopped, the outlet temperature of the water chamber θOUT was called the stagnation temperature. The outputs of these test cases were the thermal power transported by the flow rate and the water heat gain. Figure 4 shows the dynamic U and Uw values defined in Equations (22) and (23). The red line represents the design flow rate (2 L/min m2 = 0.029 Kg/s m2). If the flow rate were above the design value, it would not affect the transmittances.
Equation (24) shows the absorptance, Av, that depends on the energy absorbed by the glass panes and by the water:
![]()
Equation (25) shows that the g-factor for WFG also depends on the mass flow rate:
![]()
where Ai is the secondary internal heat transfer factor. The direct solar energy transmittance (T) is related to the visible and NIR wavelengths. Ai is negligible when the water chamber is facing indoors, but if it is facing outdoors and with high values of hw, Ai can be calculated With Equation (26).
![]()
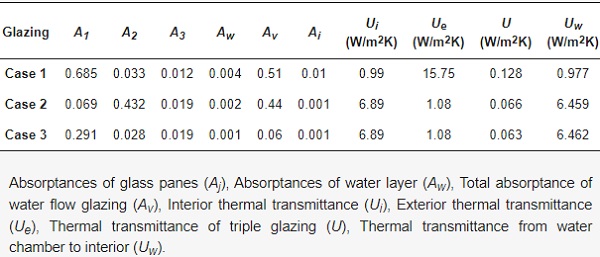
Table 2 shows the thermal transmittance of WFG at the design flow rate. The interior or exterior convective heat transfer mechanism can be modeled by constant values or by more elaborate models given by the norm ISO 15099:2003. By default, constant values of hi = 8 and he = 23 were used. However, by selecting the ISO model, hi and he could be determined precisely using the European Standard [40]. A typical value for the heat transfer coefficient of the water chamber, hw, was 50 W/m2K. The heat transfer coefficient of an argon chamber was hc = 1.16 W/m2K. The air chamber emissivity was very low, so the heat transfer coefficient due to radiation, hr, could be neglected. Therefore, the heat transfer coefficient of the argon chamber, hg = hc+hr, was 1.16 W/m2K. The specific heat capacity of the fluid was c = 3600 J/kg K. A1 is the absorptance of the exterior glass pane, A2, is the absorptance of the middle glass pane, and A3 is the absorptance of the interior one. Aw is the absorptance of the water chamber. The highest Ai (0.01) is shown in Case 1, when the water chamber was placed outdoors.
Table 2. Absorptances and thermal transmittances of WFG (ṁ = 2 L/min m2).
Equation (27) results from solving the equations (9)–(28):
![]()
Equation (28) shows the analytical expression of water heat gain (P).
![]()
where θOUT and θIN are the temperatures of water leaving and entering the glazing, respectively; ṁ is the mass flow rate, and c is the specific heat of the water. By combining Equations (27) and (28), Equation (29) shows the power as a function of absorptance (Av) and thermal transmittances (Ui, Ue).
![]()
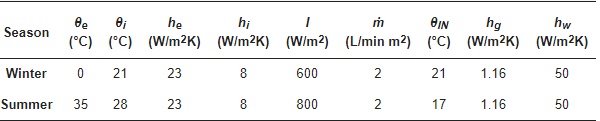
where Av comes from Equation (24). When the system reaches a steady state, the boundary conditions do not change with time. The assumption that solar radiation is perpendicular to the interfaces makes the absorptance of each layer non-dependent of the angle of incidence. When the mass flow rate is high enough (ṁc >> Ue + Ui), the absorbed power (P) reaches its peak value (Pmax). Table 3 shows constant input values in winter and summer conditions. Indoor air temperature (θi), outdoor air temperature (θe), interior and exterior heat transfer coefficients (hi, he), and solar irradiance (I). Equations (29)–(32) were used to calculate Ue and Ui.
Table 3. Constant input parameters in winter and summer.
Once the glazing reaches the steady state in winter and in summer, thermal performances are determined. Using Equations (27) and (29), and considering the inputs in Table 3, Table 4 shows the following outputs in winter and summer, respectively. P is the water heat gain, T is the transmittance of the glazing, θOUT is the outlet temperature when the flow rate is ṁ = 2 L/min m2, and θs is the stagnation temperature when ṁ = 0.
Table 4. Simulation outputs. Steady state in winter and summer conditions.
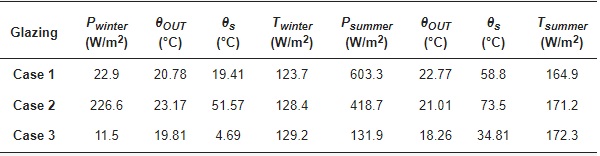
If energy management in winter is based on energy harvesting, Case 2 showed the best performance. Its water heat gain in winter was ten times as high as in Case 1. On the other hand, if energy management in summer is based on energy rejection, Case 3 was the best choice. In summer, the water heat gain of Case 1 was 1.5 times as much as Case 2. When it came to cooling capacity, Case 3 showed the best performance. It had to dissipate around 131.9 W/m2, whereas Case 2 had to dissipate 418.7 W/m2. Case 3 showed excellent properties for energy rejection strategies in warm climates because it showed the least absorbed power in summer, whereas the transmittance (T) was not much higher than in other cases.
Considering the simulation results in a steady state, Case 2 showed the best performance for water heat absorption throughout the year. It was selected for the south elevation. Case 3 showed the best performance for energy rejection, and it was selected for east and west facades. The next subsection studies the simulation results of the selected cases in transient conditions.
3.2. Transient Boundary Conditions
Transient behavior is expected when boundary conditions such as outdoor temperature and solar irradiance vary during the day. In these following test cases, the indoor temperature was a given indoor boundary condition, and transport coefficients remained constant to avoid uncertainties in the validation process. These test cases were simulated in Sofia, and the weather file was the standard EPW file (EnergyPlus Weather). Regarding the water flow glazing, the flow rate and the inlet temperature were constant values given by Table 3. Two simulations in winter and summer were accomplished. The simulation period ran from 7 January to 11 January in winter and from 14 July to 18 July in summer. Figure 5 illustrates the thermal behavior of Case 2 and Case 3. In summer, the solar irradiance peak value was 500 W/m2, and the maximum outdoor temperature was slightly above 26 °C on 14 July 2020. The goal of rejecting energy was met, and the water heat gain, measured by the difference between inlet and outlet temperatures, was not above 1 °C on five sample summer days.
The peak solar radiation in winter on the eastern facade was 180 W/m2 on 10 January 2020. Due to the high infrared reflectance (above 70%) of the selected glazing and the low outdoor temperature (below 5.5 °C), the water heat gains were negligible. According to the steady-state analysis, Case 2 showed the best performance to heat water, as measured by the solar irradiance on the southern facade, the outdoor temperature, and the difference between inlet and outlet temperatures in southern WFG modules. In summer, the peak solar radiation was 400 W/m2, and the maximum temperature was above 26.5 °C on 15 July 2020. On that day, the maximum outlet water temperature was 22 °C when the inlet temperature was 20 °C, and there were water heat gains during the central hours of the day. In winter, the peak solar radiation was above 250 W/m2, and that made the water absorb heat, although the outdoor temperature was low.
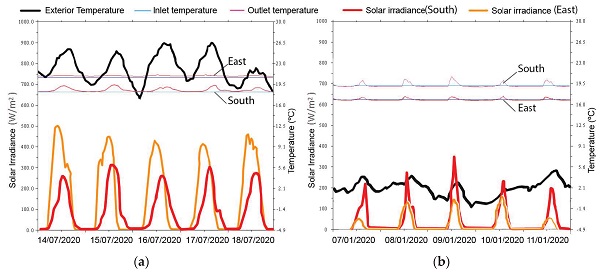
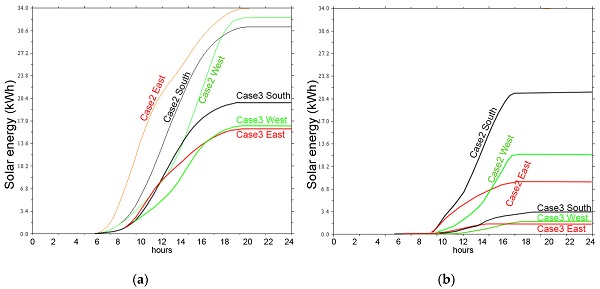
Figure 6 shows a summary of the water heat gains on two sample days in summer and winter. Case 3 was selected for eastern and western facades because it showed the least heat absorption in summer (17 KWh), whereas Case 2 showed the highest absorption in summer (34 KWh). To reject energy, the best choice for eastern and western facades was Case 3. Case 2 had the highest heat absorption on a winter day (21 KWh) and a good value in summer (30.5 KWh). Case 2 confirmed its excellent performance on southern facades.
3.3. Real Results in Sofia, Bulgaria
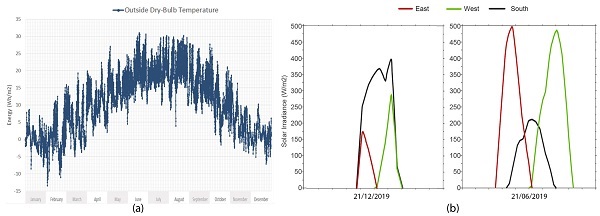
An experimental setup was placed in Sofia, Bulgaria (42°39’1” North, 23°23’26” East, Elevation: 590 m a.s.l.), to test the performance of isolated WFG modules throughout a year. Figure 7 shows the outdoor temperature. On the coldest winter days, the minimum temperature was below −10 °C, and the average daily temperature was 0 °C. During the hottest months, the maximum temperature reached 32 °C and the average temperature was 25 °C. The southern solar radiation reached a peak value of 400 W/m2 on 21 December 2019, whereas the eastern and western were 160 W/m2 and 270 W/m2, respectively, on 21 June 2019. On summer days, the highest values were on the east and west facades (500 W/m2) because the sun angle was almost perpendicular to the vertical walls. The south facade received little radiation (200 W/m2).
Based on the outdoor simulation data, and the thermal and spectral properties of the studied WFG in Table 4, the best option for the southern facade was Case 2. It showed the highest potential for heat absorption in winter (226.6 W/m2) with the highest outlet temperature (23.17 °C). In summer, the maximum southern solar radiation was 200 W/m2, whereas the absorption potential was 418 W/m2, so the fluid could absorb the heat without heating the interior face of the glazing. Due to the high solar radiation in summer, the best option for eastern and western facades was Case 3. It showed the lowest absorption in summer (131.9 W/m2) with the lowest outlet temperature (18.26 °C). Figure 8 shows the prototype plan, with five modules facing east, five modules facing west, and five more modules on the southern facade. Unitized WFG modules were placed in three different orientations (east, south, and west) with a pyranometer measuring solar radiation on each facade. Each heat plate exchanger of the circulating device was connected to inlet and outlet water distribution systems.
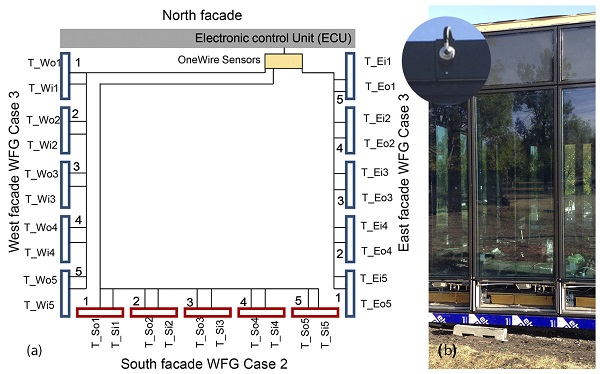
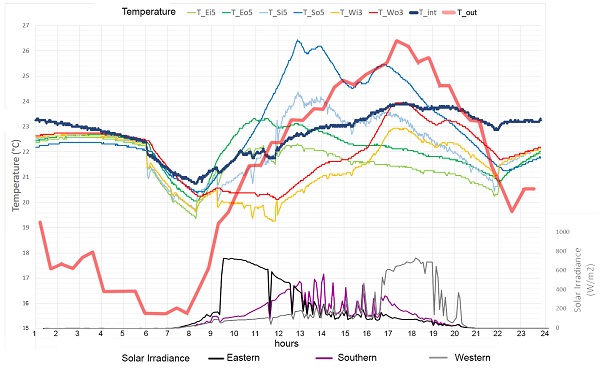
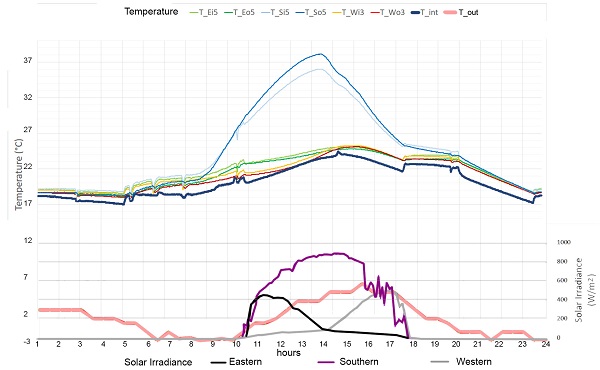
The output signals were collected by one-wire probes and sent to an electronic control unit (ECU), where the developed software processed the calculations and elaborated the energy outputs. The temperature sensor network was installed in both the inlet and outlet of the plate heat exchanger. Flux meters were added to the monitoring equipment to keep a steady mass flow rate through all the modules. The temperature difference in the external WFG elements could reach 10 °C, depending on the exterior conditions. Glass selection for renewable production on the southern facade (Case 2) absorbed the maximum incident solar radiation and at the same time reduced indoor solar heat gains. A heat pump was used to control the inlet temperature. Figure 9 illustrates the outdoor air temperature (T_out), inlet (T_Ei5) and outlet (T_Eo5) temperatures in two eastern WFG modules in summer conditions.
The maximum temperature difference occurred from 7:00 a.m. to 10:00 a.m., when the solar radiation reached its peak value on the east facade. The southern modules’ inlet and outlet temperatures (T_Si5, T_So5) reflected the solar radiation and outdoor temperature, and there were two peak values at 11:00 a.m. and 4:00 p.m. The maximum temperature difference between T_So5 and T_Si5 was 2 °C. The maximum temperature difference between the inlet (T_Wi3) and outlet (T_Wo3) temperatures in two western WFG modules occurred at 4:30 p.m., when the solar radiation reached its peak value on the west facade. The real measurements confirmed the simulation results because, despite the high solar radiation values on the eastern and western facades (700 W/m2), the temperature difference between inlet and outlet was 1 °C. However, in the southern modules, the temperature difference was 2 °C when the maximum solar radiation was 470 W/m2.
In winter, heat absorption does not depend directly on solar radiation due to the severity of climatic conditions. The difference between indoor and outdoor temperatures affected energy performance more than the solar radiation on the eastern and western facades. Figure 10 illustrates the outdoor air temperature (T_out), the inlet (T_Ei5) and outlet (T_Eo5) temperatures in two eastern WFG modules. The southern WFG performance showed heat losses in the morning and in the afternoon. From 10:00 a.m. to 5:00 p.m., the outlet temperature (T_So5) was higher than the inlet (T_Si5), and the maximum difference reached 2.5 °C at 1:30 p.m. In western modules, the inlet (T_Wi3) and outlet (T_Wo3) temperatures showed that there were heat losses in the morning with no solar radiation and low outdoor temperature. The simulation results were validated with little energy absorption on eastern and western facades, and heat gains in the southern modules.
4. Discussion
The next step was to analyze the results in terms of potential energy savings. Firstly, the results of the simulation tool were validated. Secondly, the heat absorbed by water in summer can be both subtracted from the cooling loads and considered as renewable energy production. According to the Energy Performance of Buildings Directive (EPDB 2018) recommendations [2], primary energy factors (PEFs) were used to assess the energy performance.
4.1. Validation of Energy Performance
To validate the selection of WFG, the daily absorbed energy per unit of area was calculated using Equation (29). Figure 11 shows the performance of two WFG panels in winter in three orientations. As expected, the eastern and western panels’ energy absorption was not relevant. Most of the time there were heat losses due to the little radiation and the low outdoor temperature. A different performance was shown in the southern panels, where the daily absorbed energy was 21.3 kWh in 7.8 m2, so the ratio of energy per area was 2.73 kWh/m2.
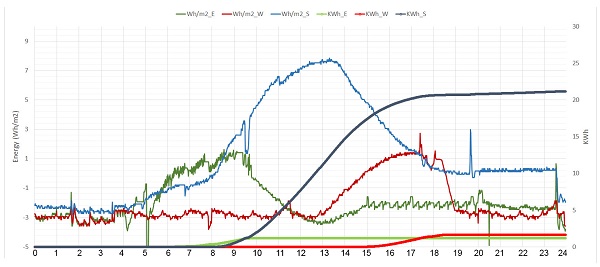
Figure 12 shows the energy performance on a sample summer day (14 July 2020). The total absorbed energy was 30 KWh in two southern WFGs, 18.6 KWh in two western WFGs, and 15.9 KWh in two eastern WFGs. The energy-to-area ratio was 3.85 kWh/m2 in the south, 2.38 kWh/m2 in the west, and 2.04 kWh/m2 in the east.
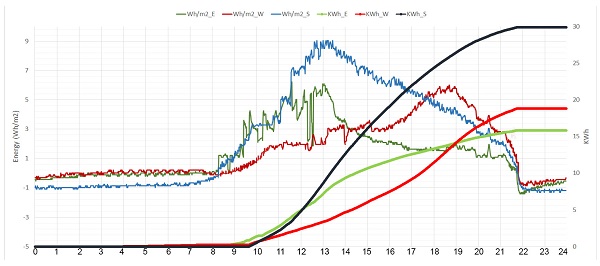
The goal of rejecting energy in the east and west was met. Despite the high solar radiation, the water heated up by 2 °C, and most of the infrared energy was rejected. On the south facade, the energy absorption was similar in winter and summer, and the water heated up around 3 °C. The reliability of the simulation tool was tested by developing real prototypes. Figure 13 illustrates the comparison between the results of the real data and the simulation data. The daily energy absorption on southern facades in winter and summer were taken from Figure 11 and Figure 12 and compared with the simulated results from Figure 6.
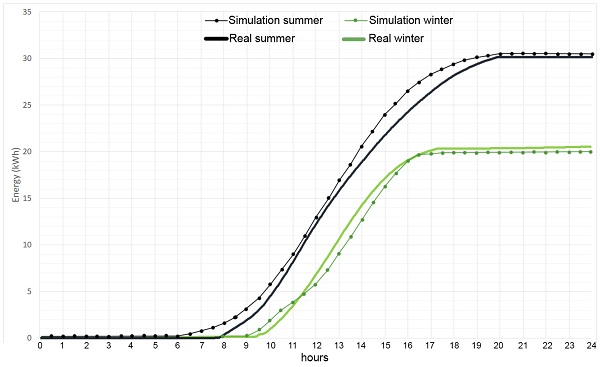
The Mean Error (ME), shown in Equation (24), is the difference between the measured value and simulation results. The total number of measurements was n = 2872.

where ESi is the simulated energy absorption, and ERi is the measured energy absorption. By computing ME on 14 July 2020 the value was 0.78. When it came to the energy absorption on 8 January 2020, the ME was 0.67. The reason for this might be the uncertainties about the inlet and indoor temperatures. Although the accumulated energy values were quite similar in the simulation and the real conditions, the intermediate values differed at some times of the day. The simulation tool could not work with variable inlet and indoor temperatures, which is the main goal for further research.
4.2. Primary Energy Consumption
Figure 14 shows the outdoor air temperature and the accumulated energy throughout five days in summer. WFG absorbed solar energy and prevented it from entering the building. The amount of energy absorbed by the water could be connected to the district heating network, geothermal boreholes, or to domestic hot water devices. In the final energy balance, the accumulated energy was subtracted from the cooling loads and added to the renewable energy production.
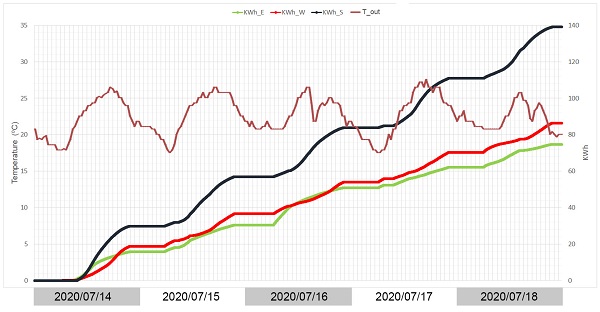
Article 41 of the Energy Performance of Buildings Directive (EPDB 2018) recommended the use of primary energy factors to calculate the energy parameters of building envelopes [2]. Table 5 shows these energy factors, such as cooling energy demand (CED in kWh/m2), final energy consumption (FEC in kWh/m2), non-renewable primary energy consumption (NRPEC in kWh/m2). The energy absorbed by the water was considered as renewable primary energy production (RPE in kWh/m2) and CO2 emissions (kg CO2/m2). The electricity consumption of the circulation water pumps was not considered because they were connected to photovoltaic panels. The circulation pump was working 24 h per day. The primary energy factor (PEF) is the inverse of electricity production efficiency from fuel source to electricity at the building, taken from official European Union documents [42,43], if the energy was produced using heat pumps, considering a Coefficient of Performance (COP) of 2.5 and a conversion factor between final energy and non-renewable primary energy (KWh NRPE/KWh FE) of 1.954. The factor of emitted CO2 for electricity was 0.331.
Table 5. Primary energy balance of WFG in summer.
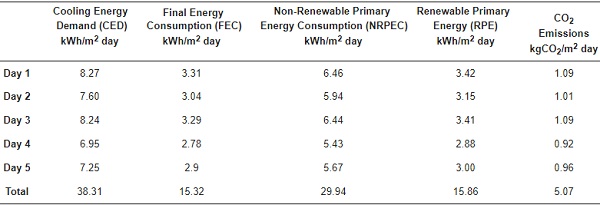
Table 6 shows the estimated winter heating loads over the working hours. Indoor (T_int) and outdoor (T_ext) temperatures were taken from Figure 10 with a surface area of 3.9 m2. The same procedure was repeated to calculate the values on five sample days. A high-performance triple glass made of three glass panes with an argon chamber and Low-E coating was compared with the selected WFG cases. The triple-glass U value was taken from a glazing catalog [41], whereas the U value of the WFG was defined in Table 1. The total heat losses through the passive triple glazing and the WFG were 288.38 Wh/m2 and 15.31 Wh/m2. The energy savings per day was 273.07 Wh/m2. In addition, the WFG was able to produce renewable energy.
Table 6. Winter heating loads on 14 January 2020.
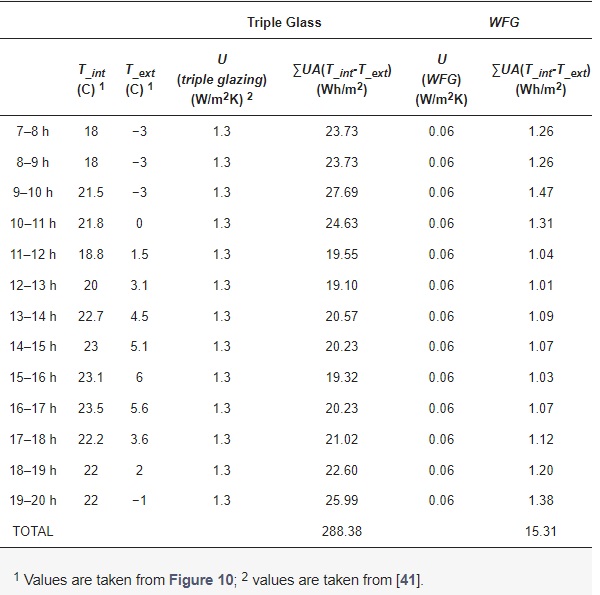
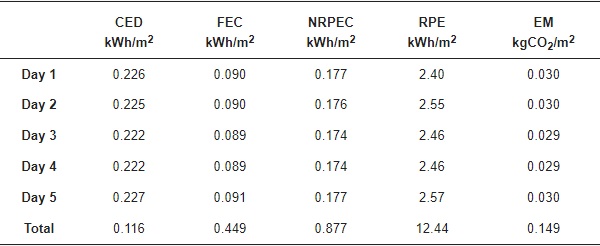
Table 7 illustrates the primary energy savings, the reduction of CO2 emissions, and renewable energy production of WFG in five winter days.
Table 7. Primary energy balance of WFG in winter.
4.3. Cost Considerations
The ideal project for these advanced facades would be a large tower-type office building with limited site access. The facade should consist of repetitive geometry that can be divided easily into panels. The system would not be fit to have movable windows, so special modules for openings and mechanical ventilation systems are required. A literature review was carried out to assess the cost and the performance of advanced facades [44,45,46]. The unit costs of the components included the material, production, and assembly costs. These values are the average of the unit costs taken from two different passive curtain wall systems [47]. The cost analysis for the WFG-unitized facade considered a triple glass described in Case 2, the total estimated costs for aluminum production, module fabrication, on-site transportation, and facade assembly. The energy values were calculated with the indoor and outdoor temperatures shown in Figure 9 and Figure 10 for sample summer and winter days, respectively. The energy parameters and construction costs calculated for all the alternatives are shown in Table 8.
Table 8. Energy and cost parameters.
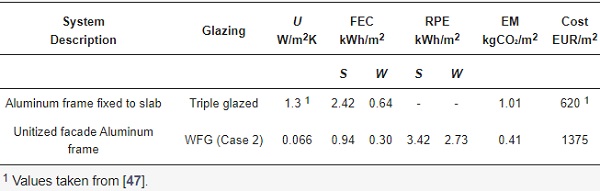
The initial costs of the WFG made up of the triple glazing, the circulating device, and the unitized aluminum frames were high, compared to passive glazing systems. However, a holistic approach should include energy savings, energy production, and CO2 emissions. The total final energy consumption was 3.06 kWh/m2 for the standard triple-glazed lightweight enclosure and 1.24 kWh/m2 for the WFG. When it came to CO2 emissions, the standard curtain wall solution would account for 2.5 times as much CO2 as the studied WFG.
5. Conclusions
The design of new light envelopes for zero-energy buildings must integrate different disciplines such as architectural design, building simulation, HVAC systems, and the curtain wall industry. This article developed a methodology for selecting WFG solutions for different facades and tested its performance using real data. Case 1 was a triple glazing with the water chamber facing outdoors. Case 2 was made of triple glazing with water chamber indoors and Low-E coating. Case 3 had a high reflective coating on face 2 and a water chamber indoors.
- Dynamic properties of WFG allowed considering options for different orientations and the internal loads, which depend on the building use. The thermal transmittance (U) ranged from 1 W/m2K (ṁ = 0) to 0.06 W/m2K (ṁ = 2 L/min m2). A mass flow rate (ṁ) above 2 L/min m2 (0.029 Kg/s m2) did not impact the water–energy absorption.
- The position of the gas and water cavities and the spectral properties of glass panes and coatings affected the performance of the WFG. Simulation results at steady conditions showed that Case 2 had the best performance for energy absorption in winter (226.6 W/m2). Case 1 showed the highest energy absorption in summer (603.3 W/m2). Case 3 showed the lowest energy absorption, both in summer (131.9 W/m2) and winter (11.5 W/m2).
- The primary energy factor (PEF) was used to assess building energy performance. Energy savings ranged from 5.43 to 6.46 KWh/m2 day in non-renewable energy consumption, whereas the renewable primary energy production ranged from 3 to 3.42 KWh/m2 day. The CO2 emissions were reduced at a rate of 1 Kg/m2 day.
- In the cold winter season, the absorbing south facade heated water (2.73 kWh/m2), whereas eastern and western facades received very little solar radiation.
- In summer, eastern and western facades rejected most of the solar radiation, and the flowing water was heated without surpassing the comfort temperature. The maximum outlet temperature was 24 °C on 14 July 2020. The daily absorbed energy was 3.84 KWh/m2 in the southern WFG, 2.38 KWh/ m2 in WFG, and 2.04 KWh/ m2 in WFG.
This article showed an industrialized water flow glazing unitized facade ready to be used in the architecture, engineering, and construction industries. The authors developed a simulation tool to be used at the first stage of the design process. The outputs were validated with an actual test facility placed in Sofia, Bulgaria. The difficulties identified were related to the limitations of the software for simulating the dynamic properties of WFG. The high initial cost and the need for an energy management system integrated with the rest of the equipment conditioned the WFG system. After the first year of monitoring, there are uncertainties and system issues that must be addressed. Firstly, the control unit must integrate the ventilation system to reduce condensation risks. Secondly, the presented simulation tool must be integrated into commercial building performance simulation software. Finally, further research on the deployment is needed to bring down payback periods.
With economies of scale a price comparable to triple-pane glazing systems equipped with automated exterior shading can be achieved.
Author Contributions
Conceptualization, B.M.S., F.d.A.G., J.A.H.R.; methodology, B.M.S., F.d.A.G.; software, J.A.H.R.; formal analysis, B.M.S., F.d.A.G.; data curation, J.A.H.R.; writing—original draft preparation, B.M.S., F.d.A.G., J.A.H.R.; writing—review and editing, F.d.A.G., D.P.; visualization, B.M.S., F.d.A.G., B.L.A.; supervision, J.A.H.R., B.L.A.; project administration, B.M.S.; funding acquisition, F.d.A.G. All authors have read and agreed to the published version of the manuscript.
Funding
This article has been funded by a KSC Faculty Development Grant (Keene State College, New Hampshire, USA).
Acknowledgments
This work was supported by program Horizon 2020-EU.3.3.1: Reducing energy consumption and carbon footprint by smart and sustainable use, project Ref. 680441 (InDeWaG: Industrialized Development of Water Flow Glazing Systems). Special thanks to the Central Laboratory of Solar Energy and New Energy Sources of the Bulgarian Academy of Science (CL SENES–BAS) for providing measured data of the solar radiation on the different facades of the test facility in Sofia, Bulgaria.