Authors: Laura Galuppi & Enrica Riva
Source: Glass Structures & Engineering | https://doi.org/10.1007/s40940-022-00166-0
Abstract
The use of new generation thin, lightweight and damage-resistant glass, originally conceived for electronic displays, is moving its first steps in the built environment, in particular for adaptive and movable skins and façades. Its experimental characterization represents pearhaps one of the main open problems in glass research and engineering. Indeed, standard methods to test the glass strength cannot be used, due to geometrical nonlinearities, thwarting the correct procedure and the strenght calculation.
Here, an innovative test procedure is proposed, where a rectangular thin glass element is twisted with high distortion level, while rigid elements constrain two opposite plate edges to remain straight. A dedicated experimental apparatus, that can be used to test specimens with different size and thickness, has been designed and used to test, up to rupture, chemically tempered thin glass with thickness of 1.1 mm and 2.1 mm. Experimental results have been compared to those of numerical analyses, with particular regard to the influence of different constrain conditions on the plate response.
Introduction
The external skin of a building delimits the indoor space, controls the energy transfer between inside and outside and defines the aesthetics of the building. As the demand for complex geometries and improved performances increases, innovative and non-uniform envelope solutions have to be devised. In very recent years, the use of highly deformable thin glass, with thickness lower than 2 mm, originally conceived for panel displays and screens, is moving its first steps in the built environment (Silveira 2016; Ganatra 2016).
The first structural use of thin glass was as flat panels (Oliveira Santos et al. 2018), in overhead glazing with long spans, where its high strength and low self-weight are a benefit. More recently, several authors have suggested to better exploit its high deformability by cold bending it, to gain structural stiffness in static use in curved design or membrane structures replacing the expensive process of bending glass at high temperatures (Neugebauer et al. 2018).
Furthermore, it is suitable to be used in kinematic or adaptive designs (Topçu 2017; Silveira et al. 2018; Bedon et al. 2018), where its high flexibility allows for changes in orientation and position by bending the elements, avoiding the use of hinges in systems of foldable rigid panels. This has suggested its use for structures suitable for strong modification of shape and openings, as stadium roofs, lightweight retractable canopies (Neugebauer 2015) and movable greenhouses (Galuppi 2018; D’Ambrosio and Galuppi 2019).
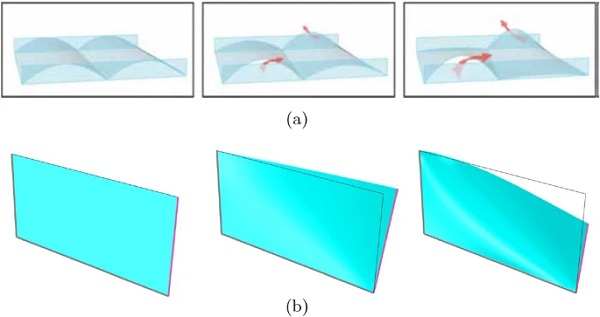
When a thin glass pane is free to deflect along its entire perimeter, it tends to deform into single-curvature shapes. Indeed, in this case the plate response is governed by the inextensional theory proposed by Mansfield (1955), according to which a thin flat plate tends to deform into a developable surface, as a cylindrically or conically shaped geometry, allowing to maintain a low stress level (Neugebauer et al. 2018). However, by stiffening two or more plate edges, shapes with double-curvature regions, in proximity of constrained edges and corners, can be obtained1, as shown by the examples of Fig. 1.
All those structural applications require the determination of the thin glass strength. Due to its extreme deformability, it cannot be characterized by means of the standard tests prescribed by EN ISO 1288 (2016), i.e., the coaxial double ring test (Pisano and Royer Carfagni 2016; Castori and Speranzini 2019), used for applications where the edge is not loaded, and the four-point bending test, where also the glass edges are stressed. Indeed, for the former case, non-linear effects at the edges arose due to the large deformation, leading to significant asymmetric deflections at the corners of the sample (Neugebauer 2016).
For the latter test, large deformations implies a large axial displacement of the beam ends, that should be accommodated by the constraints (otherwise, the panel would slip between the supports), and the bearing forces are no longer vertical but inclined (Siebert 2013). This will have a growing (and non-linear) influence on bending moment and therefore on the bending tensile stress, that is quite difficult to evaluate.
Another technique widely used for glass of standard thickness (of the order of 10 mm) is the in-plane four-point bending test (Biolzi et al. 2010; Speranzini and Agnetti 2014; Biolzi et al. 2016), where the glass panel is loaded by in-plane forces. Due to the extreme slenderness of the sample, lateral constrains must be used to prevent lateral torsional buckling. However, this is difficult to be performed on thin glass specimens (Oliveira Santos et al. 2018) because the instability phenomenon cannot be completely avoided, and this resulted in a non-linear relation between applied load and displacement. Only a few authors have suggested innovative experimental methods to determine thin glass strength, but they are far to be exhaustive.
A first one, called multiple point bending, consists in introducing additional bearing and loading rollers in a four-point bending test (Siebert 2013; Neugebauer 2016), so to decrease the specimen deflection. Due to disadvantage of tensile stress on both glass surfaces, and to the sensitivity to the initial shape imperfections, this test has been investigated only from a theoretical point of view (Siebert 2013). A second one is bending induced by in-plane compressive force (Neugebauer 2016; Oliveira Santos et al. 2018), exploiting the Eulerian instability of the glass panel. This is difficult to control, because the relation between the applied load and the out-of-plane deflection strongly depends upon the geometric and material imperfection. This is why, currently, there are no standardized methods to characterize the thin glass strength, nor extensive experimental data available.
Here, an innovative test procedure is proposed, where a rectangular thin glass element is stiffened by steel rollers constraining the short edges to remain straight, and then twisted at high distortion levels. This allows to characterize the overall response of thin glass under twisting, in particular for what concerns the deformed shape of the plate, the achievable level of distortion, as well as the buckling phenomenon. Since these features have a particular relevance from the architectural point of view, we repute that the proposed innovative test could increase the confidence in the structural use of thin glass.
First, a preliminar analytical and numerical study has been performed to evaluate the gross response of the twisted panel. Based on the output of this study, a dedicated experimental apparatus, that can be used to test specimens with different size and thickness, has been designed and constructed at University of Parma (Italy). The experimental program comprised 11 destructive tests on chemically tempered thin glass, with thickness of 1.1 mm and 2.1 mm. The comparison between experimental and numerical results has allowed not only to evaluate the influence of the constrain condition on the plate response, but also to estimate the thin glass strength.
Preliminar analytical and numerical modelling
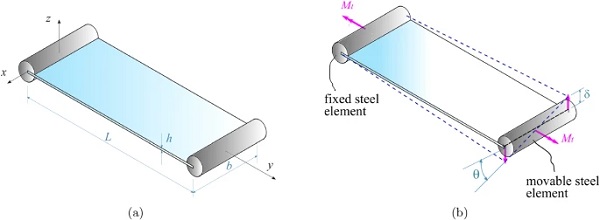
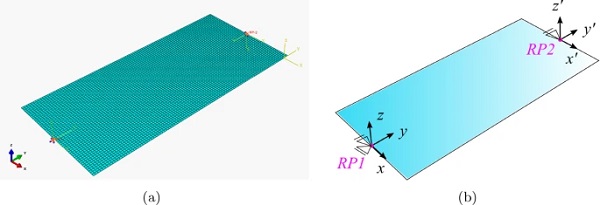
The considered model problem is the rectangular plate of length L, width b and thickness h shown in Fig. 2a, subjected to twisting. Consider the (x, y, z) reference frame shown in the same figure.
The twisting is performed by stiffening the shorter edges of the glass panel, by seating them in the slit of steel rollers. The panel is subjected to a torque Mt, as indicated in Fig. 2b, applied by prescribing a relative rotation of the short edges. In particular, this will be done by keeping fixed the steel element at y=0, while prescribing a rigid rotation θ of the steel element at y=L, as schematically shown in Fig. 2b.
Analytical modelling of large deflection twisting
Linear response
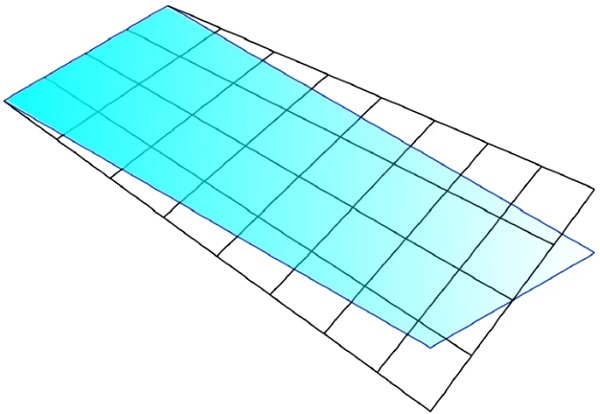
The linear Kirchhoff-Love plate theory predicts that, when subject to torsion, applied for example through the action of opposite concentrated loads F at the plate corners (Timoshenko and Woinowsky-Krieger 1959; Galuppi and Royer-Carfagni 2015a), a rectangular plate deforms into a hyperbolic paraboloid shape. This is a double-ruled surface shaped like a saddle, where the two diagonals are parabolas with opposite concavity, shown in Fig. 3 (Galuppi et al. 2014). In this configuration, the plate edges, as well as the fibers initially parallel to the edges, remain straight. For the considered geometry, the out-of-plane displacement may be written as
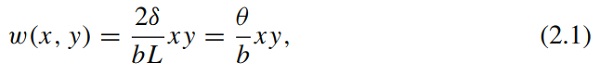
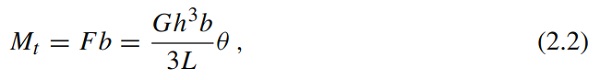
where δ is the corner out-of-plane displacement, as indicated in Fig. 2b. The correspondent twisting moment is given by Timoshenko and Woinowsky-Krieger (1959), Galuppi and Royer-Carfagni (2015b)
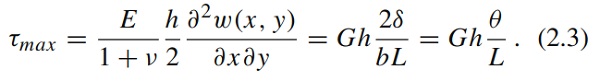
while the maximum shear stress is related to θ and the corners out-of-plane displacement δ by (Timoshenko and Woinowsky-Krieger 1959)
Analogue results may be obtained by considering the de Saint-Venant beam theory. The maximum torsion angle θ¯ and the maximum corners’ displacement δ¯ may be evaluated by means of formula (2.3), by considering as τmax the ultimate strength of thin glass2. According to Neugebauer (2015), this can be assumed equal to 150 MPa, correspondent to the characteristic value for chemically pre-stressed glass3.
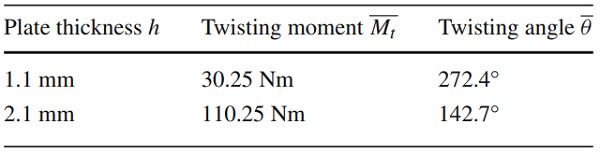
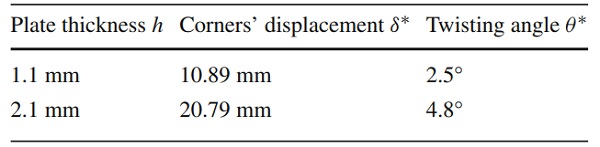
The geometry considered for the experimental test is a plate of length L = 1000 mm and width b = 500 mm, with two different thickness, i.e., h = 1.1 mm and h = 2.1 mm. The correspondent twisting moment and torsion angle at the glass failure, evaluated by considering standard values for the glass mechanical properties (Young’s modulus E=70000 MPa and Poisson’s coefficient ν=0.22) are recorded in Table 1. Notice that these values are far above the limits of the linear theory! Hence, the study of the specimens response must necessarily consider the non-linear response of the thin glass element.
Table 1 Twisting moment and torsion angle correspondent to a maximum tensile stress of 150 MPa - Full size table
Arising of instability
Consider, first, a twisted glass plate with free edges. As extensively discussed in Staaks (2003) and Galuppi et al. (2014), above a certain limit of distortion, it exhibits a particular form of instability, where the deformed configuration tends to lose its symmetry: one of the diagonals straightens, while the curvature increases in the direction of the second diagonal, and the edges considerably bend. Obviously, there are two equivalent buckling configuration, where bending occurs mainly along one diagonal, or along the other. In Galuppi (2018), it has been demonstrated that, for thin glass (h< 2 mm), this kind of instability arises for very low distortions levels, inappreciable with the naked eye.
This is due to the fact that, for large displacements, the deformation of the flat plate into a hyperbolic paraboloid shape entails strong membrane stress, that are neglected in the linear theory, associated with noticeable middle surface strains, leading to a noteworthy increase in elastic energy. Hence, for the plate it is convenient, from an energetic point of view, to deflect into a developable surface, i.e., a surface that can be flattened onto a plane without distortion. This deformed configuration entails no stretch nor compression of the mid-surface of the glass (i.e., no membrane stress), and the plate tends to resist the applied loading by its flexural rigidity only (Mansfield 1955; Neugebauer et al. 2018). In the case of a peripherally free square plate subjected to twisting, the deformed shape is a cylindrical surface, with generators parallel to one of the diagonals (Mansfield and Kleeman 1955).
Several researchers have studied the arising of this kind of instability, mainly from the experimental and the numerical point of view (Datsiou and Overend 2016; Hoffmeister et al. 2017; Spagnoli et al. 2019; Quaglini et al. 2020), considering glass plates of standard thickness (of the order of 10 mm). In (Staaks 2003), Staaks proposed an empirical formula to evaluate the buckling limit δ∗, defined as the maximum prescribed corners’ displacement above which the instability arises, for square panels with standard thickness, with free edges. In Galuppi (2018), it has been confirmed that this relation holds also for thin glass, and it has been extended to rectangular panel with different aspect ratio λ>1, in the form
![]()
The corresponding twisting angle at the arise of instability may be evaluated as θ∗=arcsin(2δ∗/b). For the considered panel geometry, values of corners’ displacement and twisting angle at the instability arising are recorded in Table 2. These values are very low, confirming the findings of Galuppi (2018). Notice that the values of the twisting angle correspondent to buckling limits, θ∗, are consistently lower than the values of θ¯ recorded in Table 1.
Table 2 Corners’ displacement and torsion angle correspondent to the instability arising, evaluated as per Eq. (2.4) - Full size table
Consider now the case where the plate edges are stiffened, for example by means of metallic braces. As discussed in Galuppi et al. (2014), since the buckled configuration of the plate is characterized by the curvature of its edges, this represents a practical solution to increase the stability range. A buckling state may be achieved also for this arrangement, but for higher distortion levels (Galuppi et al. 2018; Nehring and Siebert 2018). Notice that, since below the instability limit the deformed shape is a double-curvature anticlastic surface, the use of rigid frame may be regarded as a way to keep an anticlastic shape, also for high distortion levels. Hence, when the edges are constrained, or stiffened, the deformed shape can be with double curvature; this may be true also if only two or three are stiffened/constrained, as depicted in Fig. 1.
Since no approximated formulas analogue to (2.4) are available for panes with two stiffened edges, here eq. (2.4) is used to provide a qualitative indication about the order of magnitude of the twisting angle for which the buckling occurs.
Preliminary numerical analyses
As discussed in the previous section, the analytical description of the twisting response of thin glass elements stiffened at two opposite edges is far to be exhaustive. Hence, to evaluate the torsional response in a more precise manner, FEM simulations have been performed. These allow to evaluate, at least as a first approximation, geometrical and mechanical parameters of the experimental setup (maximum twisting angle, out-of-plane displacement, torque at failure, etc.), strongly helping the design and dimensioning of the test equipment.
Numerical analyses have been performed with ABAQUS (2010), by modelling the glass panel as a 2D shell geometry, as shown in Fig. 4, discretized by using 4-node, quadrilateral, stress/displacement shell elements with reduced integration and large-strain formulation, accounting for finite membrane strains and arbitrarily large rotations (S4R in the code library ABAQUS 2010). The structured mesh is composed by 10 mm × 10 mm square elements4. The glass has been modelled as a linear elastic material, with standard values of E and ν.
The action of the steel elements has been modelled by coupling the nodes lying on the short edges of the plate with reference points RP1 and RP2 shown in Fig. 4. The former, at y=0, corresponds to the fixed steel element (see Fig. 2b), while the latter is at y=L, in correspondence of the movable steel element. Here, an auxiliary reference system (x′,y′,z′), following the edge rotation, has been defined (see Fig. 4b).
The coupling between the plate geometry and the reference points has been prescribed on the out-of-plane displacement (z and z′ directions), as well as on y and y′ rotational degree of freedom. Since the glass element is supposed to be free of slide in the steel braces5, the in-plane displacements (in x and y directions for the fixed edge, and in x′ and y′ directions for the movable edge) and rotation (about the z and z′ axis, respectively) have not been coupled. As depicted in Fig. 4b, to avoid rigid body displacement and rotations of the glass element, in-plane x and y displacements have been prevented at the midpoint of the fixed short edge; at the same time, x displacement has been prevented at the midpoint of the movable short edge.
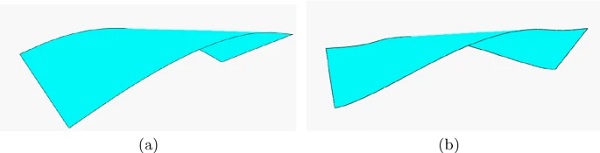
The relative rotation about the rollers axis (x and x′) deserves a more detailed discussion. Indeed, the constrain condition depicted in Fig. 2 allows for a moderate rotation of the glass element inside the slit, possibly limited by the presence of materials interposed between steel and glass to avoid their direct contact. Henceforth, in the FEM analyses both the case of free and prevented rotation of the glass plate inside the slit will be considered. From the numerical point of view, these conditions correspond to uncoupled and coupled rotation about x (and x′) axis of the nodes lying on the short edges of the plate with RP1 (and RP2). In the sequel, these coupling conditions will be compactly denoted as “UR1-free” and “UR1-prevented”. The actual response of the twisted glass panel is expected to be somehow intermediate between these two limits. Remarkably, these would lead to different deformed shapes, as qualitatively shown in Fig. 5.
The numerical simulations are divided into two load steps. First, displacements and rotations of both reference points are prevented, and the self weight of the glass panel is applied as a gravity load. Notice that, since this drives the plate towards one of the two equivalent buckled configurations, it allows to avoid risks due to numerical instability and to enhance the rate of convergence of numerical computations (Galuppi et al. 2014). Then, the plate twisting is performed by preventing all rotation and displacements of RP1, and by prescribing a rigid rotation of 50∘ about the y axis at RP2, while blocking its other degrees of freedom. Non-linear geometric analyses have been run.
Evaluation of the instability onset
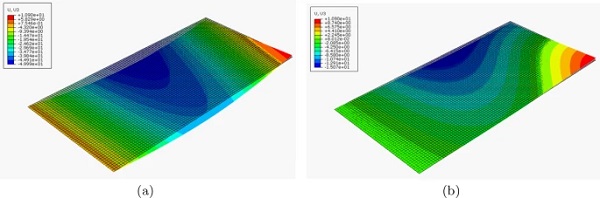
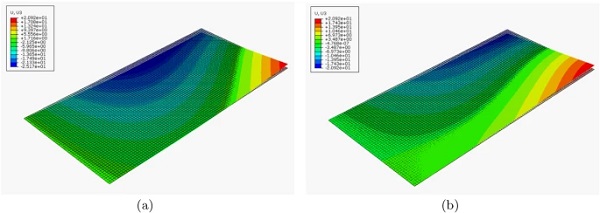
First, to evaluate the arising of the instability, preliminary analyses have been run by considering the approximate critical value of twisting angle recorded in Table 2. For the case h=1.1 mm, Fig. 6a and 6b show the out-of-plane displacement, plotted on the panel deformed shape, for the cases of free and prevented rotation about the roller axis, respectively. Due to the self weight, out-of-plane displacements are directed downward.
In the former case (UR1-free), the out-of-plane displacement is almost symmetric with respect to the y axis. This is due to the effect of the self-weight, that causes a maximum deflection of the order of 50 mm, consistently higher than the out-of-plane displacement due to twisting, that is of order of 10 mm (see Table 2). On the contrary, in the latter case the two contributions are comparable, and the deformed shape is mainly influenced by the twisting.
Figure 7 is the analogue of Fig. 6, for the pane 2.1 mm thick. In this case, being the panel thicker, the contribution of the self-weight is less relevant.
For both the considered values of thickness, it may be noticed that, even for these low values of the corners displacement, the deformed shape is strongly asymmetric, meaning that the instability, driven by the effect of the self-weight, has already arose.
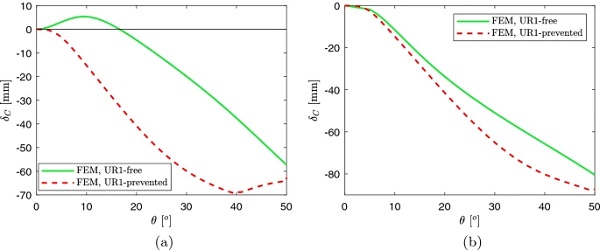
The buckling occurrence may be detected by measuring the out-of-plane displacement of the plate center with respect to its position in the reference configuration (Galuppi et al. 2014, 2018), denoted in the sequel as δC. Since the deflection due to the self weight may be comparable with that due to twisting, we have chosen as reference configuration the deformed shape of the panel due to the self-weight only6 (i.e., at the end of the first load step of the numerical analyses). Before buckling occurs, the deformed shape is a hyperbolic paraboloid and δC=0. The buckling limit may be conventionally defined as the maximum distortion that can be prescribed to obtain δC< 1 mm (Galuppi et al. 2018).
Figure 8 shows the numerically evaluated δC as a function of the twisting angle θ, up to 50∘. Figure 8a refers to the plate 1.1 mm thick, while Fig. 8b to h=2.1 mm, for the two different constrain conditions.
The plate response is strongly influenced by the constrain condition, whose influence is more relevant for the plate 1.1 mm thick. For h=1.1 mm, θ∗ is of the order of 2.5∘ for the UR-free case, and θ∗≃3∘ for the UR-prevented case. In the former case, δC is initially positive, i.e., the displacement due to the self weight is decreased by the effect of the twisting. On the contrary, in the latter case the twisting increases the absolute value of δC. Notice also that the absolute value of δC decreases for θ>40∘; this correspond to a secondary form of instability, where the plate diagonal tends to straighten. For h=2.1 mm, the instability arises for θ∗≃4∘, for both the considered constrain conditions.
The origin of the different response of plates 1.1 mm and 2.1 mm thick is to be found in the higher deflection experienced by the thinner plate under self-weight in UR1-free case (see Fig. 6a), that strongly influences the first stages of the twisting. In both cases, the obtained values of θ∗ are in good agreement with those recorded in Table 2. The three dimensional plots of the out-of-plane displacement for values of the twisting angle up to 50∘ are recorded in Appendix A.
Relationship between twisting angle, torque, and stress field
The twisting moment has been numerically evaluated as the moment reaction in correspondence of RP1 (see Fig. 4b). Figure 9 shows the relation between twisting angle and torque, for the two different coupling condition and for the two considered panel thickness. The linear solution (2.2) is also plotted for the sake of comparison.
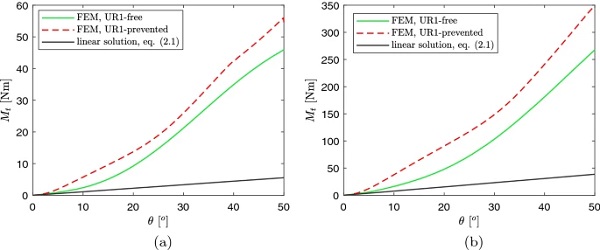
For very low values of θ, i.e. below the buckling limit, the numerically obtained curves are almost linear, and coincide with the linear solution. For higher values of θ, the relation between torsion angle and twisting moment becomes non linear, with increasing slope. This means that the actual response of the panel is consistently stiffer than what predicted by the linear theory; notice that the twisting moment for θ=50∘ is about 7–8 times higher than the linear solution for coupling condition “UR1-free”. For condition “UR1-prevented”, the plate stiffness is even higher, leading to a twisting moment about 9–10 times higher than that predicted by the linear solution.
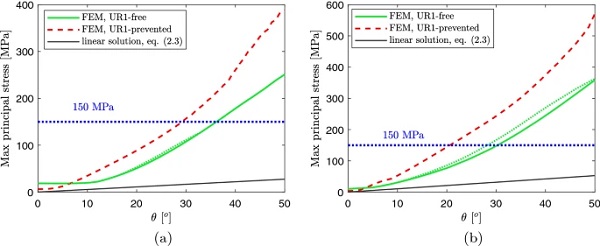
Figure 10a shows the numerically evaluated relationship between θ and the recorded maximum value of the maximum principal stress, for the plate 1.1 mm thick and for the two considered coupling conditions. Figure 10b is its counterpart for h=2.1 mm. In both cases, due to the influence of the self weight, the maximum principal stress is not zero for θ=0. In the same graphs, the results obtained with the linear model (2.3) are plotted for the sake of comparison.
It is evident that, in both cases, the maximum principal stress is strongly affected by the constrain condition, being higher in the UR1-prevented case. This is strongly related to the different deformed shape of the plate in the two cases, as shown in Fig. 5. As expected, the linear solution furnishes values of stress consistently lower than the numerically evaluated ones. This confirm, once again, that linear theory cannot predict the torsional response of thin panels. To evaluate the different stress distribution, reference is made to Appendix A, recording the three dimensional plots of the maximum principal stress, for h=1.1 mm (Tables 4 and 5) and h=2.1 mm (Tables 6 and 7).
When the rotation about the roller axis is free, the plate tends to deform into a cylindrical surface, with generators parallel to one of the diagonals, and the maximum principal stress is recorded in proximity of the plate corner, for both the considered thicknesses. For low values of θ (approximatively for θ<18∘ for h=1.1 mm thick, and θ<12∘ for h=2.1 mm), the maximum principal stress is recorded on the free plate edge, while for higher values of θ it is attained on the shorter edge. This is plotted with dashed line in Fig. 10. Since these could be fictitious stress intensification, due to the simplified modelling of the steel rollers, also the maximum stress recorded far from the constrained edges is plotted in the same graphs, represented with continuous lines.
On the other hand, when the rotation is prevented, there are two regions, in proximity of the short edges, with limited deflection and stress, while the remaining (central) region tends to deflect into a cylindrical surface, with generators parallel to one of its diagonals. The maximum principal stress is recorded, for all the considered values of θ, near the corner of such a region.
In graphs of Fig. 10, the value of 150 MPa, usually considered as the thin glass strength (Neugebauer 2015), is also plotted. If the glass strength was 150 MPa, the twisted 1.1 mm thick plate would expected to brake for twisting angles of about 36∘ if rotation is free, and 29∘ if rotation is prevented. These values correspond to torque of the order of about 30 Nm and 24 Nm, respectively. Analogously, the 2.1 mm thick plate would brake for θ≃28∘ and Mt≃90 Nm if rotation is free, and θ≃20.5∘ and Mt less than 94 Nm if rotation is prevented. The actual response of the twisted plate is expected to be intermediate between these two limits.
Experimental investigation
In order to experimentally analyse the torsional behaviour of the aforementioned thin glass elements, a dedicated equipment was designed and realised at laboratories of University of Parma (Italy).
Specimens geometry
The tested samples are made of chemically tempered Falcon glass, produced by ACG Europe, a new type of thin aluminum silicate glass suitable for chemical tempering and produced with a float process of the highest quality and efficiency. As discussed in the previous section, all the samples are 1000 mm long and 500 mm wide, while two different values of thickness (1.1 mm and 2.1 mm) have been considered.
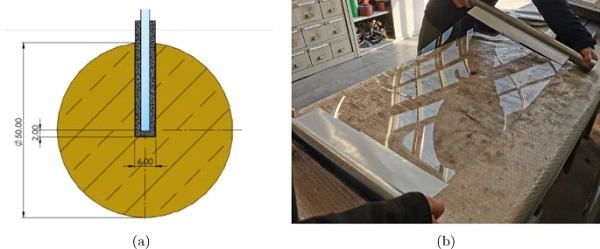
The short edges of the glass specimens are inserted in cylindrical steel rollers 600 mm wide, with 50 mm of radius, quite similar to those used in Oliveira Santos et al. (2018). The rollers contain a 510 mm long, 27 mm deep and 6 mm wide slit, as shown in Fig. 11a, allowing the glass pane to reach the centre of the cylindrical roller. A 1 mm or 2 mm thick7 EVA foil is introduced in the slit, to avoid direct contact between glass and metal and hence preventing stress concentrations.
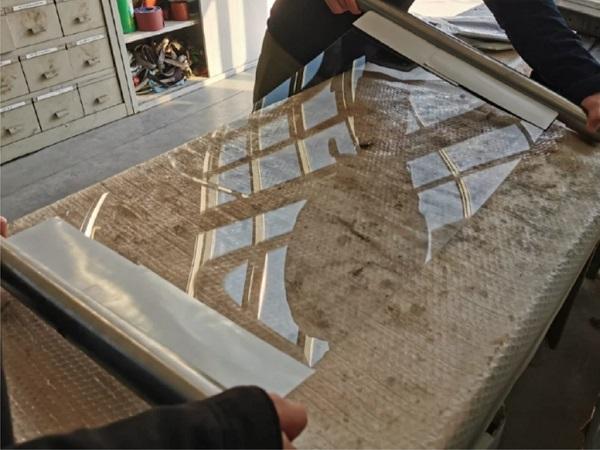
Figure 11b shows the 1.1 mm thick specimen, inserted in the steel rollers. This picture emphasize the extreme deformability of the thin glass element.
Experimental setup and instrumentation
The experimental setup has been designed by following the schematics shown in Fig. 2b. According to the results of the preliminar FEM analyses, the movable steel element should rotate of, at least, 36∘∘, while the maximum torque is expected to be of less than 100 Nm (see Sect. 2.2.2). The correspondent maximum out of plane displacement is of the order of 150 mm.
Furthermore, in order to apply pure torque moment to the thin glass sheet, in the equipment design phase the subsequent specifications were followed:
- realisation of hinges as ideal as possible, with low friction resistance and with the possibility to accommodate short-edge of thin glass samples;
- possibility to constantly monitor torque, rotational angle and displacements at some specific points;
- wide operating range, given the high distortion level that thin glass sheets may reach
- interchangeability of equipment parts, predisposing for different kind of tests.
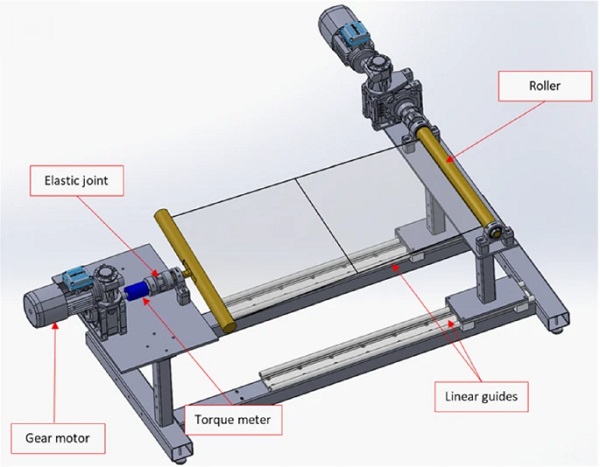
For the latter purpose, also the possibility for one support to slide along y direction was considered, being future large deflection bending tests scheduled. In this case, the test bench could be modified by placing the gear motor such as the movable roller rotates about its axis, so to apply equal-and-opposite moments at the short edges of the plate. This is constituted by a base frame made of tubular steel elements, from which two couples of pillars rise. One of the couples, on the left in Fig. 12, is directly welded to the base frame, whereas the other one is free to slide along the axial (y) direction, exploiting the linear guides on which pillars are mounted. Such linear guides consist of a couple of slider that can move with very low friction forces on a pair of binaries. Notice that the presence of the linear guides also allows to test specimens with different length.
The designed experimental setup for the torsional tests of thin glass is schematically shown in Fig. 12.
The support on the right in Fig. 12, free to slide in the axial direction, is composed by a metallic slab, on which a steel roller is held in position by two cylindrical bearings. Such a roller is a cylindrical solid shaft with a socket in which the glass specimens could be placed, by interposing EVA sheets to avoid concentration of stresses at contact areas, as shown in Fig. 11a. The roller is connected to a gear motor through a keyway connection and an elastic joint, to both compensate misalignments and transfer bending moments. Note that, during current tests such gear motor is held braked, avoiding undesired rotations of roller.
On the other support, on the left in Fig. 12, only one bearing held in position a second roller, allowing for a rotation about the y axis. Another elastic joint connect the roller with a torque meter, to continuously measure the torque moment applied to the thin glass sheet by a second gear motor, nominally identical to the one located on the movable support. The metallic slab of this fixed support is connected to the pillars by bolts, giving the possibility to rapidly change the set-up for any different possible test.
An angular position transducer is mounted on the shaft of the gear motor to measure the twisting angle. Since the main goal of the experimental campaign is to investigate the global response of the panel, in terms of relation among applied torque, twisting angle and and out-of-plane displacements, linear rod transducers have been used to measure the out-of-plane displacement in different points.
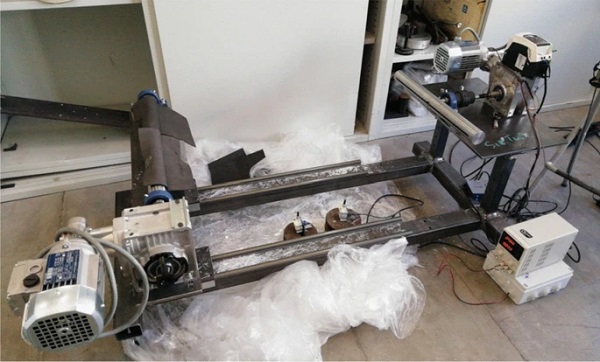
Figure 13 shows the test bench in the laboratory of University of Parma (Italy).
Results and comparisons
A total of 6 twisting tests has been performed on specimens 1.1 mm thick, and 5 on 2.1 mm thick glass panes. All the tests have been performed up to rupture8. During the experimental tests, the twisting angle have been measured with the angular position transducer mounted on the shaft of the gear motor, while the torque has been measured with a torque meter. For 5 tests performed on 1.1 mm thick, and 4 on 2.1 mm thick panes, a linear rod transducer has been used to measure the out-of-plane displacement of the center of the pane. For the remaining two tests (one performed on specimen with h=1.1 mm, and one on 2.1 mm thick sample), two transducers have been used to measure the out-of-plane displacement of points at the middle of the long plate sides, at 30 mm from the edge. These will be denoted in the sequel as points A and B.
In order to correctly compare the results in terms of out-of-plane displacement with those of numerical analyses, it is necessary to to consider that the value of displacement measured by the transducer does not perfectly correspond to the out-of-plane displacement. Indeed, the transducer elongation, hereafter denoted to as δ¯C, is affected by the in-plane displacement of the center point. As schematically shown in Fig. 14, the transducer is located at R=447 mm below the glass pane and, due to the in-plane displacement, it rotates of an angle φ, dependent on the in-plane displacement uP.
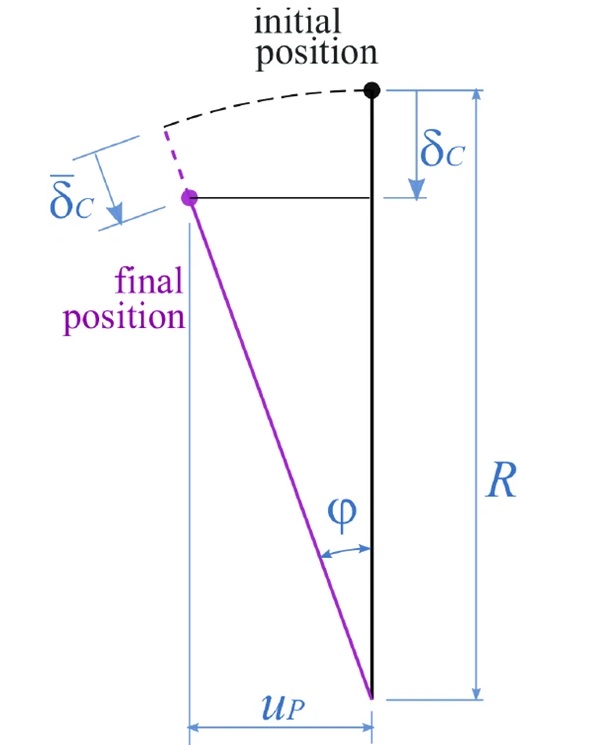
The transducer elongation δ¯C may be evaluated as9
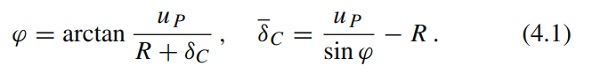
Obviously, the discrepancy between δC and δ¯C is relevant for high values of uP. To perform accurate comparisons between numerics and experimental results, the value δ¯C evaluated from the displacement field given by the numerical analyses will be compared to the value measured by the transducer(s).
Experimental results of twisting tests
Figure 15 show a twisting test performed on a glass specimen of thickness 2.1 mm, at θ≃30∘. The qualitative twisting response is also recorded in “Appendix B”, Table 8, showing a 1.1 mm thick glass sample at different stages of the twisting test.
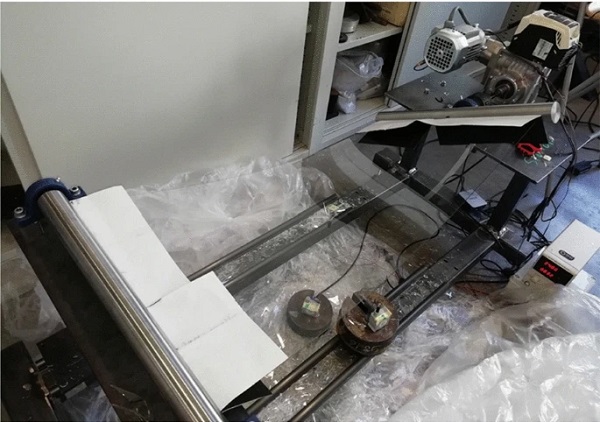
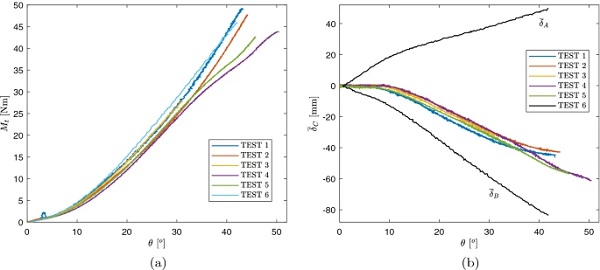
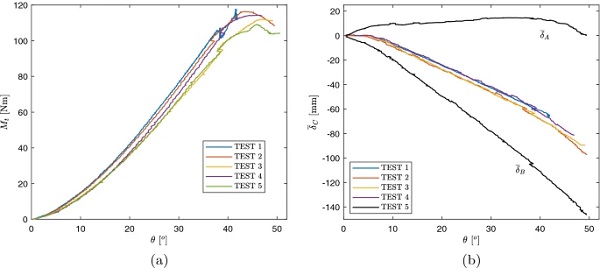
Figure 16a shows the result of the 6 tests performed on 1.1 mm thick specimens, in terms of relation between the prescribed twisting angle θ and the torque Mt. For all the considered samples, the fracture origins from the plate edges. Figure 16b shows the displacement δ¯C of the panel center, for tests from 1 to 5. In test 6, the displacement of points at the middle of the long plate sides, δ¯A and δ¯B, has been measured; the results are recorded in the same graph. It may be noticed that, in agreement with the findings of numerical analyses (see also the plots of out-of-plane displacements recorded in “Appendix A”), they have opposite sign.
The scattering of results, both in terms of torsional stiffness and of the relationship between δ¯C and θ, is quite limited. For what concerns the glass failure, only specimen 3 experienced early breakage, at θ=31∘ and Mt=28 Nm. For the other samples, the ultimate twisting moment varies from 42.6 Nm to 49.2 Nm, while the ultimate twisting angle is comprised between 41.8∘ and 50.5∘. Remarkably, these values are significantly higher than the expected values of about 30 Nm (see Sect. 2.2.2).
Figure 17 is the counterpart of Fig. 16a for the specimens with h=2.1 mm. Also in this case, ultimate twisting moments and angle are significantly higher than the expected values. Furthermore, it may be noticed that the twisting angle-torque graph exhibits a change of concavity at values of θ of about 38∘÷40∘, and a correspondent increase of (the absolute value of) the out-of-plane displacement, that was not detected for the specimens with h=1.1 mm. This is due to the reaching of the nominal twisting moment of the torsional joint connecting the gear motor and the movable steel roller, i.e. 95 Nm.
For higher values of torque, the joint stiffness strongly decreases, due to the viscoelastic deformation of the elastomeric spider, that is recovered at the end of each test. Hence, unfortunately the obtained results cannot be used to evaluate the strength of glass 2.1 mm thick. However, in the following section, results obtained for Mt≤95 Nm will be considered and compared with the numerical results, to evaluate the overall response of the twisted plate.
Comparison with numerical results
The experimental results are now compared with the FEM results. Both the cases of free and prevented rotation about the roller axis are here considered. As discussed in Sect. 4.1, for specimens 2.1 mm thick, only results obtained for Mt≤95 Nm are considered.
Comparison with results of preliminar FEM analyses
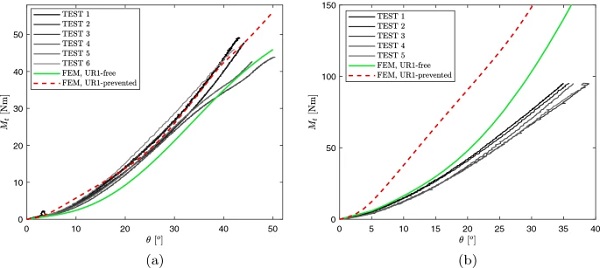
Figure 18 shows the comparison between the experimental twisting angle-moment graphs and the results of preliminar numerical analyses of Sect. 2.2, for panes with thickness 1.1 mm and 2.1 mm.
It is evident that the actual response of the 1.1 mm thick panes is intermediate between the two considered constrain conditions, i.e., the cases of free and prevented rotation about the roller axis, since the twisting angle-moment relation fits well within the numerical results. For the 2.1 mm thick panes, the experimentally recorded twisting moment is considerably lower than the numerical prediction, for both the considered constrain conditions (UR1-free and UR1-prevented).
Table 3 Torsional stiffness of the elastic joint - Full size table

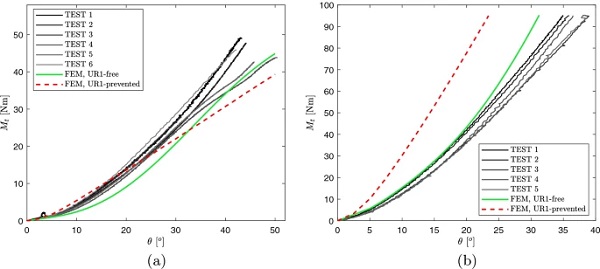
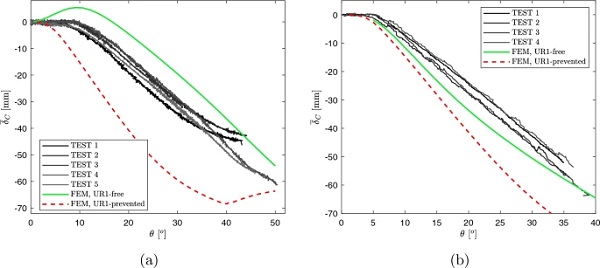
Figure 19 shows the comparison in terms of δ¯C, whose value has been calculated, from the results of FEM analyses, according to formula (4.1). Figure 19a refers to 1.1 mm thick panes, while Fig. 19b to the case h=2.1 mm. For h=1.1 mm, the response in term of center plate displacement is intermediate between the two limit responses, that present a quite high discrepancy, while in the case h=2.1 mm the numerical analyses tend to overestimate the (absolute) value of δ¯C.
Influence of the torsional stiffness of the joint
A possible explanation for the discrepancy between numerical and experimental results, in particular in terms of twisting angle-torque relation for samples 2.1 mm thick, is the presence in the experimental apparatus of the elastic joint connecting the gear motor and the movable steel roller (see Fig. 4b). According to the data sheet provided by the producer, its torsional stiffness varies with the twisting moment, as recorded in Table 3.
To account for its influence on the twisting response of thin glass specimens, more refined FEM analyses have been performed by modelling the joint as nonlinear connector, with uncoupled behavior, connecting the rotational degree of freedom (about the y′ axis) of the reference point RP2 (see Fig. 4b) with a new reference point, where the rotation about the y′ axis is prescribed. Figure 20 show the results of these FEM analyses accounting for the joint stiffness, in terms of twisting angle-torque relationship, compared with the experimental response. Unfortunately, no information is available about the joint stiffness at torque higher than 95 Nm, and hence the graphs have been limited to this value.
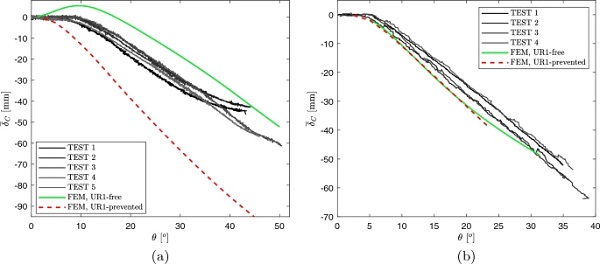
Figure 20 shows the results of FEM analyses accounting for the joint stiffness, in terms of twisting angle-torque relationship, compared with the experimental response. By comparing these graphs with those of Fig. 18, it is evident that the effect of the elastic joint is significantly more relevant for the case h=2.1 mm. This is because, when the plate stiffness is low with respect to that of the elastic joint, as in the case of h=1.1 mm, the joint deformation is almost negligible, and its influence on the twisting angle-torque relation is very low (indeed, graphs in Fig. 20a are quite similar to those of Fig. 18a). On the other hand, when the panel is stiffer the effect of the joint deformation is more relevant, and this leads to a decrease of the overall stiffness of the system.
The actual response of the 1.1 mm thick specimens is somehow intermediate between the two considered constrain conditions, closer to the “UR1-free”. On the other hand, the response of 2.1 mm thick specimen is better approximated by the UR1-free condition, at least for the considered range of values for the twisting angle.
This different qualitative response between the two kind of sample is due to the higher deformability of the thinner one. Indeed, as discussed before, the constrain condition of the short edges is somehow intermediate between a perfect clamp and a cylindrical hinge, because the rotation of the sample in the roller slit is limited by the slit size (27 mm depth and 6 mm width, see Fig. 11a) and by the presence of the EVA foil. Since the thinner panes exhibit higher out-of-plane displacements (both due to the self weight, and due to the twisting distortion), they are limited by the slit width.
According to the results of FEM analyses, in the case of free rotation about the roller axis, the deflection due to self weight of points at 25 mm from the short edge of the plate is of about 3.7 mm for the plate 1.1 mm thick, and of about 1 mm for the plate 2.1 mm thick. It is evident that the latter value is very small, and hence the plate can rotate in the slit (i.e., the rotation can be considered to be free), while the former, considerably higher, is prevented/reduced by the presence of the slit. In this case, the plate response is hence intermediate between the UR1-free and UR1-prevented cases.
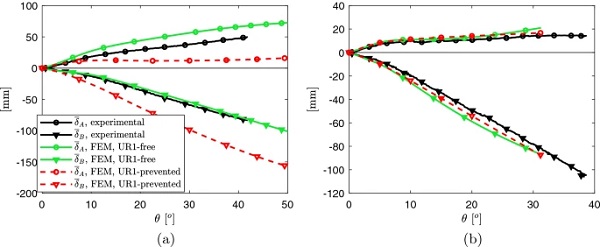
Figure 21 shows the comparison between numerical and experimental results, in terms of δ¯C.
The comparison of these graphs to those in Fig. 19 confirms that the influence of the elastic joint is quite limited in the case h=1.1 mm, while it significantly affects the plate out-of-plane displacements for h=2.1 mm. In the latter case, there is now a good agreement between FEM and experimental results, while in the former case the experimental curves are intermediate between the UR1-free and UR1-prevented cases, closer to UR1-free. The same holds for the out-of-plane displacement of lateral points A and B, plotted in Fig. 22 as a function of θ. To perform accurate comparisons, values of δ¯A and δ¯B have been calculated, from the results of FEM analyses, according to formulas analogue to (4.1).
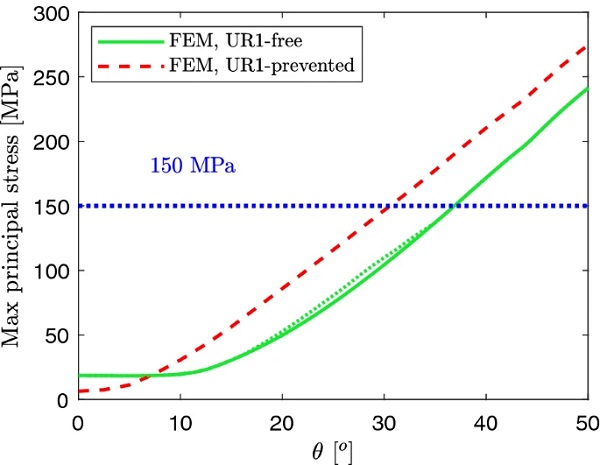
For glass 1.1 mm thick, the comparison between numerical and experimental results allows to estimate the thin glass strength. Reference is made to Fig. 23, showing the numerically evaluated maximum value of the maximum principal stress for the 1.1 mm thick specimens, as a function of the twisting angle. It may be observed that, since the sample breakage occurs for θ comprised approximatively between 42∘ and 50∘, the sample strength varies between 200 MPa and 255 MPa (intermediate value between UR1-free and UR1-prevented cases, for θ=42∘ and θ=50∘). Since these values are related to localized stress concentrations, they cannot be regarded as statistically significant values of the glass strength.
Conclusions
An innovative test procedure is proposed to evaluate the response of thin glass undergoing large displacement twisting. The considered element is a rectangular plate with two opposite edges inserted in steel rollers, with interposed EVA foil, that constrain edges themselves to remain straight, while allowing for a moderate rotation. This constrain condition is somehow intermediate between a perfect clamp and a cylindrical hinge. The plate is twisted by rotating one of the rollers about the longitudinal axis of the specimen, while keeping the other fixed.
It has been verified that the linear solution considerably underestimates the panel stiffness, and predicts ultimate twisting angles far above the linear range. Also the analytical description of the instability phenomena, not accounting for the edge stiffening, is far to be exhaustive. Hence, to evaluate the torsional response in a more precise manner, numerical simulations have been performed, whose output has been used in the design and dimensioning of the test equipment. Results of preliminar FEM analyses have highlighted the strong influence of the constrain conditions on the plate response, in particular of the possible rotation about the roller axis.
Based on the results of the numerical analyses, an experimental apparatus has been designed and constructed, allowing to test specimens with different size and thickness. Its particular design will allow to use the same test bench for large-deflection bending tests, by making some slightly modification in constraints and actuators. Experimental tests have been performed on six specimens 1.1 mm thick and five 2.1 mm thick, of length 1 m and width 0.5 m. Both the ultimate twisting angle and the ultimate twisting moment are significantly higher than the expected values.
Results have been compared with numerical prediction accounting for the stiffness of the elastic joint transmitting the torque, both in terms of twisting angle-torque relation, and of out-of-plane displacement of the pane center and of midpoints of free edges. The comparison have highlighted the strong influence of the coupling condition on the plate response. In particular, due to the different stiffness of the samples, the actual response of the 1.1 mm thick specimens is intermediate between the case of free and prevented rotation about the roller axis, while that of 2.1 mm thick specimen is better approximated by the cylindrical hinge condition. The obtained results also allows to estimate the strength of 1.1 mm thick glass, that turns out to be of the order of 200÷250 MPa, significantly higher than the characteristic value of 150 MPa usually assumed for thin glass.
The performed experimental campaign has highlighted that the proposed test bench should be improved to be used to assess the thin glass strength. In particular, to get more reliable results, the elastic joint stiffness should be increased, so to not affect the plate response. Future experimental campaign will include glass samples with different size, to investigate the size effect, and with different edge finishes. The influence of the stiffness of the material interposed between glass and steel roller will be deeply investigated by means of more accurate numerical analyses.
Table 4 Numerically evaluated evolution of the deformed shape and of the stress state, for 1.1 mm thick plate with free rotation about the roller axis - Full size table
Table 5 Numerically evaluated evolution of the deformed shape and of the stress state, for 1.1 mm thick plate with prevented rotation about the roller axis - Full size table
Table 6 Numerically evaluated evolution of the deformed shape and of the stress state, for 2.1 mm thick plate with free rotation about the roller axis - Full size table
Table 7 Numerically evaluated evolution of the deformed shape and of the stress state, for 2.1 mm thick plate with prevented rotation about the roller axis - Full size table
Table 8 Thin glass specimen, 1.1 mm thick, at different stages of the twisting test - Full size table
Notes
- The pictures shown in Fig. 1 have illustrative purposes only. Indeed, due to the high non-linearity of the problem, the double/single curvature of the deformed shape strongly depends upon the size and thickness of the panel, and on the distortion level.
- Since the glass strength is governed by opening and propagation of surface flaws (Ballarini et al. 2016), the natural criterion to be used in glass design is that of maximum principal stress (Rankine criterion), often used to predict the failure of brittle materials. In the considered case, the value of the maximum tensile stress corresponds to that of τmaxτmax.
- Other authors (Ganatra 2016) suggest to use, as thin glass strength, the value of 200 MPa.
- A convergence study has been performed to evaluate the mesh size, so to ensure that the results are not affected by a mesh refinement.
- To prevent this kind of displacements, it would be necessary to fix the sample in the slit, with an interference fit. However, it has been experimentally verified that this would lead to glass breakage during the mounting phase.
- Since the deflection due to self weight is small if compared with the panel size, as a first approximation the problem may be treated by means of superposition of effects.
- To avoid glass breakage while inserting the glass samples in the roller slit, 1 mm EVA foil has been used for 2.1 mm thick samples, and 2 mm EVA foil has been used for 1.1 mm thick ones.
- The test velocity has been chosen so to obtain a mean stress rate of 2 MPa/s, according to EN ISO 1288 (2016) specification.
- Notice that δC and δ¯C are, in general, negative.
References
- ABAQUS. Analysis users manual, version 6.10. Simulia (2010)
- Ballarini, R., Pisano, G., Royer-Carfagni, G.: The lower bound for glass strength and its interpretation with generalized Weibull statistics for structural applications. J. Eng. Mech. ASCE 142(12), 04016100 (2016) Article Google Scholar
- Bedon, C., Honfi, D., Kozłowski, M., Vokáč Machalická, K., Santos, F., Wüest, T., Eliášová, M., Vokáč, M.: Key structural aspects for adaptive facades—activity progress from the EU-COST action TU1403 structural TaskGroup. Int. J. Struct. Glass Adv. Mater. Res. 2, 135–154 (2018) Google Scholar
- Biolzi, L., Cattaneo, S., Rosati, G.: Progressive damage and fracture of laminated glass beams. Constr. Build. Mater. 24(4), 577–584 (2010) Article Google Scholar
- Biolzi, L., Orlando, M., Piscitelli, L.R., Spinelli, P.: Static and dynamic response of progressively damaged ionoplast laminated glass beams. Compos. Struct. 157, 337–347 (2016) Article Google Scholar
- Castori, G., Speranzini, E.: Fracture strength prediction of float glass: the coaxial double ring test method. Constr. Build. Mater. 225, 1064–1076 (2019) Article Google Scholar
- D’Ambrosio, G., Galuppi, L.: Structural use of thin glass. Design of a transformable curved greenhouse. In: GPD Conference Proceedings, Tampere (FI), pp. 437–441 (2019)
- Datsiou, K., Overend, M.: The mechanical response of cold bent monolithic glass plates during the bending process. Eng. Struct. 117, 575–590 (2016) Article Google Scholar
- EN ISO 1288:2016—Glass in building—determination of the bending strength of glass. Standard (2016)
- Galuppi, L.: Transformable curved thin glass greenhouse. Int. J. Struct. Glass Adv. Mater. Res. 2, 198–217 (2018) Google Scholar
- Galuppi, L., Royer-Carfagni, G.: On the occurrence of lumped forces at corners in classical plate theories: a physically based interpretation. J. Mech. Mater. Struct. 10(1), 93–103 (2015) MathSciNet Article Google Scholar
- Galuppi, L., Royer-Carfagni, G.: On the occurrence of lumped forces at corners in classical plate theories: a physically based interpretation. J. Mech. Mater. Struct. 10(1), 93–103 (2015) MathSciNet Article Google Scholar
- Galuppi, L., Massimiani, S., Royer-Carfagni, G.: Buckling phenomena in double curved cold-bent glass. Int. J. Non-Linear Mech. 64, 70–84 (2014) Article Google Scholar
- Galuppi, L., Di Biase, P., Schaaf, B., Richter, C., Hoffmeister, B., Feldmann, M., Royer-Carfagni, G.: Hybrid steel-glass cell: cold-twisting and buckling phenomena. In: Challenging Glass 6 Conference Proceedings, pp. 217–228 (2018)
- Ganatra, P.: Bamboo and thin glass: structural analysis of bending bamboo and thin glass. Master’s thesis, Delft University of Technology, Delft (NL) (2016)
- Hoffmeister, B., Di Biase, P., Richter, C., Feldmann, M.: Innovative steel-glass components for high-performance building skins: testing of full-scale prototypes. Glass Struct. Eng. 2(1), 57–78 (2017) Article Google Scholar
- Mansfield, E.H.: The inextensional theory for thin flat plates. Q. J. Mech. Appl. Math. 8(3), 338–352 (1955) MathSciNet Article Google Scholar
- Mansfield, E.H., Kleeman, P.W.: A large-deflexion theory for thin plates: a theory based on the assumption of an inextensional middle surface of the plate. Aircraft Eng. Aerosp. Technol. (1955)
- Nehring, G., Siebert, G.: Design concept for cold bent shell structures made of thin glass. ce/papers 2(5–6), 43–56 (2018) Article Google Scholar
- Neugebauer, J.: A movable canopy. In: Proceedings of the International Conference on Building Envelope Design and Technology. Advanced Building Skins, p. 324 (2015)
- Neugebauer, J.: Determination of bending tensile strength of thin glass. In: Challenging Glass 5 Conference Proceedings, pp. 419–428 (2016)
- Neugebauer, J., Wallner-Novak, M.: Let thin glass in the façades move—thin glass-new possibilities for glass in the façade. In: Facade Tectonics 2018 World Congress (2018)
- Neugebauer, J., Wallner-Novak, M., Lehner, T., Wrulich, C., Baumgartner, M.: Movable thin glass elements in façades. In: Challenging Glass 6 Conference Proceedings, pp. 195–202 (2018)
- Oliveira Santos, F, Louter, C., Correia, J.R.: Exploring thin glass strength test methodologies. In: Challenging Glass 6 Conference Proceedings, pp. 713–724 (2018)
- Pisano, G., Royer Carfagni, G.: Towards a new standardized configuration for the coaxial double test for float glass. Eng. Struct. 119, 149–163 (2016) Article Google Scholar
- Quaglini, V., Cattaneo, S., Pettorruso, C., Biolzi, L.: Cold bending of vertical glass plates: wind loads and geometrical instabilities. Eng. Struct. 220, 110983 (2020) Article Google Scholar
- Siebert, G.: Thin glass elements—a challenge for new applications. In: GPD Conference Proceedings, Tampere (FI), pp. 316–319 (2013)
- Silveira, R.R.: Flexible transparency: a study on thin glass adaptive façade panels. Master’s thesis, Delft University of Technology, Delft (NL) (2016)
- Silveira, R.R., Louter, C., Klein, T.: Flexible transparency—a study on adaptive thin glass Façade panels. In: Challenging Glass 6 Conference Proceedings, pp. 135–148 (2018)
- Spagnoli, A., Brighenti, R., Biancospino, M., Rossi, M., Roncella, R.: Geometrically non-linear bending of plates: implications in curved building façades. Constr. Build. Mater. 214, 698–708 (2019) Article Google Scholar
- Speranzini, E., Agnetti, S.: Strengthening of glass beams with steel reinforced polymer (SRP). Compos. Part B Eng. 67, 280–289 (2014) Article Google Scholar
- Staaks, D.: Koud torderen van glaspanelen in blobs (Cold Bent Glass Sheets in blobs). in German. Master’s thesis, University of Technology Eindhoven, Eindhoven (NL) (2003)
- Timoshenko, S.P., Woinowsky-Krieger, S.: Theory of Plates and Shells. McGraw-Hill, New York (1959) MATH Google Scholar
- Topçu, Ö.: Kinetic thin glass façade. Master’s thesis, Delft University of Technology, Delft (NL) (2017)
Acknowledgements
This research has financially been supported by the Programme “FIL-Quota Incentivante” of University of Parma and co-sponsored by Fondazione Cariparma. The author also acknowledge Giovani Fortese, for the precious support in the experimental campaign.
Author information
Affiliations
Department of Engineering and Architecture, University of Parma, Parco Area delle Scienze 181/A, 43124, Parma, Italy
Laura Galuppi & Enrica Riva
Contributions
This research paper results from a joint collaboration of the involved Authors.
Corresponding author
Correspondence to Laura Galuppi.
Ethics declarations
Conflict of interest
On behalf of all authors, the corresponding author states that there is no conflict of interest.
Additional information
Publisher's Note
Springer Nature remains neutral with regard to jurisdictional claims in published maps and institutional affiliations.
Appendices
Numerically evaluated evolution of the deformed shape and of the stress state
Here, the results of the numerical analyses, in terms of both the out-of-plane displacement and of the maximum principal stress distribution, are recorded for different steps of the torsion test.
Results plotted on the plate deformed shape (with scale factor=1) are shown in Tables 4 and 5 for the cases of 1.1 mm thick plate, with free and prevented rotation about the roller axis, respectively. Analogously, Tables 6 and 7 records the results obtained for the plate 2.1 mm thick.
Qualitative torsional response of 1.1 mm thick glass
Pictures in Table 8 shows a 1.1 mm thick glass sample subjected to large deflection twisting, at different stages of the test.