Authors: Alessandra Cantini, Leonardo Leoni, Saverio Ferraro, Filippo De Carlo, Chiara Martini, Fabrizio Martini and Marcello Salvio
Source: Processes 2022, 10(12), 2653
DOI: https://doi.org/10.3390/pr10122653
(This article belongs to the Special Issue Technologies for Climate-Neutral Energy Systems)
Abstract
The glass industry is highly energy-intensive, consuming approximately 500–700 million GJ each year. Replacing inefficient equipment with better-performing equipment is a good strategy to reduce the energy consumption of a glass plant. Since there are many alternative solutions, the choice of which technological improvement to implement is usually difficult. Therefore, a review of solutions to reduce energy consumption in a glass plant is pivotal. The literature offers similar studies, but they are not sufficiently up-to-date and do not represent the actual state of the art, which should be updated. Thus, this paper aims to provide an updated list of alternative solutions, clustering them into different categories (e.g., the process stage).
Moreover, this paper investigates the current applicability of energy-saving solutions in Italy. Specifically, a sample of 103 Italian companies is considered and the type of interventions that the companies recently implemented or that they intend to adopt is analyzed. Quantitative statistical and economic analyses were conducted to highlight the most popular solutions and determine their cost-effectiveness. The results show that most interventions consist of replacing machinery with more efficient ones, mainly in auxiliary systems (132 out of 426). The outcome of this paper could represent a guide to select energy-saving solutions.
1. Introduction
The production process in glass manufacturing plants is typically energy-intensive and requires large amounts of resources. It was estimated that the glass manufacturing process consumes around 5÷÷7 GJ per ton of glass produced [1], and the world’s glass production is about 100 million tons/year [2]. Worldwide, glass products are produced by 1141 companies and groups in 91 countries, with a daily total capacity of more than 500 tons/day (https://plants.glassglobal.com/login/ (accessed on 27 May 2021)) [3]. In Italy, glass production amounts to approximately 6 million tons/year, with approximately 2.7 Mt of CO2 produced and a consumption of 970 million Sm3/year of natural gas (approximately 1% of the national consumption of natural gas) [4].
Given the significant impact that the manufacturing industry has on global ecological sustainability and considering the increasing economic pressure introduced by a competitive market and the reduction of available energy resources, it has become a primary concern to optimize the energy efficiency of production systems [5,6]. From this perspective, to reduce energy consumption in the glass sector, it is possible to act both on a technological and a managerial level. Focusing on the technological aspects, one of the strategies to be pursued is to improve production plants by modifying or replacing inefficient equipment with better-performing and less energy-intensive ones [7]. Interventions may consider both the assets composing the production process for glass production as well as auxiliary systems (e.g., engines, compressors). Other sectors propose analyses of technological interventions for the energy efficiency of manufacturing processes, such as the cement industry [8] and the foundries industry [9].
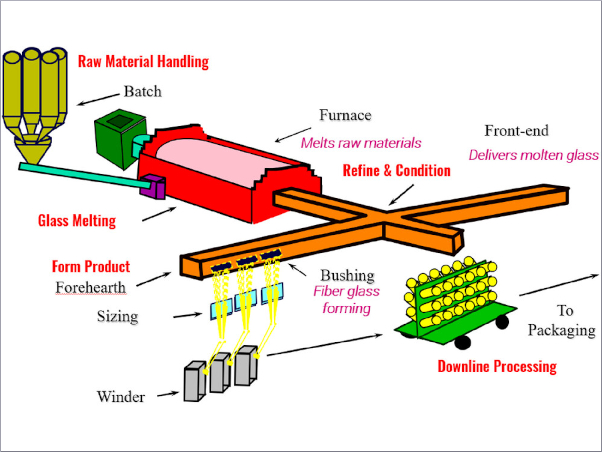
The glass-production process can be broken down into four macro-phases, such as (i) fusion preparation, (ii) fusion and refining, (iii) conditioning and molding, and (iv) finishing (see Figure 1).
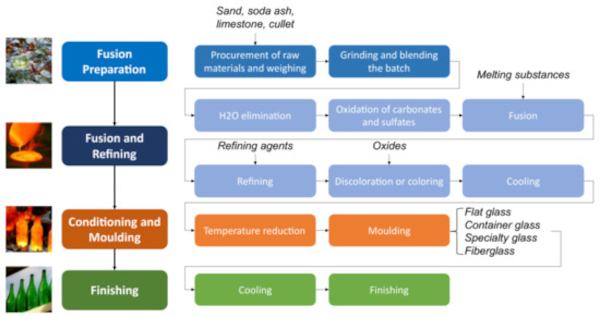
According to Figure 1, the production process starts with fusion preparation, which begins after supplying raw materials. The main raw material used to produce glass is sand (70–72%), mainly in silica form, which acts as a vitrifying agent in the chemical process. Various components are added to the sand, including a melting agent (soda ash, 14%), a stabilizer (limestone, 10%), oxides to determine the chemical–physical characteristics, and often glass scraps (cullet). Having procured raw materials, during fusion preparation, they are weighed, milled, and mixed in the right quantity to obtain the properties required by the final product. This is followed by the fusion and refining phase, in which the materials are gradually heated up to about 1500 degrees Celsius. Initially, part of the water is removed, and an oxidation phase is carried out to allow the dissociation of carbonates and sulfates. The mixture is then heated in a furnace until the glass mass melts, facilitated by the addition of melting substances.
This compound is then treated through refining and decoloring/coloring processes according to market requirements. The refining process eliminates the presence of any gas bubbles by means of refining agents, while decolorization is performed with the aid of oxides. The melting phase is the most energy-intensive one, and this is mainly attributable to the melting furnace that heats the glass by combustion, electrode contact, or mixed methods [10]. Next, during the conditioning and molding phase, the glass-production process is distinguished according to the final product to be achieved, which can be classified into four different types: flat glass, container glass, specialty glass, and fiberglass [11]. Flat glass is typically used in the construction and automotive sectors (e.g., sheets and float glass for residential and commercial construction, automotive applications, countertops, and mirrors).
Container glass can, in turn, be classified as hollow glass and white quality glass for the food and beverage sectors, and the perfumery and pharmaceutical sectors, respectively. Special glass products belong to the household sector (e.g., pressed and blown glass for tableware, cookware, lighting, televisions, liquid crystal displays, laboratory equipment, and optical communications). Finally, glass fibers, can be classified as glass wool for insulation or textile/reinforcement fibers. At this stage, the process assets change depending on the product. In general, the melted, refined, and cooled glass mass, after having rested, leaves the furnace through channels, entering flowing systems called “forehearths” that transport the molten glass to the forming machines. After passing through the channels and completing the conditioning, the glass enters the forming machines, where it takes its final shape [11]. Finally, the finishing phase determines the surface characteristics required for the final product.
To enhance greater energy efficiency in the glass manufacturing plant, for each operation of the production process, a wide variety of technological solutions were developed. The Best Available Techniques Reference Documents (BREFs) connected to glass manufacturing are the reference document to be used in the glass sector to achieve improved energy efficiency [12]. The European Union created the BREFs as publications that serve as guidelines for enhancing energy efficiency. In addition to BREFs, other solutions can be found in the literature for energy efficiency applicable to technological assets. For example, in the fusion preparation phase, solutions concern scales for the computerized weighing of components [12], raw-material-conveying systems for preheating batch and cullet [11,12,13], and grinding mills for improving energy efficiency [14] and for simultaneously grinding and mixing [15].
In the fusion and refining phase, the energy-saving solutions mostly concern melting furnaces, burners, and electrodes. The work of Bauer et al. [16] suggests the installation of thermovoltaic systems on the walls of machinery to recover dissipated heat. In the conditioning and molding phase, the solutions concern molding machines and blast furnaces, with some solutions dealing with their replacement by oxy-fuel or electrically heated models [11]. Finally, for the finishing phase, solutions concern machinery, such as furnaces to reduce losses or the installation of more efficient types [11]. Widely proposed solutions concern the improvement of machinery through revamping, especially for technological assets that are very energy-intensive or with high losses of energy, such as melting furnaces, burners, and blast furnaces [11].
However, the multitude of alternatives offered on the market hamper the choice of which technological improvement intervention to adopt. The result is that companies interested in an ecological transition are bewildered and unable to choose the best production technology in which to invest. For these reasons, in the scientific literature, efforts have already been made to develop a review of the main technologies for overcoming energy problems and minimizing energy consumption [12,17,18]. However, this literature is not sufficiently up-to-date and does not consider the technological developments achieved over the last decade. Moreover, although the proposed solutions are divided according to the process phase to which they refer (fusion preparation, fusion and refining, conditioning and molding, and finishing), there is no synthetic classification that summarizes the available alternatives, also dividing them according to the specific asset on which they act. Finally, real evidence of the current applicability of such solutions in real business contexts is missing.
To fill this gap, the present work pursues two objectives. The first objective is to provide an updated list of technological energy-saving opportunities for glass-production plants, dividing them according to both the process phases and the asset involved. The second objective is to map the current Italian situation and future perspectives. To this end, a sample of companies was analyzed, drawing statistical considerations on recently implemented energy-saving actions and solutions on technological assets proposed for the next few years. The information needed for the current study was taken from the energy assessments (EAs) of 103 different glass-manufacturing facilities in Italy, which were completed by glass-industry businesses to comply with Article 8 of Legislative Decree 102/2014, the Italian implementation of the Energy Efficiency Directive (EED) 2012/27/EU.
All of the information provided in the present paper could be useful for companies in the glass sector who are looking for a guide to improve their energy consumption and sustainability. Focusing on the technological opportunities, this article refers only to solutions concerning glass-production equipment. The discussion excludes solutions concerning the lighting or heating of the industrial shed where the plant is located [19]; solutions concerning quality control, maintenance, and product packaging activities (which are downstream of the production process) [12,20]; and solutions concerning the installation of sensors that, despite being technologies, are typically used together with software and computer systems to implement management solutions (process control and optimization) [21]. On the contrary, solutions related to auxiliary systems have been taken into account, being non-negligible for the energy efficiency of the glass manufacturing process.
The remainder of the present paper is as follows: Section 2 outlines the approach followed to reach the goals. In Section 3, by applying the proposed methodology, an updated list of available technologies is offered, and an analysis of the Italian scenario is shown. Section 4 provides a discussion of the results. Finally, Section 5 reports conclusions.
2. Materials and Methods
The European Parliament and Council issued the Energy Efficiency Directive (EED) in October 2012 with the objective of achieving a 20% reduction in energy use before 2020 [22]. To guarantee that the European objectives are met and to pave the way for additional energy efficiency (EE) advancements after 2020, the EED develops a shared framework of measures for the promotion of EE. Article 8 of the established framework requires the impacted firms to create energy audits (EAs). An EA is a systematic document that is necessary to analyze potential future investments in energy-saving technologies [8]; the collection is mandatory and required every four years from large and/or energy-intensive organizations. Specifically, every EA includes precise details on the location of the facility, some broad corporate characteristics, the kind of manufacturing process, and the kind of completed products.
The Italian Government implemented the EED in 2014 (by passing Legislative Decree No. 102/2014, which was most recently updated by Legislative Decree No. 73/2020), expanding the obligation to include a particular class of energy-intensive enterprises. In Italy, the EA requirement applies to both large enterprises and energy-intensive enterprises, which are the ones that use more than 1 GWh of electricity and receive tax breaks on their electricity bills. These enterprises are included in the Environmental Energy Services Fund (CSEA) databases. In Italy, the management and implementation of the EED framework areas are entrusted to the Italian National Agency for New Technologies, Energy and the Sustainable Economic Development (ENEA) in charge of gathering the EAs. To this aim, the Audit102 web portal is used (https://audit102.enea.it/ (accessed on 26 October 2022)), and databases both on consumption and interventions at the site level are made available to ENEA.
For the aim of this work, the most pertinent data are those related to the interventions that the Italian firms carried out between 2015 and 2019 and those that they identified in the EAs to be considered for implementation between 2019 and 2022. These data were analyzed both to update the list of energy-saving solutions with new solutions from EAs and to confirm those already available in the literature. By gathering information on implemented and planned production technologies, it will be possible to indicate how the glass sector will develop in the coming years.
A three-step methodology was followed to provide an updated list of energy-saving technological opportunities in 103 glass-manufacturing plants and to determine which interventions are currently most considered in Italy. The acquired data was entered into a spreadsheet database and utilized to increase the number of technical solutions (see Table A1, Table A2, Table A3, Table A4 and Table A5 in Appendix A, italic fonts).
2.1. Research of Energy-Saving Technological Opportunities
The scientific literature was consulted to search for technological opportunities to reduce energy consumption in a glass-production plant. By exploring the online databases Google Scholar and Scopus and entering keywords, such as “energy opportunities in glass manufacturing”, “glass technologies”, and “saving energy in glass plant”, 40 articles of interest were identified. The results of this study were used to create a list of energy-saving technological solutions, associating each alternative in the list with the bibliographic source consulted to identify it (Table A1, Table A2, Table A3, Table A4 and Table A5 in Appendix A). The technological solutions found were subdivided according to the process phase and the machinery on which they acted.
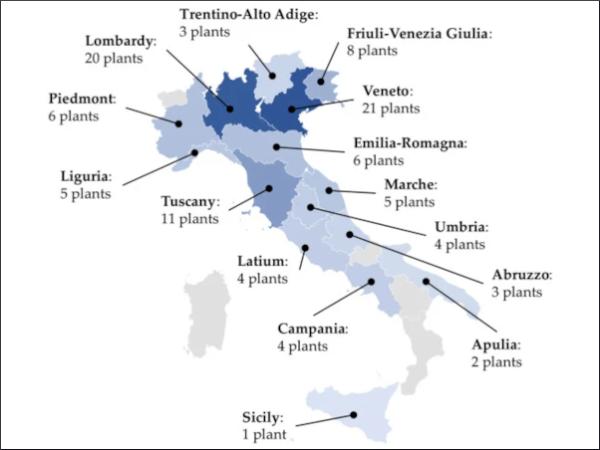
To validate the content in Table A1, Table A2, Table A3, Table A4 and Table A5, a sample of 103 Italian companies was analyzed. These companies were located in Italy as shown in Figure 2, being characterized by the production processes outlined in Figure 1. Companies were given a structured questionnaire in which they were asked to answer two open-ended questions. First, what energy-saving technology solutions they implemented in the last 4 years. Secondly, what solutions they intended to implement in the next few years. The outcome of the questionnaire was useful to expand the list of technological solutions, adding to the literature opportunities the ones created by consulting experienced industrialists.
The list of technological solutions divided by process phase, production machine, and final product type provides companies with a synthetic tool to improve their sustainability. In fact, a generic company willing to reduce energy consumption in a specific area/machine of the plant can consult the present paper to quickly identify the available alternatives.
2.2. Overview of the Current Italian Situation
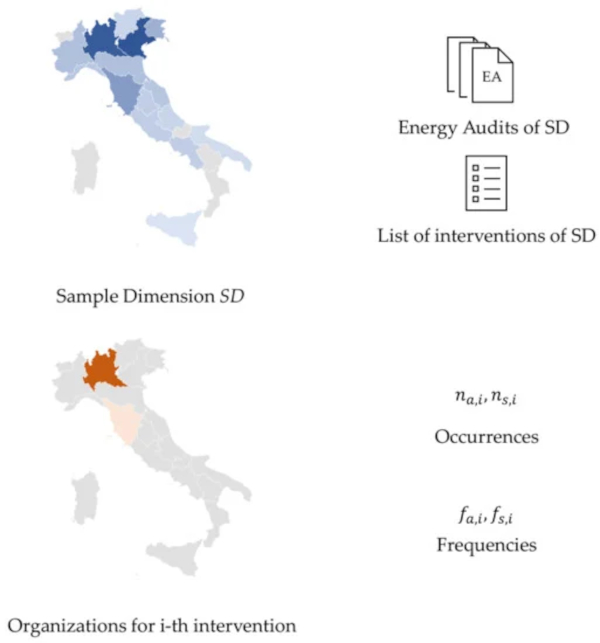
The results of the questionnaires were analyzed to see which of the technological solutions were implemented in Italy in the last 4 years and which were proposed as future actions. By calculating the frequency of the selection of each solution, statistical information was collected. In particular, the application degree of different technological solutions in the Italian context was estimated, defining the number and type of interventions carried out in recent years. On the other hand, an idea of the future development perspectives of technologies in Italy is achieved by considering the number and type of interventions proposed. The following information was analyzed for each EA in the glass sector:
- the number of organizations that applied the i-th intervention in the reporting period (na,i)
- the frequency of the application of intervention i in the reference period (fa,i)
- the number of organizations that proposed solution i as a future action (ns,i)
- the frequency of proposals for application i in the future period (fs,i)
As stated in Equations (1) and (2), the calculation of the frequencies fa,i and fs,i is obtained from the ratio between the number of observations and the total number of observations. In this case, the total number of observations is equal to the sample dimension (SD, which is 103 companies). Figure 2 shows a schematic representation.
It is important to remember that, within the glass-production process, some solutions may have limited applicability. In fact, even if the macro-phases of the process are the same for each type of product (see Figure 1), due to the variability and end-use sector, the technological assets are different. For example, flat glass products perform continuous forming operations by rolling or drawing. Container glass products, on the other hand, require pressing, blowing, or molding in special molds. In addition, there may be products for which only secondary processing is required, and not all organizations perform the complete production cycle. To produce a more realistic representation of the trends related to the adopted technologies in glass sites, statistical data on the frequency of applied and proposed interventions were calculated from Equations (3) and (4):
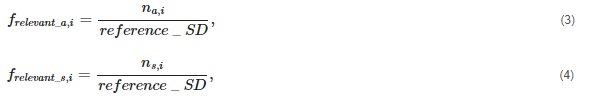
where reference_SD indicates the secondary sample of sites considering such interventions. The new frequency values can provide an estimate of the current and future status of the most relevant technologies in the Italian glass industry.
2.3. Quantitative Economic Analysis of the Gathered Eneregy Saving Interventions
EAs collected in the Audit102 database generally included quantitative data related to implemented and identified interventions. A standardized approach has been developed to analyze information on energy-saving solutions, assigning the intervention area computing total savings in tons of oil equivalent (toe), and calculating indicators and statistics of the glass sector. Initially interventions in the Audit102 database were assigned to more than 300 areas, while they are currently allocated to 17 intervention areas. Then, results are described, classifying them into intervention category, which can be technical (e.g., ‘pressure systems’ and ‘Thermal power plant and heat recovery systems’) or managerial, such as the introduction or improvement of a monitoring system and the adoption of ISO 50001 certification or training courses.
Figures concerning different types of energy-savings are provided, namely savings of electricity, thermal energy, transport fuels (when relevant), and other savings. Other savings refers to a mix of electric and thermal savings for which the disaggregation in the two components was not available in the energy audit, or to savings of other energy vectors. These figures refer to the achieved savings for implemented interventions but potential savings for the suggested (future) ones. As for identified interventions, potential savings represent a maximum threshold, since not all interventions will be selected for implementation, and their introduction would be deferred in time. For this reason, in the following analysis, these interventions could also be referred to as ’suggested interventions‘.
CAPEX is also covered by the database, and in the case of implemented interventions, further economic indicators are provided, such as simple payback time, calculated without incentives. Based on the database information, global energy-savings, measured in toe, can be computed and sorted either as final or as primary energy-savings, the latter referring to the technical intervention areas “cogeneration and trigeneration” and “production from renewable energy sources”.
Using information on CAPEX and energy-savings, a cost-effectiveness indicator of energy saved was calculated for each intervention, measured as euros invested per toe. The indicator is estimated for both implemented and identified EPIAs, as illustrated by Equation (5):

The NACE code for the company and for every site can be used to develop sector-specific analyses. These data were collected and analyzed to determine the reasons that led the companies to adopt a specific energy-saving solution rather than others. Compared to Section 2.2, this phase allows analyzing the adopted interventions from an economic point of view, considering both the investment cost and the expected energy-savings associated with each considered intervention.
3. Results
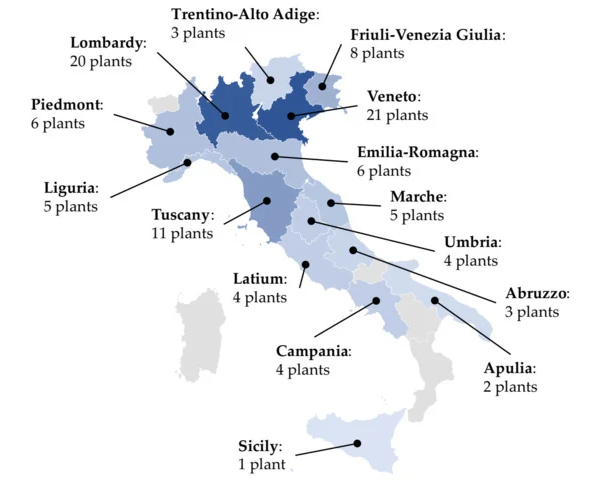
In Italy, 103 sites for glass production have been identified and asked to provide an EA. The highest density of sites is in the Veneto region with 21 occurrences, followed by the Lombardy region with 20 occurrences (Figure 3). In the constituent sample of 103 sites, the northern Italian regions (Liguria, Piedmont, Lombardy, Trentino-Alto Adige, Veneto, Friuli-Venezia Giulia, Emilia-Romagna) have a higher density of sites with a total of 69 glass-production facilities. The regions of central Italy (Tuscany, Marche, Umbria, Lazio) have 24 production sites, while the remaining 10 sites are located in southern Italy (Abruzzo, Campania, Apulia, Sicily).
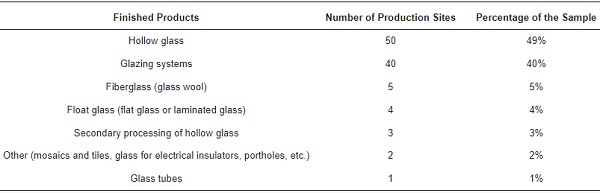
From the 103 EAs, it emerged that all companies carry out raw material preparation and finishing activities. A total of 53 companies perform the entire production cycle (all phases of Figure 1). The production cycle provides six types of finished products, as shown in Table 1. Most of the sites in the analysis sample produce hollow glass (49%), in particular for pharmaceutical, food, and household use, followed by the production of glazing systems (40%). The other product types are glass fiber (5%); float glass (4%); the secondary processing of hollow glass (3%); and other products such as mosaics, tiles, glass for electrical insulators, portholes (2%), and glass tubes (1%), respectively.
Table 1. Type of finished products produced by 103 Italian glass-production sites.
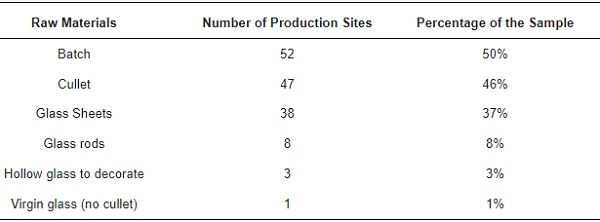
Finally, with regard to the type of raw material used (see Table 2) for the glass-production process, from the 103 EAs, 50% of the sites use batch, followed by the use of cullet and sheet glass, with respective percentages of 46% and 37%. Glass rods (8%), hollow glass for decoration (3%), and virgin glass crystal (1%) were found to have low utilization values.
Table 2. Type of raw material.
3.1. Energy-Savings Technologies from EAs
The technological interventions implemented and proposed by Italian glass-manufacturing organizations were obtained from the analysis of EAs, as explained in Section 2.1. Table 3 shows the list of implemented and proposed interventions (fourth column) sorted by production process (first column). For ease of understanding, column two shows the process machine associated with the solution and column three the objective of the solution. Finally, the remaining columns report quantitative information on the number of applications detected by the EAs and their frequency. The table has been compiled by contemplating the results of the interventions proposed in the scientific literature for the energy efficiency of the glass-production process. For this reason, the solutions also found in the literature in Table 3 (and not only in the EAs) are reported using italics.
Table 3. Results of Italian glass-production EAs.
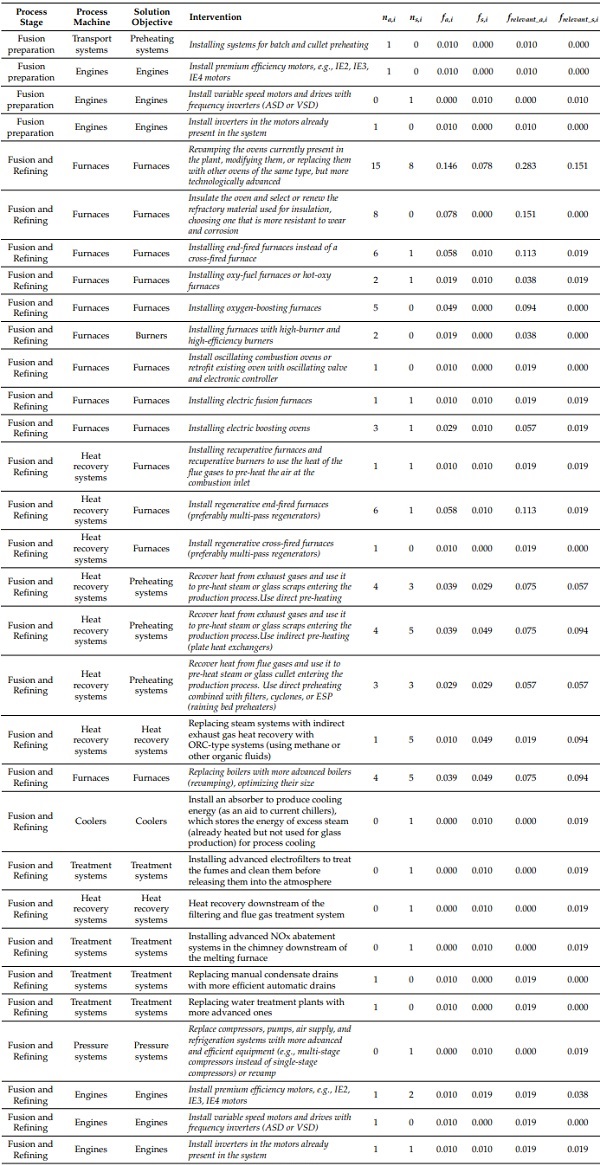
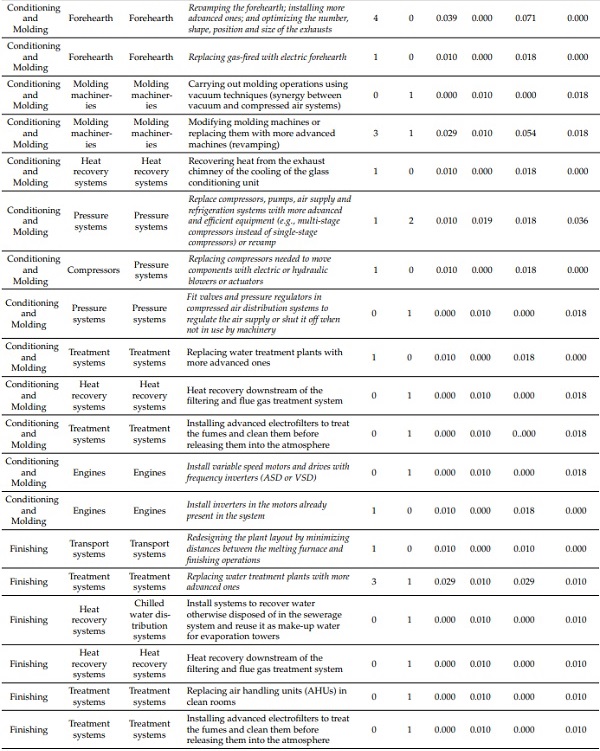
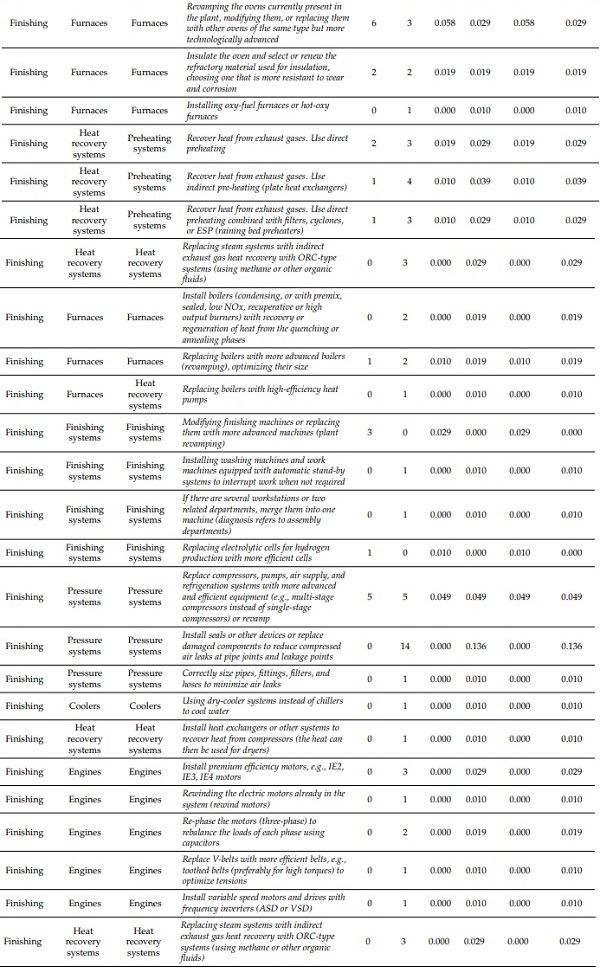
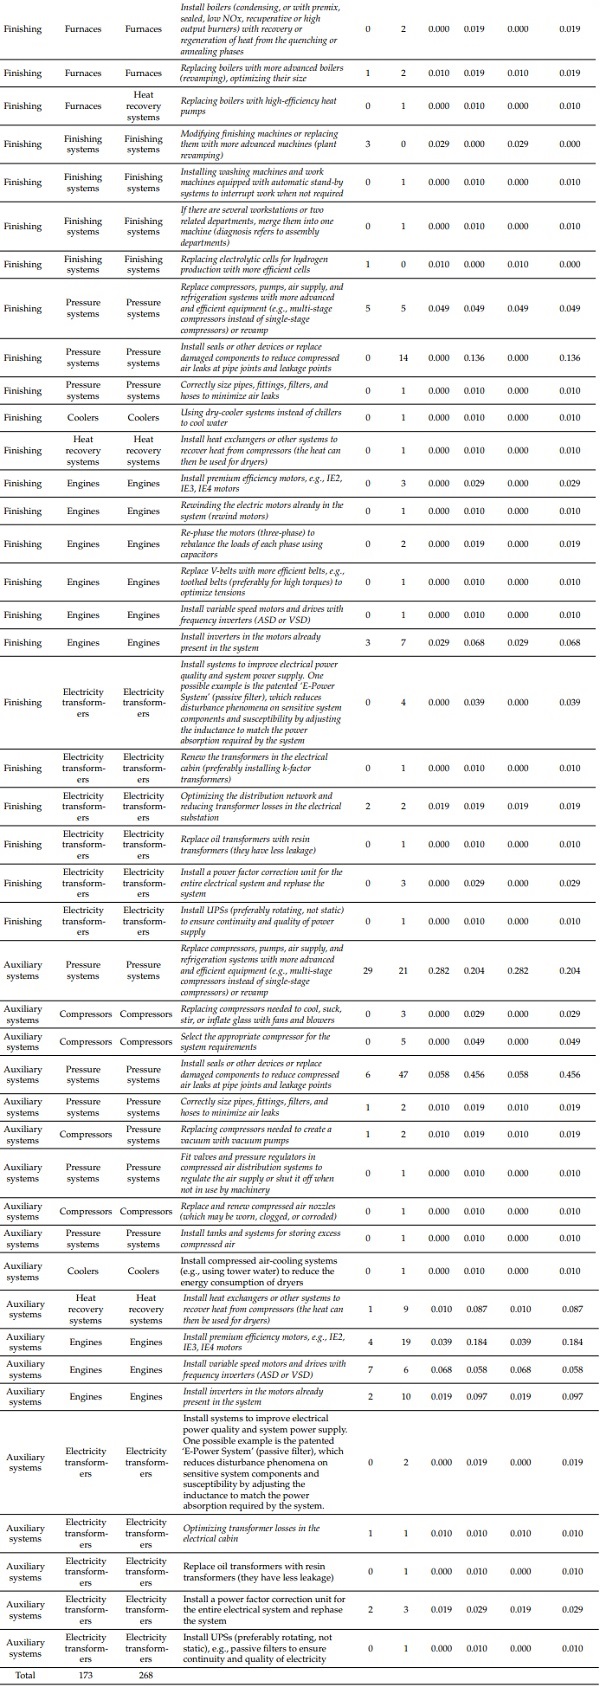
From the analysis of the 103 EAs for the glass sector, it is possible to identify the relevance and use of certain solutions. In fact, solutions with non-null frelevant_a,i values represent energy-efficiency solutions highly implemented in recent years by Italian companies. On the other hand, interventions with non-null frelevant_s,i values represent solutions not yet implemented but that are close to purchase and application. It is possible to state that solutions with high frelevant_a,i values represent established energy-efficiency solutions within the industry, whereas, solutions with high frelevant_s,i values indicate interventions that companies are strongly interested in applying for energy efficiency and economic savings.
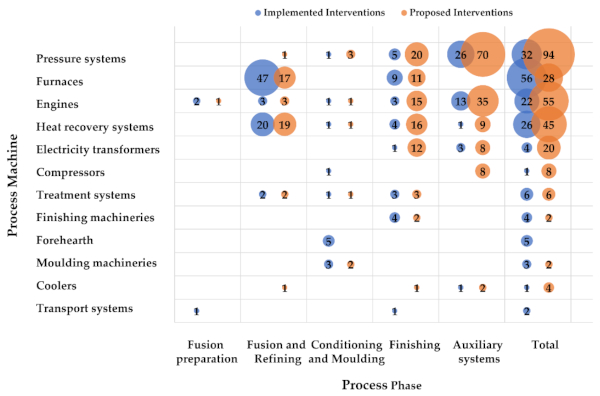
The results of the 103 EAs were analyzed to determine the number of interventions proposed and carried out per process phase (Figure 4), per process machinery (Figure 5), and per type of finished product (Figure 6).
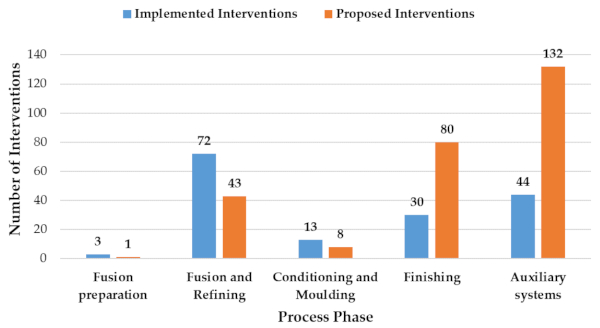
Regarding the macro-phases of the glass-production process (see Figure 1), the results of Table 3 show a high interest in auxiliary services, with 44 implemented interventions and 132 proposed interventions (see Figure 4). Among the macro-phases, the fusion and refining and the finishing processes are those with higher values of interventions. The former sees more interventions implemented (72) than proposed (43), and vice versa for the finishing phase, with 30 interventions implemented and 80 proposed, respectively. The results for the interventions involving the process phases show that, in the last 4 years, great attention has been paid to fusion and refining, as well as to auxiliary services, by implementing energy-efficient solutions. In contrast, in the next four years, great changes will be directed towards auxiliary services and the finishing phase. Few solutions are highlighted in the upstream phase of the process (fusion preparation) and the intermediate phase (conditioning and molding). The results could be attributed to the fact that companies may be more interested in highly improving energy-intensive processes such as fusion and refining and finishing.
The data can also be analyzed considering the process machine of each phase (see Figure 5). The most popular interventions are those for furnaces (56), pressure systems (32), and heat recovery systems (26). In fact, furnaces turn out to be highly energy-intensive assets designed for fusion and refining (47 solutions) and finishing (9 solutions). The most common intervention for these machines concerns revamping to ensure greater efficiency [6,11,12]. Similar to furnaces, most of the interventions for heat recovery systems concern the fusion and refining phase (20 solutions), in which the main focus is the installation of end-of-life regenerative furnaces [11,23]. On the other hand, the interventions carried out for pressure systems mainly concern auxiliary systems (26 solutions). For these assets, the most common solutions implemented concern the revamping of machinery (engines, pumps, compressors, etc.).
Different results concern the proposed interventions, for which the majority are for pressure systems (94), motors (55), and heat recovery systems (45). As for the interventions implemented, pressure systems are more concerned with the process involving auxiliary systems (70 solutions), mainly for the reduction of compressed air losses at pipe joints and points subject to leakage [11,12,24]. Similarly, the solutions proposed for the motors’ efficiency refer to the auxiliary systems (35 solutions), mainly through the installation of premium-efficiency motors (class IE2, IE3, and IE4), and the installation of inverters on motors already present in the system. Instead, the solutions proposed for heat recovery systems mainly involve the fusion and refining phase (19 solutions) and the finishing phase (16 solutions). For the fusion and refining phase, the most proposed interventions concern the use of plate heat exchangers for the indirect pre-heating of steam or cullet [11], and the replacement of available recovery systems with others that use methane or organic fluids as heat vectors (ORC-type exchangers). Finally, it is necessary to emphasise that machinery that is little involved in the EAs analysis are the forehearth, molding, finishing machinery, coolers, and transport systems for both the interventions implemented and those proposed.
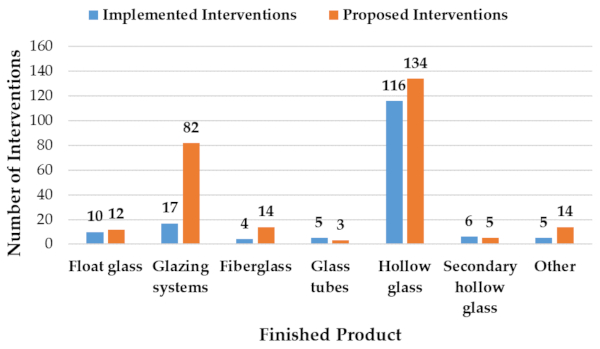
The glass sector in Italy produces several types of finished products (see Table 1). By combining the results of the EAs analysis (Table 3) and the finished product families, it is possible to comment on the relevance of the interventions implemented and proposed (see Figure 6). Most of the interventions carried out concern companies producing hollow glass, with 116 occurrences detected. This result is mainly because hollow glass is the product type most widely processed by Italian companies. However, if we consider the interventions weighted by the number of production sites, high values are reached by glass tube (4 interventions), float glass (10 interventions), and other glass (5 interventions). In fact, glass tubes are produced by only one company in the territory and float glass by four companies, while other products are produced by two companies. The number of interventions for glazing systems, which, despite being the second most widespread type of product in the territory, only records 17 occurrences, which seems to be not very well-considered. As far as the proposed interventions are concerned, those with the highest number of solutions include hollow glass and glazing systems, with 134 and 82 solutions, respectively. Similarly, when considering the production sites, companies dealing with other products are the ones planning more interventions (14).
3.2. Economic Analysis of EAs
Looking at all interventions implemented and identified in the glass sector, the achieved savings of final energy represent 0.7% of the final energy consumption, while the potential savings of final energy would constitute an additional 0.9%. As explained in the previous section, both for implemented and identified interventions, the focus of this article is on technological solutions related to the production phases, auxiliary systems, and heat recovery systems.
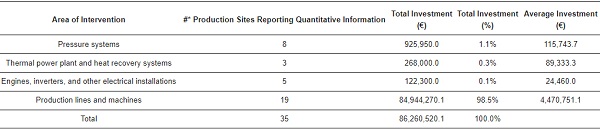
A total of 40 production sites reporting quantitative information on implemented interventions were listed in the analyzed EAs, and the corresponding savings of final energy are shown in Table 4. The quantitative information is identified in four groups: ‘pressure systems’, ‘thermal power plant and heat recovery systems’, ‘engines, inverters, and other electrical installations’, and ‘production lines and machines’. Production lines determine large energy-savings and the largest economic investments (both total and on average). Interventions on the electric or fuel furnace are included in this area, coherently with the technological solutions shown in Table 3, and these are largely represented by replacing the existing furnace with a more modern and efficient one. Pressure systems are the second area, both in terms of savings and total investment, whereas thermal power plant and heat recovery systems are the second area in terms of average investment. The average quantitative data shown in Table 4 and Table 5 was computed as an average of the number of production sites that reported quantitative information.
Table 4. Energy-savings produced by the implemented technological interventions. The total annual savings are calculated as the sum of thermal energy, electricity, and fuel savings.
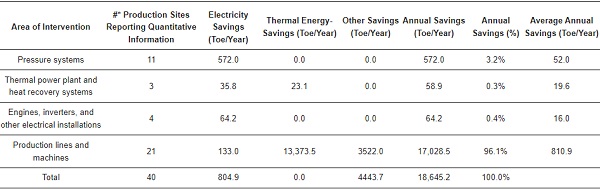
Table 5. Investments required to apply technological interventions.
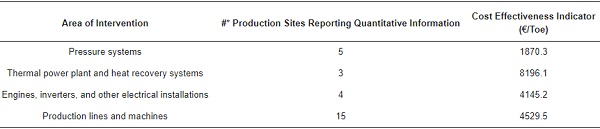
A cost-effectiveness indicator was calculated for each intervention area, estimated as reported shown in Table 6. The available information allowed calculating it for 27 out of the 40 interventions quantitatively collected, reporting information on both energy-savings and costs. The area of ’pressure systems‘ shows an advantageous value of the indicator, confirming that this is a type of measure with a large applicability. ’Engines, inverters, and other electrical installations‘, as well as ’production lines and machines‘, have medium values of the cost-effectiveness indicator, whereas the ’thermal power plant and heat recovery systems‘ area has the lowest relative value of the indicator.
Table 6. Cost-effectiveness indicator for each area of intervention.
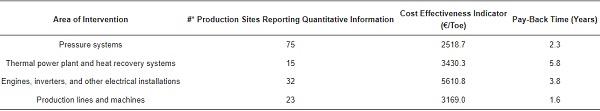
A total of 162 production sites reporting quantitative information on suggested interventions were identified in the examined EAs. For the purpose of this analysis, as already explained for implemented interventions, they are classified in four groups not affecting the production process or the auxiliary systems, such as, for example, lighting, managerial interventions, and production from renewable sources. Table 7 and Table 8 summarize the savings of final energy, together with the investment costs indicated by those production sites that proposed, in EAs, a feasibility study. Table 9 reports the cost-effectiveness indicators calculated for the suggested interventions. Feasibility studies were estimated to achieve electrical savings in all areas while obtaining significant thermal savings in ’thermal power plant and heat recovery systems‘ and ’production lines and machines‘ areas. The highest energy-saving was associated with the ’thermal power plant and heat recovery systems‘ area.
As observed in the implemented interventions, those in production lines were associated with high potential savings, and they are followed by the most significant investment costs (Table 8). This area shows a relatively good cost-effectiveness indicator, and, as shown in Table 3, most technological solutions are applied to furnaces. As for implemented interventions, in this case, furnace replacement represents a high share of interventions. The cost effectiveness of ‘thermal power plant and heat recovery systems’ is aligned to the one of interventions in production lines, but the last area has a significantly shorter payback time (PBT). Interventions in pressure systems have the best value of the cost-effectiveness indicator, while those in production lines show the best value for PBT (Table 9).
Table 7. Energy-savings assessed for the suggested technological interventions. The total annual savings are calculated as the sum of thermal energy, electricity, and fuel savings.
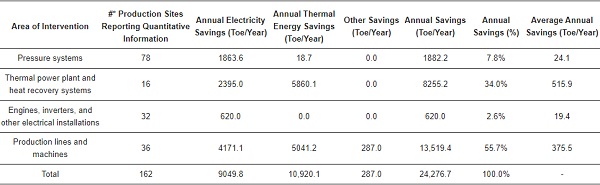
Table 8. Investments assessed for the suggested interventions.
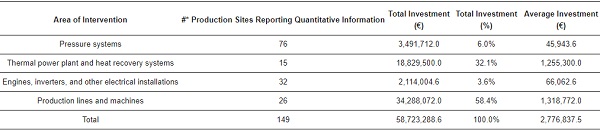
Table 9. Pay-back time for each area of intervention.
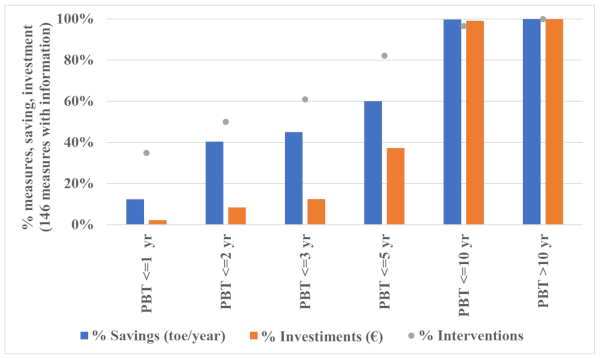
Suggested technological interventions can also be analyzed distinguishing their PBT class (see Figure 7). In this case, 146 out of 162 interventions report quantitative information. Suggested interventions with PBT between 1 and 2 years represent 28% (4.2 ktoe/year) of total annual potential saving. A further 15% potential savings is associated with interventions having a PBT between 3 and 5 years (2.2 ktoe/year).
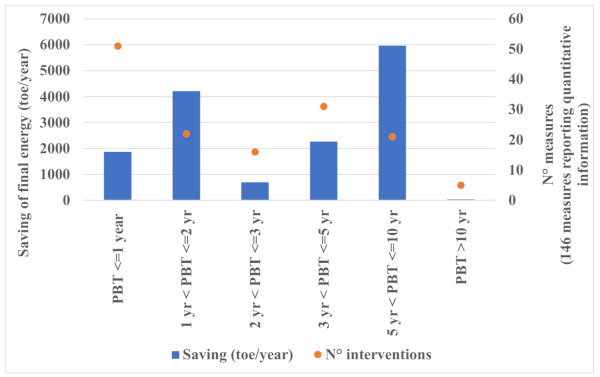
Finally, Figure 8 shows that half of potential savings (6.8 ktoe/year) can be achieved by adopting interventions with a PBT lower than 3 years and by mobilizing 12% of total investment associated with the suggested interventions (around EUR 4.4 million). This highlights the fact that relatively less expensive interventions are associated with a high savings potential, and such a trend appears even more significant when considering that existing incentive mechanisms are not included in the PBT calculation.
4. Discussion
As shown in Figure 4, the glass-production process presents numerous possible interventions to improve energy efficiency, mainly related to auxiliary systems or to technologies in the process phases of fusion, refining, and finishing. As far as auxiliary systems are concerned, most of the solutions found by EAs relate to future interventions (132). In turn, most of these solutions refer to pressure systems and engines. For both objects of intervention, the proposed improvements mainly deal with the revamping of machinery with more efficient systems.
Indeed, the average investment required for implementing the suggested interventions in pressure systems is relatively low (around EUR 45,000). Instead, the average investment for interventions on engines is around EUR 65,000. In terms of cost effectiveness, as already highlighted, pressure systems have the best value of the indicator. Looking at the share (see Figure 6) of these two areas in different PBT classes, the share of pressure systems decreases by increasing the PBT class, showing that this area is characterized by a relatively short return on investment. Differently, the intervention area related to engines has the highest share in the PBT classes between 2 and 3 years and between 3 and 5 years.
To summarize, pressure systems appear to be associated with most immediate returns, whereas interventions on engines are interesting when considering economic indicators but are likely to be planned due to the key role of associated devices in the production process. On the other hand, as far as process phases are concerned, fusion and refining is the one with the highest number of interventions carried out (72). In fact, this phase highly involves energy-intensive plant assets, which must reach and maintain extremely high temperatures throughout the melting phase. The refining process phase sees most interventions carried out on furnaces and heat recovery systems. In particular, for the furnaces, most of the reported interventions concern the revamping of machinery, as well as wall isolation. Both implemented and proposed interventions in production-line group classification are characterized by relatively high investments when compared to interventions in other areas.
Moreover, in terms of investments, heat recovery systems are the second area characterized by higher relative investments (see Table 8). Most of the interventions in production lines are in the first two PBT classes. By contrast, heat recovery systems are concentrated in the two central classes, with PBT between 3 and 5 years and between 5 and 10. Instead, the finishing phase sees most of the interventions of interest in the coming years (80). A quarter of these interventions are aimed at pressure systems, the majority of them at reducing compressed air losses. As already highlighted, pressure systems are a very interesting intervention area relative to all economic indicators for suggested interventions, such as average investment, cost effectiveness, and PBT.
Finally, it is necessary to report that some of the technologies for energy efficiency found in the literature are not actually taken into consideration by the 103 Italian companies. A first justification may be due to the state of technological advancement of the solution, which may be in the initial or declining stage. Early-stage technologies can be considered emerging. Consequently, the actual benefit of their application is not yet fully clear. On the other hand, end-stage technologies are regarded as obsolete. Consequently, they represent less efficient and more expensive interventions with respect to other solutions. Finally, another possible justification for the non-application of certain technologies turns out to be great change for the production process by defining destructive changes.
5. Conclusions
Improving the energy efficiency of companies is increasingly relevant in terms of both the economic impact (perceived in the short term) and the environmental impact (perceived in the medium to long term). In this context, several industrial sectors are involved and interested in improving energy performance. Previously, research has proposed energy-savings indications for different sectors, such as the foundry [9] and cement [8] industries. Among sectors, glass manufacturing is highly energy-intensive, consuming globally about 45,000 TJ per year. Glass-industry technological interventions have not already been investigated. For this reason, a detailed analysis of energy-efficiency technological solutions was conducted. An updated list of technological energy-saving opportunities was provided, dividing them according to both the process phases and the asset involved. The analysis shows evidence of all solutions in the literature as the basis of the state of the art. These solutions were supplemented by all of the interventions highlighted by the EAs of 103 glass-production sites distributed throughout Italy.
As mentioned above, an EA is a systematic document that is necessary to analyze potential future investments in energy-saving solutions. The energy analyses provide statistical results of the interventions carried out and proposed by Italian companies, dividing them per process phase, process machinery, and the type of final product produced. Furthermore, from the EAs’ economic data, the monetary relationships for the application and applicability of certain technologies were identified. The energy and economic analyses did not consider solutions for plant lighting and heating, downstream processes for quality control and product packaging, and solutions for sensor installation. In contrast, solutions for auxiliary systems were considered, being not negligible for energy efficiency. It is relevant to highlight that the results of statistical and economic analysis could represent a guide for companies willing to improve their sustainability. However, the selection of an optimal solution depends on strategic decisions that could be company-specific.
The results of the EAs show that most of the solutions concern proposed rather than implemented interventions. Among these, auxiliary systems are most frequently considered for the improvement and revamping of pressure systems and engines. Instead, from a production process point of view, among the four identified phases of the glass-manufacturing process, fusion and refining and finishing are phases of particular interest. Specifically, in the fusion and refining phase, most of the implemented interventions relate to furnaces and heat recovery systems. On the other hand, in the finishing phase, most of the solutions proposed deal with interventions on pressure systems, heat recovery systems, and engines. In contrast, not many solutions were found for the fusion preparation and conditioning phase, nor for the molding one.
From a finished product point of view, Italy shows particular interest in the production of hollow glass and glazing systems, for which the largest number of proposed and implemented interventions are reported. However, when weighed by the number of production sites used, high values are reached by the product types of glass tubes and other products. It is therefore possible to state that, although these are not very popular types of products in Italy, they are those for which companies on average implement and propose the highest number of solutions, so they are considered to be of great interest.
From an economic and energetic point of view, the analysis of implemented interventions listed in the EA shows interesting values of achieved savings. Final energy savings can be computed, namely considering several technical, technical–managerial, and managerial intervention areas, excluding cogeneration/trigeneration and production from renewable sources. The interventions described in the EAs by the obliged companies are associated with achieving savings of final energy equal to 0.7% of the final energy consumption in the glass sector. The scope of an EA is to describe the energy consumption structure at the site level, identify the energy performance indices, and compare these with those in the literature. Then, on top of this, EAs aim to identify the most effective energy-saving opportunities. Solutions identified in the EAs, if implemented, would be associated with final energy savings equal to 0.9% of the final energy consumption of the glass sector.
The focus in this article was on a specific group of interventions, related to technological areas relevant to the production process, auxiliary systems, and heat recovery systems. However, this focus can be seen as a limitation of the study, so that future work can address other types of improvements besides glass-production equipment. Interesting energy-saving opportunities exist in all areas, although they are differentiated in terms of investment, cost-effectiveness, and PBT. Technologies used in the production process, as well economic characteristics at the site level, are very likely to influence the identification and choice of interventions. Currently, the surge in energy prices is likely to have a general effect in lowering PBT but also in negatively affecting the company’s willingness and ability to adopt new investment projects.
In this work, two objectives were achieved that represent the greatest contribution for both practitioners and researchers. The first was to provide an updated list of technological energy-saving opportunities for glass-production plants. The second objective is to map the current Italian situation and future perspectives. Possible, future developments could be the analysis of the current and technological status of glass companies in other countries, thus comparing common practices and highlighting the motivations behind certain choices.
Furthermore, it is interesting to check periodically which solutions have actually been implemented and which others are proposed according to technological advances and international regulations. Moreover, another possible future development could be the analysis of other highly energy-consuming production sectors located in Italy. Finally, it is worth mentioning that this work does not prove which is the overall best solution, which is strongly related to the needs/constraints of each company. Indeed, companies could give different priorities to distinct aspects (e.g., economic, environmental, etc…). Accordingly, a possible future research development could be exploiting a multi-criteria decision-making (MCDM) model to define the best solution to adopt given a certain context.
Author Contributions
Conceptualization, A.C., L.L., S.F. and F.D.C.; methodology, A.C., L.L., S.F. and F.D.C.; software, C.M., M.S., F.M., A.C. and L.L.; validation, A.C., L.L., S.F., F.D.C., F.M., M.S. and C.M.; formal analysis, A.C., L.L., S.F. and C.M.; investigation, A.C., L.L., S.F., and C.M.; resources, C.M. and M.S.; data curation, A.C., L.L., S.F. and C.M.; writing—original draft preparation, S.F.; writing—review and editing, A.C., L.L., F.D.C., C.M., F.M. and M.S.; visualization, S.F..; supervision, F.D.C.; project administration, F.D.C., F.M. and M.S.; funding acquisition, M.S. and F.M. All authors have read and agreed to the published version of the manuscript.
Funding
This work is part of the Electrical System Research (PTR 2019–2021), implemented under Programme Agreements between the Italian Ministry for Economic Development and ENEA, CNR, and RSE S.p.A.
Institutional Review Board Statement
Not applicable.
Informed Consent Statement
Not applicable.
Data Availability Statement
Data is contained within the article.
Acknowledgments
The authors gratefully acknowledge the technical support provided by the Italian Association of Glass Manufacturers.
Conflicts of Interest
The authors declare no conflict of interest.