")
This paper was first presented at GPD 2025.
Link to the full GPD 2025 conference book: GPD_2025_ConferenceProceedingsBook.pdf

Authors: Chris Davis a, Tom Granvik b, Kevin Yin c, Richard Sellman d, Rory Back e, Christian Scherer f , Luigi Giovanni c
a. H.B Fuller | Kömmerling Chemische Fabrik GmbH, Germany
b. Glasscheck Oy, Finland
c. Eckersley O’Callaghan Ltd, United Kingdom
d. British Fenestration Rating Council, United Kingdom
e. NSG Group, Pilkington Technology Management Ltd United Kingdom
Abstract
Achieving sustainable glass facades requires a profound understanding of the temporal shifts in the long-term thermal performance of Insulating Glass Units (IGUs). The insulation effectiveness of IGUs is not static; any degradation directly impacts the carbon footprint of a building, necessitating its consideration from both the initial design phases and at the point of evaluating the existing fabric. This is exacerbated by evolving climate conditions and increasingly stringent demands on IGU performance, raising concerns about the predictive accuracy of standardized testing for effective service life. To address these challenges, understanding failure mechanisms—such as argon gas leakage and potential Low-E coating deterioration—is essential to extending IGU lifespan and optimizing energy efficiency. Failure in these components may result in increased thermal transmittance, accelerated energy losses, and a corresponding rise in greenhouse gas emissions, which will ultimately shorten the service life of IGUs and elevate both operational and embodied carbon values. Field-testing IGUs to evaluate performance degradation offers crucial insights, enabling a data-driven approach to model these shifts accurately over time. Such empirical data is foundational in constructing a dynamic facade model, capable of forecasting IGU-related carbon emissions across various lifecycle stages. Through dynamic modelling, we can establish a robust framework for managing IGU lifecycle phases strategically, from operational use to recycling, reuse, or repurposing. As the imperative to achieve netzero buildings intensifies, identifying current trends and improvement areas in IGU design and lifecycle management becomes critical. By advancing product performance and refining lifecycle strategies, we enhance the role of glass as a cladding material of the future for high-performance, low-carbon building envelopes. We discuss the essential developments needed for the sustainable evolution of IGUs to underpin glass facades as a cornerstone in the pursuit of a net-zero built environment.
Article Information
- Published by Glass Performance Days, on behalf of the author(s)
- Published as part of the Glass Performance Conference Proceedings, Volume 1, June 2025
- Editors: Jan Belis, Christian Louter & Marko Mökkönen
- This work is licensed under a Creative Commons Attribution 4.0 International (CC BY 4.0) license.
- Copyright © 2025 with the author(s)
1.Introduction
Achieving net-zero energy buildings relies on a combination of reducing energy consumption in heating and cooling systems, high-performance insulating facades, and the strategic integration of renewable energy sources. Unlike other cladding materials, glazed facades serve not only as insulators but also as essential elements for daylighting, occupant well-being, and incorporating multifunctional applications such as dynamic solar control, privacy features and infotainment systems.
The long-term sustainable benefits of using IGUs remains underexplored, particularly in terms of their carbon footprint over a building's lifespan. Understanding the "effective" life cycle of IGUs is critical for evaluating their overall impact on sustainable construction. This paper examines key factors influencing IGU sustainability, including:
- The role of IGUs in green construction
- Key failure mechanisms and service life considerations
- The value of field testing and diagnostic methodologies
- A dynamic carbon assessment model accounting for IGU degradation
While voluntary frameworks such as LEED, BREEAM, and Passive House drive sustainability efforts, regulatory policies will likely have the most significant impact. Legislative measures including the European Directive 2010/31/EU (2010), New York’s LL 97 (2024), and regulatory initiatives in Shanghai, China (2018) demonstrate a growing focus on penalizing the poor long-term performance of building fabrics. Additionally, financial incentives, such as the European SEPA "Gear Up" initiative, are emerging to support sustainable building renovations.
The assessment of building materials increasingly relies on embodied carbon evaluations, expressed through Environmental Product Declarations (EPDs) or Life Cycle Assessments (LCAs). If IGUs can maintain low thermal transmittance (U-values) for greatly extended periods, then their embodied carbon impact, and the cumulative carbon footprint of the host building can be significantly reduced. This defines the point at which IGU insulation performance becomes unacceptable and is essential for establishing an effective service life (ESL). This requires dynamic modelling that accounts for changes in IGU thermal performance over time.
Whilst some basic models already exist to address this need, they are generally recognised as being stepping-stones in the development of more flexible and responsive instruments. It is the intention of this paper to present the landscape and considerations around the development of accurate dynamic carbon models that can include the real time life cycle performance of IGU’s as part of glazed assemblies. While our focus here is on insulating glass, it is important to note that data and guidance on the deterioration of the insulation values of other insulating materials used in building fabrics requires equal exploration (Bae, Ahn, Kang, et al. 2022), (Scherer, C., & Davis, C., 2023).
Whilst much work already exists around the failure modes for IGU assemblies (Wolf 1992, 1993) and the recent work by Hyviid & Friis (2025) around the relevance of EN 1279-Part 3 (2018), it is clear that field testing will deliver a clearer understanding of real-world performance. Recent advancements in in-situation gas content measurement and emissivity assessment protocols enable more accurate tracking of IGU degradation. This study evaluates real-time IGU gas content in existing buildings, correlates findings with thermal performance changes, and proposes a refined model for assessing IGU sustainability.
Given the increasing scarcity of raw materials and the imperative of net-zero construction, IGU performance benchmarks should be redefined to exceed the conventional 25-year lifespan, particularly for structural glazing applications in evolving climatic conditions.
2. The Price of Hermetical Seal Failure
2.1. Background to insulating glass
The formats, designs, and components used in IGU manufacturing have evolved significantly in recent decades, with an increasing shift from double-glazed to triple-glazed assemblies. The traditional method of IGU fabrication involves a polyisobutylene-based primary sealant applied to the glass interface edges of metal or composite hollow spacer bars filled with moisture-absorbing desiccant and sealed with a secondary sealant. Gas filling has now become standard practice in most applications and markets in order to enhance insulation performance. As noted by Likins-White, Tenent, and Zhai (2023), the primary seal remains crucial in ensuring gas tightness and maintaining a low Moisture Vapor Transmission Rate (MVTR), thereby preserving long-term IGU performance.
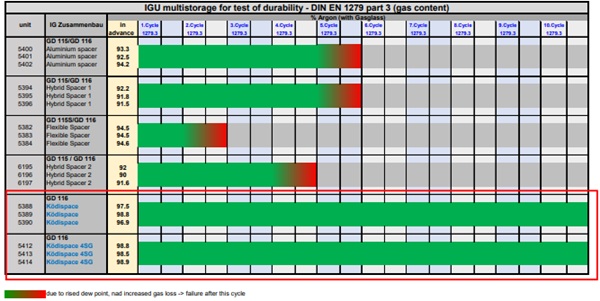
It is noted that the long-term performance of different IGU’s constructions can vary dramatically. The paper discusses failure of the cavity, gas loss and the potential impact on coating emissivity performance as the condition of the cavity deteriorates. This is demonstrated by in house testing under EN 1279: Part 3 (2018) at H.B Fuller assessing the life cycle performance of different spacer configurations. Whilst retaining constants in secondary and primary sealant materials and production quality, the number of cycles required to drive dew point failure varies widely across different spacer systems. The rate of gas loss measured throughout the experiment for each configuration also varies significantly as detailed in Figure1. (Davis & Scherer, 2023).
2.2. Coating Behaviour
To achieve increased thermal performance and energy savings, many IGUs incorporate glasses with low-emissivity coatings. A typical material used to add this property is silver as part of a multi-layer stack. Such coatings are usually deposited using magnetron sputtering. Additional layers of silver can be deposited to increase the spectral selectivity of the stack. Including these high-performance coatings can dramatically reduce the U-value of an IGU, hence the interest in exploring their performance over the lifetime of the unit.
Silver is vulnerable to damage from moisture, sulphur, and chlorine (Laird & Wolfe, 1994). Care must be taken to prevent exposure of the coated surface to the outside environment and extreme conditions, particularly moisture. Although the coating structures themselves are very stable, their performance can be compromised where the condition of the cavity fails.
Silver-based coatings are deployed on the internal surfaces of the unit, protecting them from direct atmospheric exposure. Combining the use of neutral insulating gasses such as argon and including desiccant within the spacer, excludes moist air from the cavity thus reducing the risk of damage to the coating. If the perimeter edge seal is unperturbed, the contribution of the coating in reducing the U value should not change over the lifetime of the unit. Hence the coating is considered to be a static element in normal circumstances.
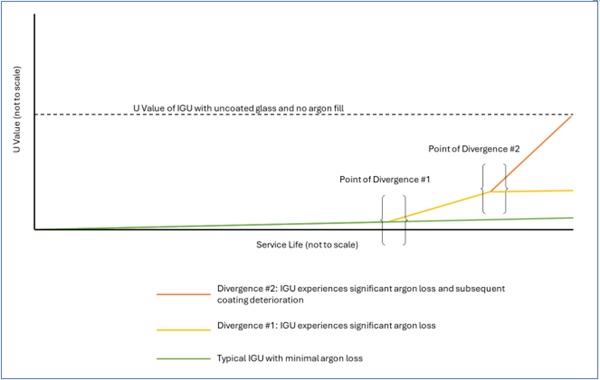
The green line in figure 2 shows the expected performance of an IGU over its lifetime. A wellconstructed IGU should only lose a very small amount of the argon gas fill if any, with a relatively insignificant effect on thermal performance.
- Point of Divergence #1 - In the event of the seal failing, it is possible for argon gas to escape and be replaced by air. The rate at which this happens is dependent on many factors contingent on the particular IGU construction, materials used and the environment of the unit. Desiccant within the spacer tube is designed to absorb moisture and prevent humidity building up within the IGU. If the seal has failed, and the desiccant eventually becomes saturated then moisture can build up leading to a reduction in thermal performance, as air is a poorer insulator than argon. There is then the potential risk of corrosion damage to silver-based coatings, if present, from moisture and sulphur in the relatively moist air
- Point of Divergence #2 - Shows the event of coating deterioration, caused by an attack on the silver of the low-emissivity coating by moisture and sulphur. The rate of this deterioration is also contingent on localised factors and is generally observed to be slow. It can manifest as the appearances of scattered pinholes, or as a hazy appearance across the surface.
Figure 2 assumes that the behaviour of the corroded coated pane finally reverts to that of uncoated float glass. According to BS EN 673 (2024) once moisture appears on the inner pane no U value benefit can be claimed for the coating. For both thermal and aesthetic reasons, any unit that suffers this unusual failure should be replaced. The causes and mechanisms of this unusual phenomenon of coating deterioration and its effect on the low-emissivity performance of the unit, have been identified as areas for further study.
Where catastrophic failure of the cavity condition occurs, and the desiccant components become saturated then failure of the coating may ensue as noted by Akoi-Kramer (d.n.). Although the degradation visible on this occasion was within several years, the rate of such corrosion and possible reduction in thermal performance, are difficult to model. The conditions are contingent upon many variable factors related to the particular make-up and construction of the IGU and the environment it occupies. Damage to the coating can also cause visual aberration, but the rate at which this will become apparent is also dependant on contingent factors.
Such failures can be caused by poor quality assurance and control at the point of manufacture, or incorrect handling during installation, leading to inadequate sealing. IGU / façade designs that are untested, novel, or inherently flawed are also potential causes. Designs with ports or venting tubes are particularly susceptible (Hubbs and Higgins, 2015).
2.3. Coating Resilience & Future Considerations
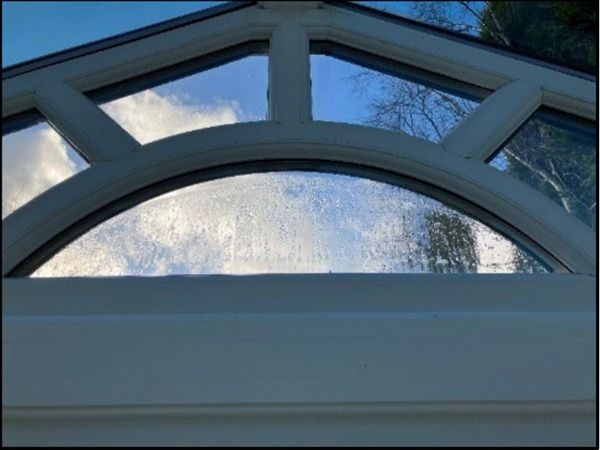
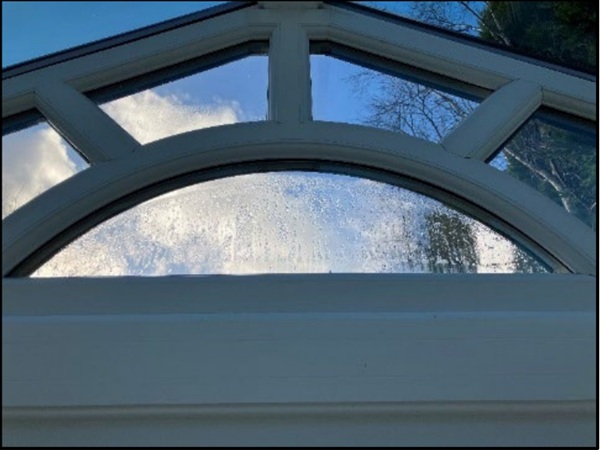
It is important to note that coated glasses in IGU’s that are subjected to a significant failure in the condition of the cavity will experience deterioration. Pictured in figure 3 is a typical double-glazed unit that has suffered a seal failure and subsequent moisture ingress. However, it’s silver-based low emissivity coating has not shown any visible corrosion, even a year on from the failure. Advances in modern sputtered coatings mean they are increasingly resilient to moisture damage, benefitting from protection added by additional layers in the coating stack.
Low-emissivity coatings that do not include silver are less vulnerable to corrosion. Pyrolytic lowemissivity coatings, deposited using the chemical vapour deposition process, do not have the same vulnerability as their silver-based sputtered counterparts. The emissivity values of Pyrolytic coated glasses cannot currently reach the very low performances achieved by the sputtered coatings.
2.4. Long Term Gas Retention & Performance
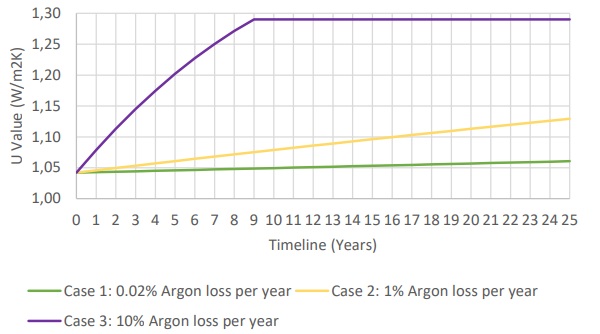
Figure 4 shows the change in U value of an IGU for three scenarios. In all the cases, the construction of the IGU is two panes of 4 mm soda-lime float glass with a 16 mm cavity. Surface #3 has a silverbased coating with an emissivity value of 0.01:
- Case 1: A well-constructed unit should lose less than 5% argon fill over a 25-year timespan translating to an insignificant change in thermal performance. The observed leak rate can be as low at 0.3 to 0.1 % per year (BS EN 1279-3, 2018). This is shown as Case 1. When such performance is measured during a renovation study, a strong case can be made for keeping the units, as they will likely still meet energy codes, assuming these are unchanged.
- Case 2: A unit that loses 1% argon fill per year, which is the maximum amount permitted according to BS EN 1279-3, the specification standard for IGUs
- Case 3: A defective IGU losing 10% argon gas fill loss per year. Such a unit does not meet the requisite standards and should detected by quality control at the point of manufacture. The loss is enough to moderately reduce thermal performance and may affect the window energy rating. As the argon is replaced by air, the risk of condensation and coating failure increases.
2.5. Discussion
The operational energy and carbon savings made by survey-targeted unit replacement are such that they are highly probable to outweigh the embodied costs of replacing units. Additionally, new service providers are creating a circular economy, promoting the recycling of materials from units at the end of their operational life. Instead of generating waste, end-of-life material can be reprocessed, and displace raw materials from the manufacturing process (GlazingRecovery.org).
Utilizing low-carbon variants of glass, spacers, and adhesives, enables the embodied carbon of replacement units to be reduced and this is included in part in section 4 (Sheikh, A.Y et al, 2023).
2.6. Future Research
Further testing on coating behaviours is required in order to a) fully comprehend the impact of moisture on the emissivity performance of coatings over time and relevant to cavity condition; b) have a clearer picture of time dependency of this behaviour in order to better serve the requirements of dynamic carbon models. The results of this testing will form part of a subsequent paper.
3. Field testing
3.1. Purpose and Method
Understanding IGU service life requires accurate data, as simulations and models depend on reliable inputs to produce meaningful results. Key observations from field tests will contribute to refining dynamic forecasting models, improving the accuracy of IGU performance predictions. The purpose of the IGU field testing for this project is to measure current argon concentrations and evaluate gas concentrations over time using readily available equipment and methods with the following objectives:
- Identify gas content variations over time and across different facades.
- Assess factors influencing IGU longevity.
- Establish correlations between service life and gas retention.
- Investigate potential patterns of accelerated leakage.
The findings are based on the following:
- Existing data from past surveys (as provided by Glasscheck, Oy).
- New measurements from a project sample set covering a variety of installation periods, retention styles, and both double- and triple-glazed assemblies.
Emissivity measurements were also recorded to benchmark centre-pane Ug values alongside gas content. Previous to this project, field tests had been conducted on IGU installations in a range of buildings with up to and in excess of 20 years of service, including a range of applications from office buildings, public buildings to private housing. Tests were conducted based on carefully designed test plans considering the need for recording elevation, number of floors, type of glazing, glass surface areas, length of service, etc. Gas concentration measurements were taken at multiple points on each facade with sample sizes varying from 5%-30% of the total glazed area.
3.2. Equipment Used
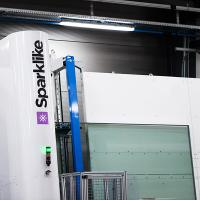
For gas volume measurements, the Sparklike LP 2.0, gas fill rate tester was used (IFT Rosenheim). A Suragus, EddyCus TF portable 1010 was also employed for non-destructive emissivity value measurements.
3.3. Historical Field Survey and Trends
A selection of data collected by Glasscheck from surveys carried out before the project was collated. Typical test protocol for existing assessments were as follows:
- Window surface area
- Building elevation
- Length of IGU service
- IGU assembly details
- Gas concentration levels
- Current assessment of centre pane Ug-value
3.4. Key Findings from Historical Data
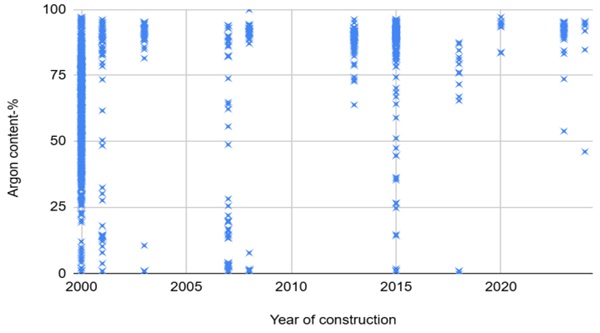
The distribution of results from historic surveys are depicted in figure 5 and results are shown from 1,116 IGU’s. The results tabled in figure 7 were measured between 2022 and 2025 and show the argon concentrations evident in IGU’s manufactured from 2000 through to 2024. This delivers a mean average of gas concentration across all results of 59%.
3.5. Project Specific Field Studies
As part of this paper field testing was also conducted on IGUs installed in five commercial properties in central London with IGU service lives varying from 10 years to 25 years. There was no “as installed” information to confirm the specifications of the individual IGU assemblies and only selected levels from each of the buildings were accessible for measurement over the survey period. The scope of the survey data captured was extended for the purposes of the project specific studies as follows:
- Window surface area
- Topography
- Glazing system type and condition
- General condition of IGU’s
- Emissivity measurements to assess coating performance
- Ug-value calculation
3.6. Results of the Project Specific Field Test Studies
Table 1 records gas concentrations recorded across a sample number of IGU’s from each building. These results demonstrate that gas loss cannot be relied upon to be consistent, even across identical IGUs installed in the same retention systems.
Table 1: Summary of results from the building stock surveyed for the project. (Courtesy of Glasscheck & BFRC)
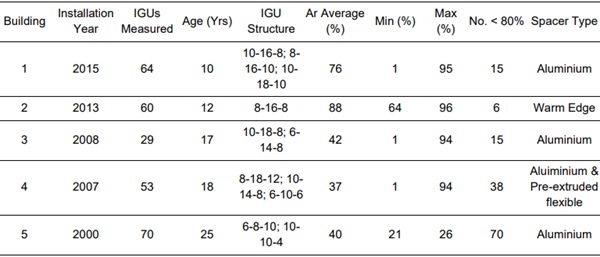
Figure 6 shows the resulting distribution of argon content measured is expressed as a percentage. A minimum concentration of 80%, as expected after 25 years in accordance with EN 1279-3 (2018), is shown as a red line. Therefore, the average gas content of the units measured falls below 80% on 4 out of 5 of the buildings measured for the project. Gas content below 80% was observed, to some extent, in all installations regardless of age. Gas concentrations generally reduce over time with higher values present in later buildings and lower values in the older installations.Noting that only building 2 utilised a warm edge spacer system, the other 4 were all based on aluminium hollow spacers of varying cavity widths. (Figure 6)
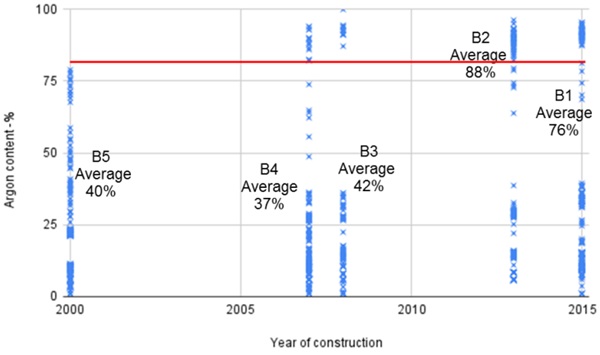
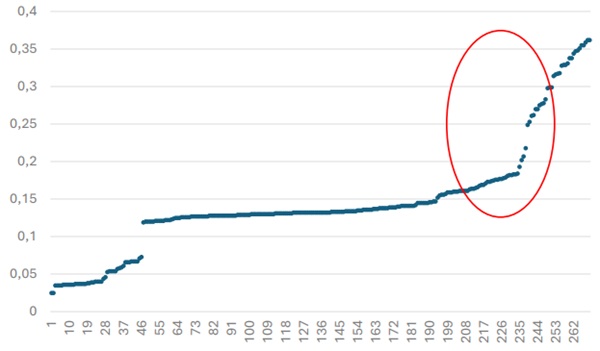
Figure 7 represents emissivity data across all samples already measured for gas content. Although not individually aligned, the data suggests that, based on the date of installation and the values obtained, that the IGUs contained either uncoated glass, a soft coated low E glass (emissivity, ~0.03) or alternatively a hard (body) coated glass (emissivity, ~0.13 – 0.15). The expectation is that hard coated low E glass are unlikely to degrade. Therefore with around 11% of the results at >0.2 (emissivity) as shown inside the red circle this could suggest a degree of degradation on soft coated glasses and be a focus for further research (Figure 7).
3.7. Summary of the Project Field Test Results
On buildings 4 (2007) & 5 (2000) there was a distribution of argon concentrations from 1% - 90% as shown in figure 8.
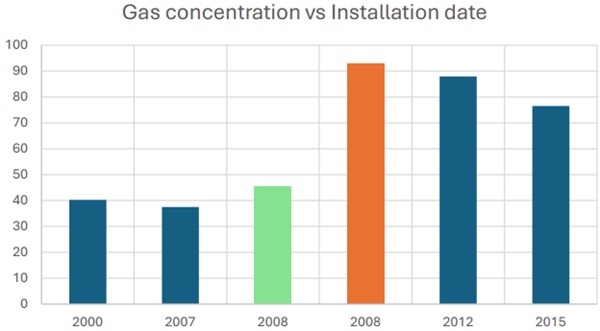
In order to establish an average gas loss rate it would be reasonable to suggest that they had similar concentrations when manufactured. The data set for building 3 (2008) requires some further explanation ad appeared to have been either gas-filled or air filled. It had an average gas concentration of 42% however the IGUs measured in building 3 appear to be from 2 separate manufacturers and could have been either gas-filled or air filled. Averaging the results of the gas filled units only, the value was >90% shown blocked in red (Figure 8). If it is assumed that all of the IGU’s were gas filled at the point of manufacture then to calculate an overall gas loss value, it would be reasonable to estimate initial gas concentrations of 90% - 95%, which is generally accepted as the benchmark for good quality production. The calculated average annual gas loss rate assumed for the project overall would then 2.11% per year.
A number of assemblies showed minimal gas loss and were still within the parameters of compliance with EN 1279-3 (2018), this accounted for around 20% of the sampling survey.
3.8. Summary of Findings from Field Testing
- While gas leakage is commonly observed, it was not observed in all IGU’s measured.
- Findings would indicate some correlation between time and gas loss rates.
- The vast majority of IGUs tested did not show visual evidence of failure or degradation.
- Gas retention is influenced by multiple factors, including manufacture, installation quality, and environmental conditions.
- Current evaluation methods based on visual inspections are not sufficient to indicate thermal performance.
4. Modelling
The impact of thermal degradation of IGU’s has a cumulative impact on the energy loss and consequently the predictive carbon calculation model for either existing or new build constructions. The dynamic nature of the thermal performance of IGU’s is generally not considered in the calculation protocol in current design process.
4.1. Modelling approach
A static performance of IGU’s is usually adopted in the current building design process where the thermal performance of IGU’s as manufactured is assumed for the entire service life. This is mainly due to two reasons: (i) the practical complexity of accounting for this phenomenon in the simulation workflow; (ii) the knowledge gap over the long-term thermal behaviour of IGU’s. The building energy performance based on the static performance of IGU’s may underestimate the operational energy demand for aged buildings. This may lead to inaccurate LCA of building fabric.
A dynamic modelling approach is explored in this paper where the change of thermal performance of glazing throughout the service life is accounted for in the building energy model. It also highlights the need for further research to understand the long-term thermal performance of IGU’s in buildings.
4.2. Case studies and modelling assumptions
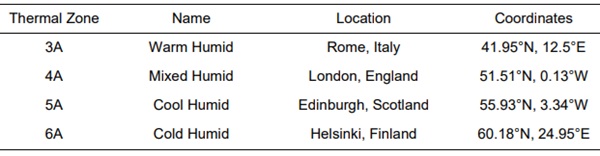
Different building typologies were considered for this study, with the aim of assessing the effect of the IGUs performance decay on different building types. The building models used in this phase are derived from the Prototype Building Models created by the Office of Energy Efficiency and Renewable Energy (EERE) of the Department of Energy of the United States (DOE) (a.n.). In detail, three new construction building prototypes, relative to the ASHRAE standard 90.1 (2022), were selected for the current study, namely the Medium Office, the Midrise Apartment and the Primary School. For Each of these models, four different climates were considered based on the thermal zones definition in ASHRAE standard 169 (2021), selected to represent the different European climatic conditions. Details of the climates selected and of the representative geographical locations are reported in Table 2.
Table 2: Locations and relative thermal zones considered for the study
As all the geographical locations considered are in Europe, some amendments were necessary to the prototype buildings to suite the typical characteristics of buildings in Europe. The main amendment regards the thermal properties of the building envelope, which were modified to reflect typical design targets to meet the local requirements of each of the cities/countries considered (Italian Republic, 2015), (Great Britain, 2023), (Ladybug Tools, 2025). Table 3 provides the thermal transmittance of the opaque building envelope used in each climate.
Table 3: Opaque envelope thermal transmittance for each climate assumed in modelling
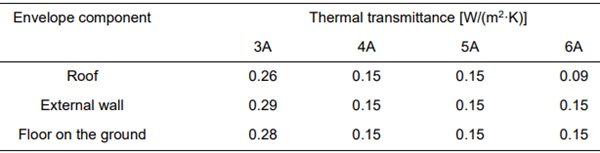
As regards the transparent envelope, different glazing technologies were considered depending on the climate. DGU is assumed for climate Zone 3A, 4A, and 5A whilst TGU is assumed for climate Zone 6A.
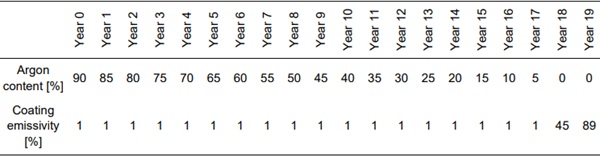
The field testing presented in the previous section shows a wide range of variation in the gas content and coating emissivity in the IGU’s in aged buildings. Due to limitation on size of samples it is not possible to fully understand the factors affecting the performance aging. In the absence of representative IGU thermal performance aging model, a theoretical model is adopted to highlight the potential impact on the building energy. Table 4 shows the assumed performance decay of the IGUs both in terms of argon content of the cavity and of the coating emissivity relative to each year. It should be noted this assumption is theoretical designed to highlight the impact of dynamic modelling as an approach and is not based on any current field-testing evidence due to the current lack consolidated evidence.
Table 4: Theoretical assumption of the performance decay of the IGUs relative to the argon content of the cavity and to the emissivity of the coating.
The number of levels and the Window-to-Wall Ratio (WWR) of the building prototypes were changed in order to adapt them to the European building stock. The number of levels was changed as follows: from 3 to 6 for the Medium Office; from 3 to 8 for the Midrise Apartment. The WWR was changed as follows: from 0.33 to 0.69 for the Medium Office; from 0.20 to 0.40 for the Midrise Apartment; from 0.35 to 0.4 for the Primary School.
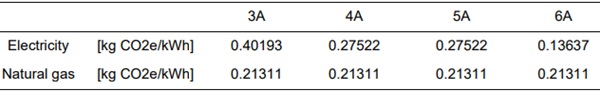
The operational carbon was calculated for all the climate-building type combinations applying a conversion factor to the energy needs for heating and cooling. The conversion factors used to calculate the operational carbon, derived from Ladybug Tools (2025), are presented in Table 5. These are country-specific for electricity, as they depend on each country grid emissions, while being country independent for natural gas.
Table 5: Conversion factors from delivered energy to operational carbon for the four climates considered
4.3. Results – operational carbon of limit states
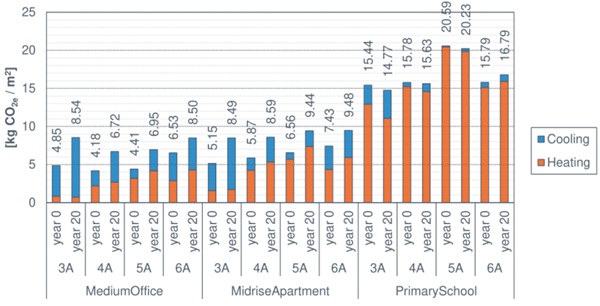
Figure 9 shows the operational carbon for the climates and building types considered, relative to the performance of the IGU at year 0 and year 20, i.e. with the best and worst performances assumed. It is possible to observe that for both the Medium Office and the Midrise Apartment typologies the performance decay always generates an increase in operational carbon. The increase is higher for the 3A climate and progressively lower for colder climates. This is mainly due to the local climate and the different grid efficiencies of the 4 countries considered. It is possible to observe that a higher increase in the carbon emissions for space cooling was obtained in climate 3A as the loss of thermal performance in IGU would increase the energy demand for cooling. The 4 countries considered have different grid emission factors, which determine a different conversion from delivered energy into operational carbon. Consequently, the same amount of delivered energy determines increasing operational carbon emissions moving from colder to hotter climates.
A different trend from that highlighted above can be observed for the Primary school, in which, except for climate 6A, the operational carbon relative to the IGU at year 20 is approximately the same as year 0. This can be explained considering that the building has high endogenous loads due to the presence of the students. Lower transmittance for the IGU results in a higher ability to dissipate heat in intermediate and hot seasons.
4.4. Results – life cycle assessment
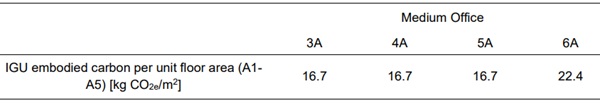
The LCA for medium office in the 4 climate zones was performed using the dynamic model accounting for change of glazing thermal performance over a time span of 50 years. The analysis considers both the operational carbon emissions of the building according to the IGU performance decay profile in Table T4 and the embodied carbon of the IGU for the phases from A1 to A5 (production and construction). Table T6 provides the embodied carbon values for the IGU for each climate and building type, calculated according to CWCT (2025). The glass considered for this study is a low carbon glass with a global warming potential ≃ 1.3 kg CO2e/(m2·mm) for the phases A1-A3. The embodied carbon values in Table 6 were considered in the LCA analysis both in the first year and in every subsequent year in which the glass was assumed to be replaced.
Table 6: Embodied carbon values (A1-A5) for the replacement of the IGU
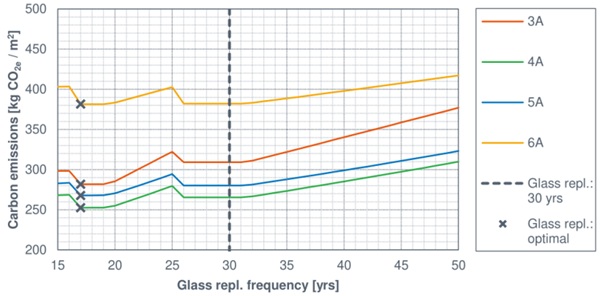
The life-time carbon per unit floor area for each climate zone is assessed with different glass replacement frequency and shown in figure 10. The dashed black line indicates the typical expected glass service life, i.e. 30 years, while the x-shaped black markers show the optimal glass replacement frequency for each climate, corresponding to minimum total carbon emissions over 50 years. It is possible to observe that the carbon emissions related to the glass replacement frequency show a similar trend for each climate zone at different slope. The optimal replacement frequency is, for all climates, 17 years for the modelled notional buildings. The optimal replacement frequency allows to replace the IGUs only twice over the course of 50 years whilst shortening the period when IGU with the significant loss of performance remain in service. The chart shows a drop in the life-time carbon with glass replacement interval of 17 years when significant loss of glazing performance is assumed. The life-time carbon values drop with a glass replacement interval of 26 years with only one glass replacement in the 50 year life span.
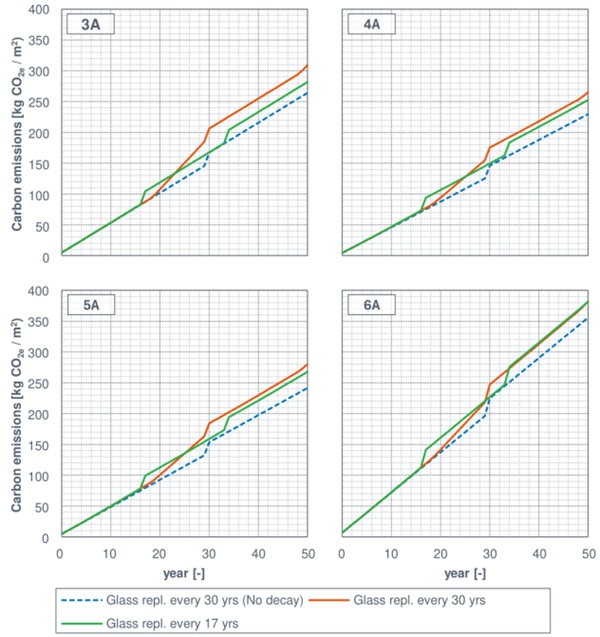
The life-time carbon with glass replacement interval of 17 and 30 is further investigated and is compared to the static assessment with 30 years glass replacement interval. Figure 11 shows the lifetime carbon over the 50 year time span for the medium office building type and for all the four climates considered comparing these 3 scenarios.
It is possible to observe that the trend is the same for all four climates, but the difference in carbon emissions, in dynamic modelling with glass replacement internal of 30 and 17 years, decreases moving towards colder climates. The limit case is represented by the climate 6A, for which the carbon emissions relative to the two replacement frequencies are comparable. This reduction is due partly to the climatic features of the different locations and partly to the grid carbon factor of each country (Finland shows the lower factor among the climates considered). The charts also show, considering a glass replacing frequency of 30 years, the difference made if the IGU performance decay is not considered in the dynamic simulation process. This difference is influenced in the same way as the previous results by the climate of the different locations and the country-specific grid carbon factors, and ranges between 16% and 17% for climates 3A, 4A and 5A, and decreased to 7.5% for climate 6A. The results highlight that ignoring the IGU performance change over the time may underestimate the actual carbon emission of buildings.
5. Summary
This paper establishes a methodology and a set of principles and metrics that can be used to further develop an effective carbon model for the future. Compiling real time data from field measurements is a key part of ensuring the future accuracy of such a model. Although the model developed for the paper is not directly connected to the project field study results it is clear how this connection can be strengthened through future development.
It has established the value of a) field testing as a condition survey for existing buildings and as part of the quality assurance procedures for new buildings and b) the need to further understand coating behaviour and c) driving high quality production and reliable IGU systems to ensure the very real expectations of net zero initiatives are met.
5.1. Conclusions
We reach the following conclusions:
- An on-site survey should be used to assess the thermal performance of façades.
- The performance decay of IGU’s has an impact on the total carbon emissions of a building.
- There is clearly a variance in the performance of IGU’s in service.
- Understanding failure modes is crucial for improving IGU longevity and energy efficiency.
- Regular on-site monitoring of gas content should form part of an intergrated quality assessment protocol for new and existing built environments.
- Gas concentration measurements should be recorded for each assembly during the manufacturing process.
- High performance coating technologies can be considered stable providing that they are protected in a gas tight and moisture free cavity.
- Dynamic carbon modelling will provide comparative assessments of the condition of existing building stock
- that IGU’s are designed to meet carbon payback strategies.
- A marking scheme on the spacer to give each IGU a unique digital identification (ID) related to production and installation records to aid (EU Commission, 2024).
- The findings reinforce the importance of quality control in IGU production and installation and the use of proven, existing and new technologies e.g. reactive thermoplastic spacer systems (Scherer & Davis, 2023).
- Current test protocols may need revision in light of more field test evidence in order to ensure effective life cycles closer to 50 years than the current assumption of 25 years.
5.2. Considerations for Future Work
- Long-term monitoring of IGU performance and central collation of data.
- Development of predictive leakage models.
- Investigating the correlation between cavity failure and emissivity degradation.
- Understanding the correlation between IGU size and failure.
- Correlating IGU failure and façade structure types.
- Cost-effective maintenance solutions to extend IGU service life.
References
Directive 2010/31/EU of the European parliament and of the (2010) - on the energy performance of buildings (recast)
LL 97, Greenhouse Gas Emissions Reduction, New York City Charter 308 (2024)
Procedures of Shanghai Municipality on the Administration of Glass Curtain Wall of Buildings, English.shanghai.gov.cn (2018)
Scherer, C., & Davis, C. (2023). Sustainable glass architecture through intelligent adhesive and sealant solutions, GPD 2023
Wolf, A.T. (1992). Studies into the life-expectancy of insulating glass units. Build. Environ, , 27, 305–319.
Wolf, A.T. & Waters L.J. (1993). Factors governing the life expectancy of dual-sealed insulating glass units, Constr. Build. Mater. 7, 101–107.
Hyviid, C.A., & Friis, N.K. (2025). T.U Denmark Service Life of Insulated Glass Units - Argumentation and suggestion for service life expectations beyond 25 years,
BS EN 1279-3 (2018). Glass in building. Insulating glass units - Long term test method and requirements for gas leakage rate and for gas concentration tolerances
Likins-White, M., Tenent R.C., & Zhai, Z. (2023). Degradation of Insulating Glass Units: Thermal Performance, Measurements and Energy Impacts, Buildings
Determination of the Long-Term Thermal Performance of Foam Insulation Materials through Heat and Slicing Acceleration – MDPI (2022) Minjung Bae 1, 2, Hosang Ahn, Jaesik Kang, Gyeongseok Choi and Hyunjung Choi, MDPI, Polymers 2022,
Laird, R.E. & Wolfe, J.D. (1994) The Evolution of Durable, Silver-Based, Low Emissivity Films Deposited by D.C. Magnetron Sputtering (ZnO to Si3N4), Society of Vacuum Coaters 37th Annual Technical Conference Proceedings, 505/856-7188
BS EN 673 (2024). Glass in building. Determination of thermal transmittance (U value). Calculation method
Aoki-Kramer, M. (d.n.). Re-glazing of an All Glass Tower. Best 4 Conference, Building Enclosure Science and Technology
Hubbs, B. & Higgins, J. (2015), Glazing Failures and Ways to Prevent Them, 30th RCI International Convention and Trade Show, 149 - 160
Glazing Recovery.org - Dedicated to transforming the fate of architectural glass
Sheikh, A.Y., Barker, B., Markkanen, S., and Devlin, A. (2023). Glass sector deep dive: How could demand drive low carbon innovation in the glass industry. Cambridge: Cambridge Institute for Sustainability Leadership (CISL)
IFT Rosenheim, Report 24-001973-PR01 (PB-H01-09-en-02. Measurement of gas concentration without determination of type of gas)
https://www.energycodes.gov/prototype-building-models
American Society of Heating, Refrigerating and Air-Conditioning Engineers, Inc (ASHRAE). (2022), Standard 90.1-2022 - Energy Standard for Sites and Buildings Except Low-Rise Residential Buildings. Atlanta (GA), United States of America.
American Society of Heating, Refrigerating and Air-Conditioning Engineers, Inc (ASHRAE). (2021), Standard 169-2021, Climatic Data for Building Design Standards. Atlanta (GA), United States of America.
Italian Republic. (2015), Inter-Ministerial Decree of 26 June 2015 - Applicazione delle Metodologie di Calcolo delle Prestazioni Energetiche e Definzione delle Prescrizioni e dei Requisiti Minimi Degli Edifici. Off. J. Ital. Repub. 162 (2015).
Great Britain, Ministry of Housing, Communities and Local Government. (2023), UK Government (2021) Approved Document L: Conservation of fuel and power, Volume 1: Dwellings, 2021 edition incorporating 2023 amendments. Stationery Office, Norwich.
Great Britain, Ministry of Housing, Communities and Local Government. (2023), Approved Document L, Conservation of fuel and power, Volume 2: Buildings other than dwellings, 2021 edition incorporating 2023 amendments. Stationery Office. Norwich.
Ladybug Tools. Available at: https://www.ladybug.tools/ (Last accessed: 28 February 2025).
Center for building and Cladding Technology (CWCT). (2022), How to calculate the embodied carbon of facades: A methodology Bath, United Kingdom..
EU Commission (30 October, 2024), CPR Conference - New Construction Products Regulation