Authors: Christopher Brokmann, Stefan Kolling & Jens Schneider
Source: Glass Structures & Engineering, volume 6
DOI: https://doi.org/10.1007/s40940-020-00134-6
Abstract
In the present work, subcritical crack growth in soda–lime silicate glass is investigated under different environmental conditions. Crack growth parameters as a function of temperature and humidity were determined by dynamic fatigue tests, which has been verified by using the in-situ method of filming crack growth during experiments. The specimens were pre-damaged for constant initial crack lengths in all specimens using the Vickers indentation test. The determined parameters were compared with those from literature in order to discuss existing deviations of sub-critical crack growth parameters in literature. These deviations may be caused by environmental conditions and different chemical compositions of the glass. Arrest lines were used to determine the ratio of crack width to crack depth in Vickers indented specimens. For the initial crack depth, images of fracture surfaces were taken using an scanning electron microscope. Furthermore, the influence of humidity and temperature on the failure stress of unindented specimens with a constant initial crack length was simulated.
Introduction
The strength of glasses has been studied and discussed in a number of publications and books, e.g. Haldimann et al. (2008), Wachtman et al. (2009), Quinn (2007) and Meyland et al. (2019). Test methods for strength are defined in national and international standards. The strength behavior of glass as a function of temperature and humidity is often considered only as a coarse approximation. For example, the European standard for determining the strength of glass by means of a coaxial ring-on-ring test specifies a relative humidity of 40–70% during experiments c.f. EN DIN 1288 (2000). Thereby it could already be shown that the environmental conditions have an enormous influence on the failure strength of glass, (Wiederhorn and Bolz 1970; Ronchetti et al. 2013).
The failure strength of glasses and other almost ideally brittle materials is dominated by micro flaws. These micro flaws are distributed randomly over the entire surface of the glass and grow sub-critically when an external stress is applied. Depending on the growth time and growth rate, sub-critical crack growth has a significant influence on the failure stress. Due to their different depth, these flaws cause a statistical distribution of the failure stresses which has not yet been adequately investigated, (Ballarini et al. 2016).
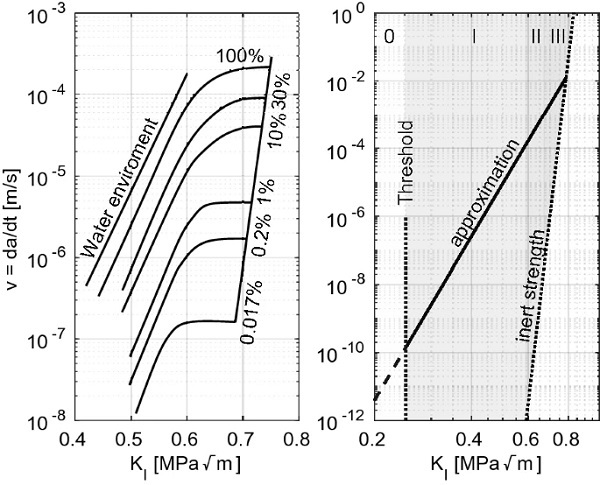
If the crack growth velocity is represented as a function of the stress intensity KI, it passes through four growth regions (Wiederhorn 1967). The crack growth takes place above region 0, in which no crack growth is assumed, (Kocer and Collins 2001). The crack growth is mainly driven by the humidity at the crack tip in combination with an external mechanical load. An overview of the phenomenon of sub-critical crack growth in glass is given in Ciccotti (2009). There, all processes observed to date for sub-critical crack growth are summarized and examined critically. Possible influencing factors are also discussed.
The different regions of crack growth in established failure models are often approached by a linear approximation (Haldimann et al. 2008; Overend and Zammit 2012; Alter et al. 2017; Kinsella and Persson 2018). This is particularly useful, since the crack grows only for a comparably short time in the last two growth regions and spends most of its growth in the first region, the linear region. Within this approximation, the crack velocity v can be expressed as a function of the stress intensity factor KI by

Evans and Johnson (1975) and Maugis (1985), where KIc is the critical stress intensity and the parameters nn and v₀ describe the sub-critical crack growth and the parameter A can be expressed as
![]()
In Haldimann (2006), Hilcken (2015) and Schula (2015) a detailed overview and discussion of existing values for crack growth parameters can be found. The present article will use the sub-critical crack growth formulation with the parameters n and v₀ from the first formulation in Eq. (1). There are also empirical approaches which directly consider the environmental conditions (Rodrigues et al. 2017), but which usually have too many parameters for the application which are difficult to determine. For the determination of the crack growth parameters according to Eq. (1) several methods are available in literature (Lawn et al. 1981; Fuller et al. 1983; Dwivedi and Green 1995; Wachtman et al. 2009), where artificially indented cracks are used in most cases. This has the advantage that the initial crack depth and the location of the crack are known. Another advantage is that there is a constant initial crack depth over all uniformly pre-damaged specimens. A disadvantage is that artificially created cracks may behave differently from natural cracks. This problem occurs particularly due to a plastic zone in the area of the intentation, which influences the determination of the growth parameters by induced residual stresses (Fuller et al. 1983). The crack growth parameters which can be found in the literature are subjected to some scattering which may be attributed to environmental conditions.
Currently, the influence of environmental conditions on the strength distribution of glass has not been fully investigated, although the influence on the strength is proven (Wiederhorn 1967). While a higher humidity, and thus more water molecules at the crack tip, leads to a higher growth rate, it could be shown that the strength of glass increases in hot water (Wiederhorn et al. 2013b). It could be shown that some coatings on the glass surface prevent the transport of water molecules to the crack tip and thus increasing the failure strength (Mariggiò et al. 2019). The processes at the crack tip and the results of observation at the crack tip by means of modern methods are summarized in Wiederhorn et al. (2013a). However, the behavior of the crack growth parameters n and v₀ from the linear approximation with respect to the environmental conditions for engineering applications has not yet been investigated.
In this article, samples are pre-damaged using Vickers indentation testing and then relieved of all residual stresses by heating and controlled cooling. Vickers indentation has become an established method for artificially induced cracks. Caution is nevertheless required, as the lateral cracks created do not always form in the geometry and depth under almost identical conditions, (Mikowski et al. 2006; Kiefer et al. 2020). During indentation, the glass undergoes plastic deformations, which can be divided into densification and shearflow, while both have different effects on the formation of lateral cracks (Kato et al. 2010). By using Vickers diamonds with different opening angles, (Gross 2012), and the numerical simulation of the indentation process, Jebahi et al. (2013) it could be shown that the glass mainly undergoes a densification underneath the indentation zone. Furthermore, the relation between Vickers hardness or critical stress intensity and crack resistance is not clearly recognizable (Kato et al. 2010).
In the present paper, crack growth parameters are determined from Eq. (1) at different temperatures and humidities using dynamic fatigue tests at different stress rates at an universal testing machine within a climate chamber. These parameters are validated by the method of “in-situ” observation of crack growth according to Dwivedi and Green (1995). The relation between crack growth parameters and environmental conditions is shown experimentally. Finally, the influence of humidity on failure strength at known crack depths is calculated numerically.
Basics on subcritical crack growth
The subcritical crack growth undergoes four regions, which can be expressed by a linear approximation according to Eq. (1). The original measurements of all four areas shows a clear humidity dependent behavior (Wiederhorn 1967), shown in Fig. 1.
The dependence of sub-critical crack growth on temperature has already been shown by Wiederhorn and Bolz (1970). For the often used linear approximation this has not been investigated yet. The crack growth parameter n can be determined by dynamic fatigue tests with constant stress rate σ˙ and identical initial crack lengths with the failure stress σf by the relationship
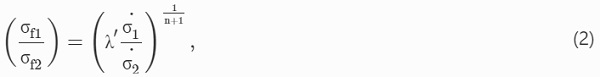
see Maugis (1985), where 1/(n+1) give the slope and λ′ the intercept in a double logarithmic failure stress vs stress rate plot. The advantage is, that the crack growth parameter n can be directly determined by the slope in a double-logarithmic representation of the failure stresses via the stress rates. The condition is that the initial crack lengths of all samples are identical. If there are no residual stresses in the test specimen, the crack growth parameter v₀ can be determined by
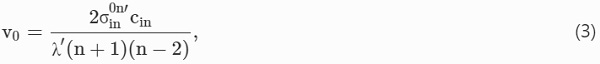
see Fuller et al. (1983), with
![]()
as the inert strength and cᵢₙ as the indentation crack size including growth during aging. The inert strength is given when there is no sub-critical crack growth before failure. It should be noted that Eq. (3) is only valid if the critical crack length cf is greater than the initial crack length cᵢ. The necessary condition is that
![]()
has to be fulfilled (Wachtman et al. 2009). This is particularly important for experiments with low ambient humidity. In very dry conditions, the initial crack is not subjected to significant growth. The result is, that this condition can not be fulfilled for certain environments. A detailed derivation of the solution to determine sub-critical crack growth parameters has already been made in Lawn et al. (1981), Fuller et al. (1983) and Wachtman et al. (2009).
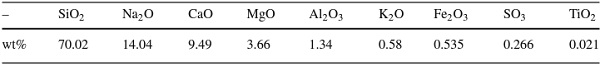
Table 1 Chemical composition of the considered SLS float glass - Full size table
Experimental part
The experimental part is divided into dynamic fatigue tests at different temperatures and humidities to determine the crack growth parameters n and v₀. To validate the obtained values, crack growth was observed “in-situ” under constant load at two different air humidities using a light microscope to observe the growth during four-point bending tests.
Specimen preparation
The tested glass is soda lime silicate float glass. The chemical composition was determined by inductively coupled plasma optical emission spectrometry. The results are shown in Table 1. Glass plates with the dimension of 1480×1000×1.8 mm were cut into circular samples with a diameter of 80 mm and rectangular samples of 220×34×1.8 mm.
The obtained specimens were pre-damaged using Vickers indentation test with a indentation force of 9.8 N and a holding time of 3 s to obtain nearly identical crack systems in all specimens. Special care was taken to ensure that all samples were indented with the same force and holding time, as the indentation in glass is rate-dependent (Limbach et al. 2014). All indentations were examined for symmetry of the cracks. Samples that did not develop four cracks perpendicular to each other were rejected. A total of approximately 470 samples were prepared for dynamic fatigue tests, of which 390 could be tested.
After the indentation, the samples were stored for at least 24 h in room climate before they were heated to 520 °C in a tempering furnace. Cooling down to room temperature was performed with a maximum of 2 K min⁻¹ to remove the residual stresses of both the glass and the densification zone. An explanation of heating influence on glass material properties can be found in Aronen and Karvinen (2018). The absence of residual stresses was verified by a scattered light polariscope. Although the influence of the cooling rate on density, hardness and Young’s modulus is known from Ito and Taniguchi (2004), it was classified as negligible in this work since the dependency on the environmental conditions of glass with identical properties will be investigated. The influence of residual stresses generated by Vickers indentation is known. Indented specimens obtained 47.6 MPa in Anunmana et al. (2009), while specimens tempered after indentation reached a failure stress of 64.7 MPa.
In-situ crack growth observation
The method of “in-situ” observation of sub-critical crack growth is used to validate the results obtained from dynamic fatigue tests. The direct observation of cracks and their growth at constant load is already shown in Dwivedi and Green (1995), together with a comparison of the “in-situ” crack growth parameters to those determined at dynamic fatigue experiments.
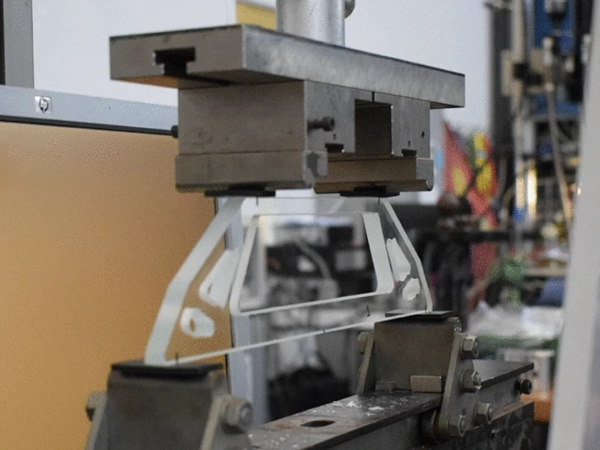
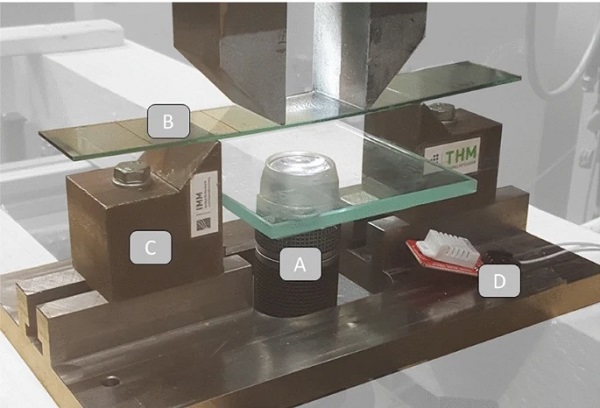
In contrast, the specimens in this publication are heat-treated after indentation in order to remove any residual stresses caused by the indentation. Several tests are performed at a temperature of T = 25°C and a relative humidity of H = 40 and 50%. A validation of all temperature and humidity combinations is unfortunately not possible due to the setup for the “in-situ” observation device. For the four-point bending test, the distance between the supporting fins is 155 mm and the distance between the load fins is 74 mm. The test setup is shown in Fig. 2.
In order to assign a geometry factor and stress intensity to each measured crack length, so-called “arrest lines” are generated. These are created by stopping and restarting the crack growth, (Fréchette 1990). These can be used to determine the ratio of the crack depth to the observed crack length. This is important because the observation of sub-critical crack growth by the “in-situ” device can only measure the crack width and not the crack depth. The crack width to crack depth ratio can also be used to check if the condition according to Eq. (4) for each dynamic fatigue test is fulfilled.
Dynamic fatigue experiments
In order to determine the crack growth parameters as a function of the environmental conditions, dynamic fatigue tests are performed at several constant stress rates at constant temperature and humidity. Tests are performed at 15, 25 and 35 °C. The humidity is constantly regulated for each temperature at 30, 40, 50, 60 and 70% relative humidity. For each temperature with associated humidity, the stress rates σ˙=0.6, 2, 6 and 20 MPas⁻¹ are performed with six tests per stress rate. The consideration of even lower stress rates was rejected due to the large amount of experiments. For the dynamic fatigue tests coaxial ring-on-ring tests are performed with an inner ring radius of 6 mm and a support ring radius of 15 mm. A finite element simulation was carried out to validate if a pure biaxial plane stress field is present with these coaxial ring-on-ring dimensions.
In order to determine the inert strength
![]()
and associated initial crack length cᵢₙ from Eq. (3), 20 specimens are sealed with silicone oil to prevent sub-critical crack growth by water at the crack tip during the tests. The specimens are then tested in coaxial ring-on-ring tests with a stress rate for the initial strength
![]()
of 450 MPas⁻¹.
All experiments were carried out in a climate chamber to ensure constant environmental conditions. Humidity and temperature were measure within a distance of 10 mm to the glass tests surface in order to minimize some influence of air circulation within the climate chamber.
Results and discussion
First, the ratio of crack width to crack depth is shown, which was determined via the generated arrest lines. This ratio is used to determine the crack growth parameters of the in-situ tests, to validate the parameters of the corresponding dynamic fatigue tests.
The crack growth parameters of the dynamic fatigue tests at different temperatures and humidities are then compared for their relationship to each other. Finally, the influence of humidity and temperature on the failure stress at varying initial crack depths is simulated.
Crack shape evolution in subcritical crack growth
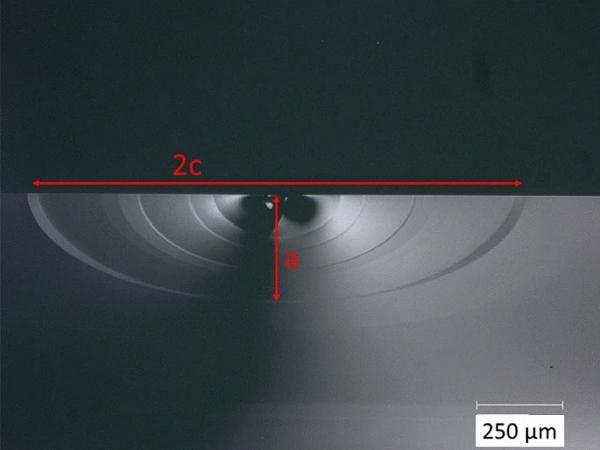
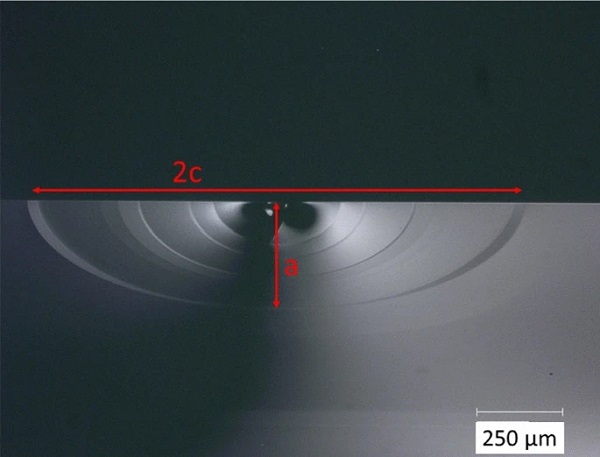
In order to draw conclusions about the crack depth from the crack width during in-situ observation, so-called “arrest lines” were generated. An example of the generated arrest-lines is shown in Fig. 3. Crack arrest is a sharp line on the fracture surface defining the crack front shape of an arrested, or momentarily-hesitated crack. Resumed crack propagation occurs under a more or less altered stress configuration (Quinn 2007) on the basis of Fréchette (1990).
The ratio of the crack depth to the crack length is shown in Fig. 4. The width to depth ratio is fitted by an 2nd order polynomial. Also the ratio determined by Dwivedi and Green (1995) is shown in comparison. The variation of both measurements could be explained due to the fact that the samples in this publication were first damaged and then heat-treated. This could lead to a different growth ratio due to the absence of residual stresses in the indentation area. Furthermore, the environmental conditions during the tests for determining the geometry correction factory in Dwivedi and Green (1995) is not given. A different humidity at the crack tip could lead to different ratios of crack depth to crack width. This should be topic of future investigations.
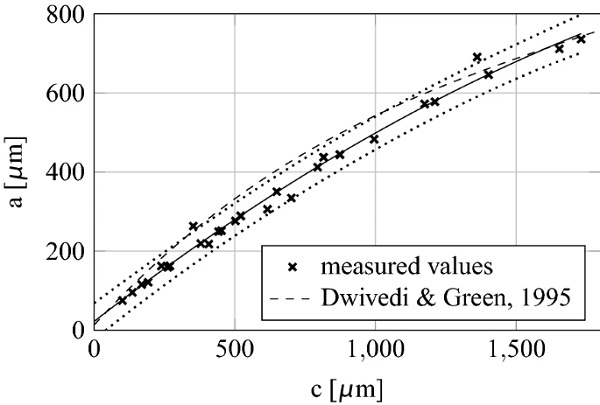
The geometry correction factor Y can be determined by the solution of Newman and Raju (1981) and the ratio of crack width to crack depth by
![]()
with a in millimeter. Using this correlation, the stress intensity KIKI can be calculated for each determined crack width under constant applied stress and microscopically filmed crack growth. To determine the crack velocity as the ratio of the grown crack between two images, the arithmetic mean of the stress intensity from both measured crack lengths is taken.
The geometry correction factor as a function of the crack depth according to Eq. (5) can also be used to check if the condition in Eq. (4) is fulfilled for each experiment. With known geometry correction factor, failure stress σf and the critical stress intensity KIc the critical crack depth af can be calculated. The inert strength of the indented specimen was determined as the arithmetic mean of 20 samples of
![]()
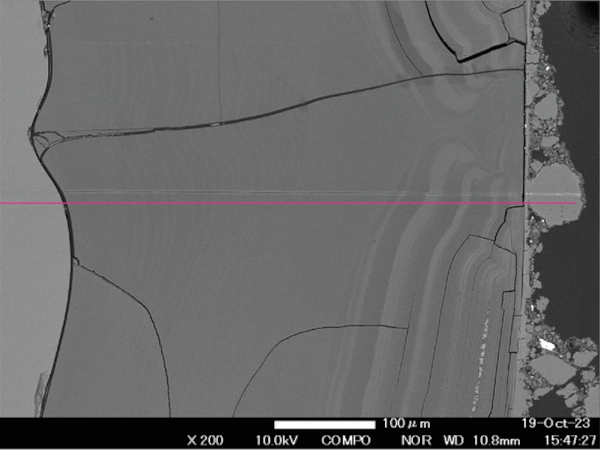
with a standard deviation of s = 2.24 MPa due to coaxial ring-on-ring tests with a stress rate of 450 MPas⁻¹. For the initial crack depth, the fracture surfaces cᵢₙ of the inert strength specimens were examined using a scanning electron microscope. One fracture surface is shown in Fig. 5. The initial crack depth could be determined from these images to aᵢₙ = 54.86 μm. Analogously, the inert crack depth can be calculated with the critical stress intensity KIc=0.75 MPa√m and the geometry correction factor Y=0.72 to aᵢₙ = 53.14 μm. Since the geometry factor for the calculated crack depth is derived from the extrapolation of Eq. (5), the measured initial crack depth is used for further calculation.
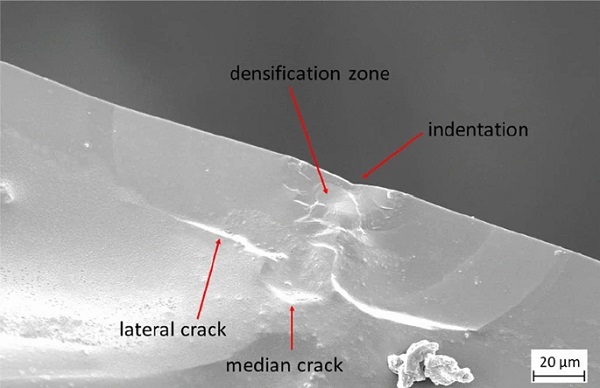
Previous studies have shown that the Vickers indentation creates a half-penny shape crack (Cook and Pharr 1990; Lawn 1993). However, this was done at an indentation force of 90N and no information was given on the existing residual stresses before indentation in Lawn (1993). Sglavo and Green (1995) showed, that at a indentation force of 9.8 N with no residual stress before indentation, no half-penny shape crack system is observable. It is assumed that the median crack and the lateral cracks connect to a half-penny shape crack system at higher indentation loads. It could also be shown in Cook and Pharr (1990), that below 10 N indentation load, no radial cracks are observable. These findings are in accordance with Fig. 5.
In-situ crack growth observation
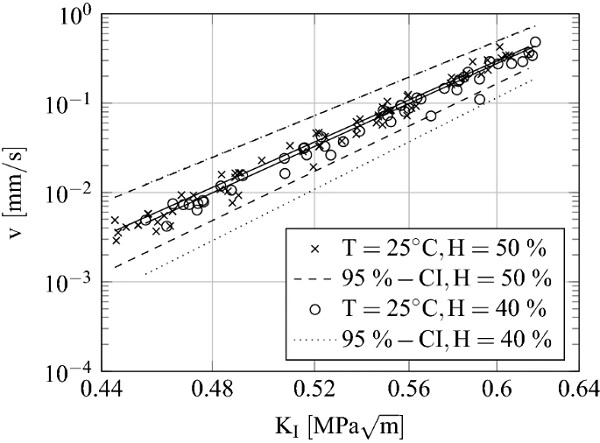
The measured sub-critical crack growth velocities and the calculated associated stress intensities for T = 25°C and 40 and 50% relative humidity using in-situ tests are presented in Fig. 6. The crack growth parameters were determined for H = 40% with n = 14.92[13.33;16.5] and v₀ = 7.07 mm/s [4.569; 9.571] with R² = 0.95 using Eq. (1). The parameters for H = 50% were determined analogously to n = 14.61[13.43;15.79] and v₀ = 7.83 mm/s [5.587; 9.892] with R² = 0.96. The values in brackets belong to the 95% confidence interval.
Dynamic fatigue experiments
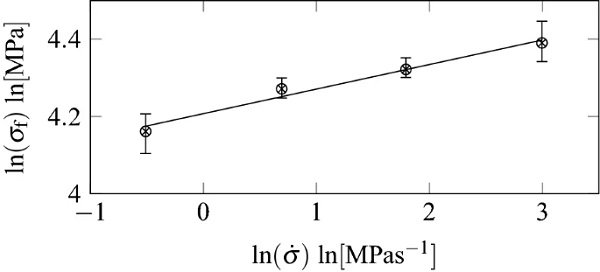
The crack growth parameters as a function of temperature and humidity were determined from the dynamic fatigue experiments using Eqs. (2) and (3). An example for the failure stress σfσf vs stress rate σ˙ curves can be seen in Fig. 7 for T = 25°C and H = 50%. All determined crack growth parameters are shown in Fig. 8 and Table 2.
For T = 15°C and a relative humidity of H = 40 and 50% no crack growth parameters could be determined. The reason for this is that condition in Eq. (4) was not fulfilled often enough for some stress rates. This was especially the case for a stress rate of σ˙ = 20 MPas⁻¹ and σ˙ = 6 MPas⁻¹. Accordingly, there was no sufficient sub-critical crack growth for the applied linear approximation.
The values shown in Fig. 8 indicate, as expected, increasing crack growth with increasing temperature and humidity, since with increasing temperature also a higher reactivity of the water molecules at the crack tip is present and thus an accelerated reaction with the Si–O–Si molecule chains of the glass can take place. In order to make a general statement about the influence of the environmental condition on the crack growth parameters, the parameters were fitted as a function of humidity. The crack growth parameter n as a function of the relative humidity H could be fitted by a 2nd order polynomial to
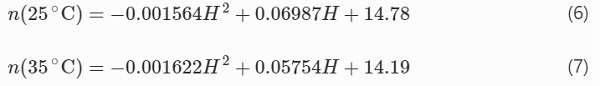
with a coefficient of determination of R² = 0.96 and R² = 0.97. The relationship between the crack growth parameter v₀ and the relative humidity can be expressed by
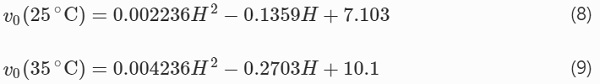
with a coefficient of determination of R² = 0.97 and R² = 0.99. For T = 15°C a fit was omitted due to only three existing values. With a general comparison of the measured values from 15 to 35 °C a comparable run of the curve with increasing humidity can be observed between temperature and humidity. The polynomials are intended to show the general behavior of the crack growth parameters as a function of the environmental conditions.
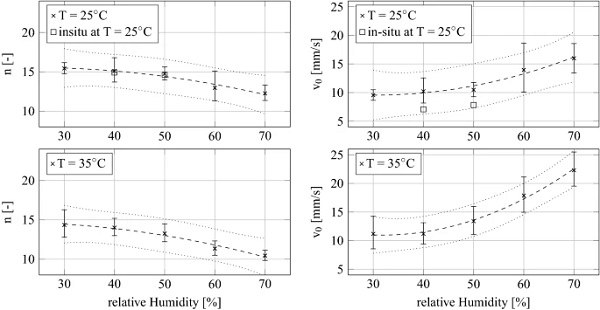
Table 2 Results for crack growth parameters of dynamic fatigue and in-situ tests in dependence of the environmental conditions - Full size table
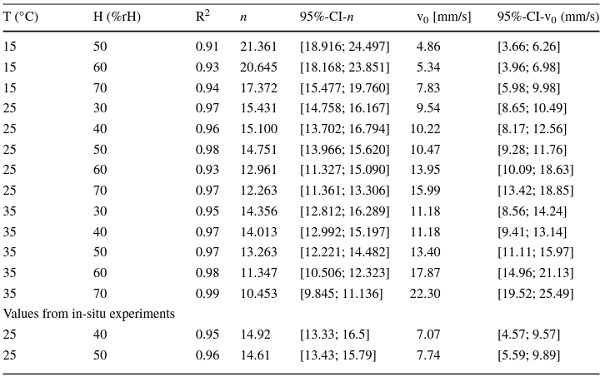
The crack growth parameter n for T = 25°C at H = 40 and 50% from the in-situ observation agree with the values from the dynamic fatigue tests. The values for v₀ from the in-situ device are smaller then the values from dynamic fatigue tests. In Dwivedi and Green (1995), the parameter v₀ was also slightly lower then the values from dynamic fatigue tests. In general, the measured crack growth parameters from Dwivedi and Green (1995) are lower than the values determined in this article.
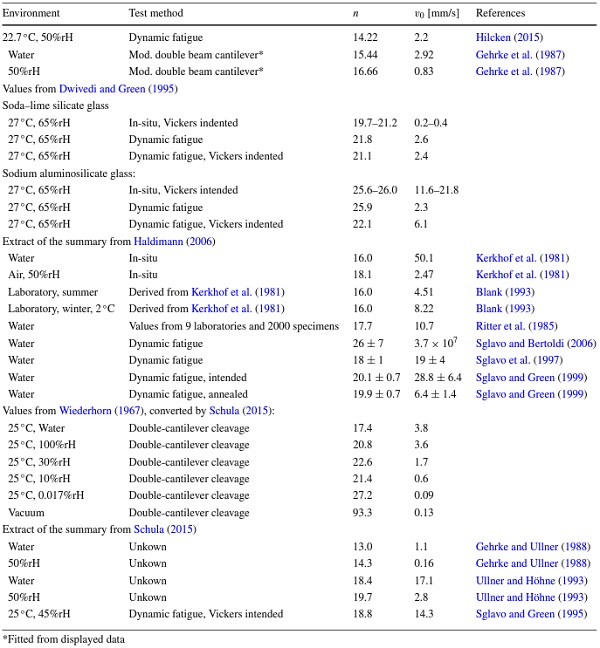
Comparing the values of the present work with the literature values summarized in the appendix Table A1, it can be seen that the values determined here for the parameter n are in good agreement with those from the literature.
The crack growth parameter v₀ is often higher than values commonly found in the literature, yet in a realistic range. The values for v₀ in Blank (1993) ranges between 4.51 mm/s for summer and 8.22 mm/s for winter conditions. The subcritical crack growth parameters found in the literature range up to 14.3 mm/s at 45%rH in Sglavo and Green (1995). In Dwivedi and Green (1995), the comparison of soda–lime silicate and sodium aluminosilicate glasses shows, that the crack growth parameter v₀ changes from a maximum of 2.6 mm/s for soda–lime silicate glass (SiO₂ = 72.3%wt) to 21.8 mm/s for sodium aluminosilicate glass (SiO₂ = 62.3%wt). This fact supports the assumption that the chemical composition plays an important role in subcritical crack growth.
In comparison to Dwivedi and Green (1995) it can be seen that the chemical composition of the glass shown in Table 1 is different. There are also differences in the inert strength of the samples compared to Dwivedi and Green (1995) of 15 MPa. This is probably due to the fact that the residual stress field was eliminated by tempering after the Vickers indentation test (Anunmana et al. 2009).
Since soda–lime silicate glass or glass generally exists in various chemical compositions, the chemical composition should always be shown when determining crack growth parameters. The exact influence of the chemical components on the subcritical crack growth has not been investigated according to the current knowledge of the authors.
Simulation of environmental influence on failure
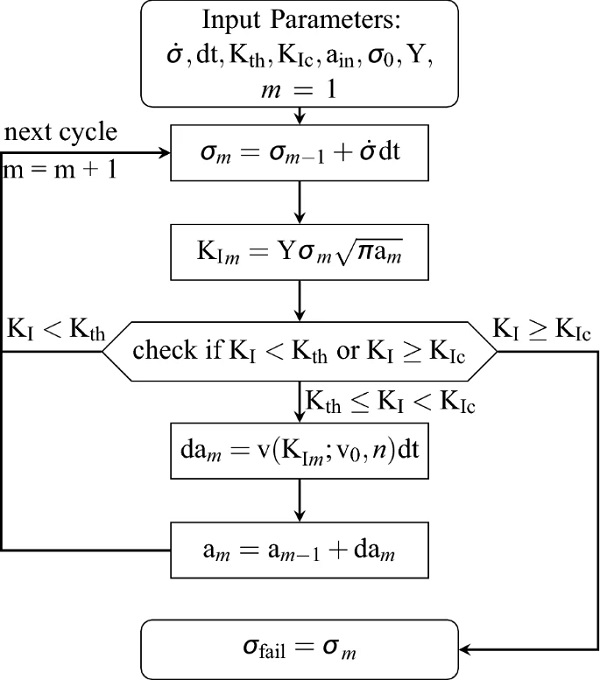
In order to demonstrate the influence of humidity on the failure strength of glass, the growth of cracks of initial depths aᵢ = 1, 10 and 100 μm were simulated numerically using MatLab. This was done for a temperature of T = 25°C and relative humidity of 30, 50 and 70%, respectively. A flowchart of the algorithm is shown in Fig. 9. As initial values, the stress rate σ˙, the time step dt, the crack growth threshold Kth, the critical stress intensity KIc, an initial crack depth aᵢₙ, the initial stress σ₀ and the geometry correction factor Y for the stress intensity formulation are set.
Table 3 Influence of humidity on numerical failure stresses at different initial crack depths at T = 25°C - Full size table
We consider a constant stress rate of σ˙=2 MPas⁻¹ and a constant time step of dt=0.01 ms. This small time step was chosen because with higher time steps, care must be taken that KIc is not significantly exceeded. The threshold limit below which no sub-critical crack growth occurs was assumed to be Kth=0.25 MPa√m, the critical stress intensity to KIc=0.75 MPa√m. The geometry correction factor Y, to the present state of knowledge of the authors unknown for natural flaws, was set to the constant value Y=1 for the input at the first time step in cycle m=0.
A biaxial plane stress field during a coaxial ring-on-ring test was assumed, so that the crack orientation can be neglected. The specimen radius was set to 40 mm, the radius of the support ring to 15 mm and of the load ring to 6 mm. The thickness of the glass is set to 1.8 mm, the Poisson’s ratio was assumed to be 0.23.
During the simulation, the applied stress is first updated at the current time step in the current cycle m. Then the stress intensity KIm is calculated to check whether crack growth is present or the critical stress intensity has already been reached. Finally, the crack growth velocity according to Eq. (1) is calculated. With the crack velocity and the time step, the crack growth in the current time step daₘ is added to the existing crack depth aₘ₋₁ for the updated crack depth aₘ.
Table 3 shows the resulting numerical failure stresses as a function of the initial crack depths and environmental conditions. It can be seen that the failure stress at a humidity difference of H = Δ40% differs up to 17.92%. This shows that the permitted difference in environmental conditions in e.g. the European standard are to high and when comparing strength distributions, the environmental conditions during the experiments must always be included.
Conclusions
- It could be shown that the temperature and humidity dependence of the subcritical crack growth parameters n and v₀ of the linear approximation by Maugis (1985) exists as expected. At a humidity above 50% the crack growth rate for all three investigated temperatures increased more than in the area before 50%. The parameter v₀ determined here is generally higher than the values available in the literature. A possible explanation could be that often Vickers indented specimens are used with residual stresses due to indentation. This is contradicted by the fact that Dwivedi and Green (1995) has taken this into account and also obtained lower values for v₀. The parameter n is in the range of the literature values. It has been shown that the crack growth parameters as a function of humidity can be represented by a 2nd order polynomial.
- By simulating double ring bending tests with the determined crack growth parameters it could be shown that at e.g. 25 °C the failure stress at constant initial crack length varies by up to 18% in the range of 30–70% relative humidity for initial cracks of 1, 10 and 100 μm. This effect increases with variations in temperature. A possible future study could investigate a shift for the strength distributions of glass as a function of environmental conditions, as it already exists for size effects.
- When comparing the determined sub-critical crack growth parameters with literature values, it is noticeable that some scatters of the literature values can be traced back to scatter of ambient conditions. Nevertheless, unexplainable variations in literature values of the sub-critical crack growth parameters remain. These may be possible due to the chemical composition of the glass. The crack growth parameters from Dwivedi and Green (1995) were compared with those determined here, who also examined soda–lime silicate glass. The chemical composition of both publication differs slightly.
- Arrest-lines were used to determine the ratio of crack width to crack depth in Vickers indented glass specimen. This differs slightly from the values available in the literature. This may be due to the tempering after indentation of the specimens within the scope of this publication. Scanning electron microscope images of the Vickers indentation fracture surface were also shown, to validate crack depth and crack width in the initial stadium after Vickers indentation and tempering.
References
Acknowledgements
The presented work is based on results of the research project named 18295N “Stochastisches Bruchverhalten von Glas” which has been funded by the AiF within the programme for sponsorship by Industrial Joint Research (IGF) of the German Federal Ministry of Economic Affairs and Energy based on an enactment of the German Parliament. The research project was carried out in co-operation with Forschungsvereinigung Automobiltechnik e.V.—FAT.
The authors would also like to thank P. Paulus from Pilkington for providing the glass samples.
Funding
Open Access funding provided by Projekt DEAL.
Author information
Authors and Affiliations
- Institute of Mechanics and Materials, Technische Hochschule Mittelhessen, Wiesenstrasse 14, 35390, Giessen, Germany - Christopher Brokmann & Stefan Kolling
- Institute for Structural Mechanics and Design, Technical University of Darmstadt, Franziska-Braun-Straße 3, 64287, Darmstadt, Germany - Jens Schneider
Corresponding author
Correspondence to Christopher Brokmann.
Ethics declarations
Conflict of interest
The authors declare that they have no conflict of interest.
Appendix
Appendix
Table 4 Literature review of subcritical crack growth parameters for SLS float glass - Full size table