Authors: Xiufen Wang, Bo Zhong, Jie Tang, Chen Gao and Mei Li
Source: Sustainability 2023, 15(12), 9325; MDPI
DOI: https://doi.org/10.3390/su15129325
(This article belongs to the Special Issue Disaster Resilience and Sustainability of Structures and Infrastructures)
Abstract
As the most commonly used exterior-protecting components for buildings, window glass, due to its typical brittle characteristics, is more prone to break under the action of blast loads and produce high-speed flying fragments, which can pose a great threat to personal safety. This paper studies the influence of the size of window glasses on their failure characteristics. A simplified numerical simulation-based method for evaluating the P–I (pressure–impulsive) curve of window glass failure under blast loads is proposed. The influences of the length–width ratio, the area, and the thickness of the P–I curves of window glasses are systematically investigated. It was found that smaller a length–width ratio, smaller area, and thicker panel could increase the blast resistance of the window glasses. The empirical prediction formulae for the P–I curves of window glasses with different geometrical dimensions are established, and the validity of the proposed empirical formula is verified.
1. Introduction
Window glass is widely used in modern buildings because of its good visibility and decorative beauty. However, glass is a kind of brittle material and easily produces flying glass fragments, resulting in casualties. In addition, a blast wave can enter a room, directly causing casualties and property damage. In the last decade, terrorist attacks have increased all over the world and have caused great damage to building structures and harmed people. For example, on 19 April 1995, terrorists attacked a federal building in the US state of Oklahoma. The explosion killed 168 people and injured 680. According to the investigation report, the flying glass fragments accounted for nearly 75% of the injuries. Accidental explosions also have been occurred frequently in recent years. On 12 August 2015, a major fire and explosion took place at the Tianjin harbour killed 165 people and injured 798, for which the glass fragments were the main cause of injury.
A large number of experimental studies, theoretical analyses, and numerical simulations have been conducted on the dynamic responses and failures of window glasses during blasts. Chandraskharappa et al. [1] and Teng et al. [2] used the Von Karman nonlinear plate and shell theory and the perturbation method to solve the dynamic responses of elastic panels with high deflection under blast loading, and a theoretical solution of the dynamic response of ordinary glass panels under blast loading was provided. Based on the large deflection theory, Birman et al. [3] and Turkmen et al. [4] established dynamic equations with the Galerkin method and solved them with the Runge–Kutta method to study the dynamic response of laminated glass plates during explosions.
Chen et al. [5,6] theoretically derived the impulse and overpressure asymptotes of the P–I curves of float and laminated glass under an explosion load by combining the single-degree-of-freedom and energy methods. Field explosion tests are a necessary and effective method to study the dynamic properties of window glass during blasts. Ge et al. [7,8] conducted tests on the failure of float glass under a blast load and obtained the projection velocities of glass fragments under different explosive equivalents. Meanwhile, the glass fragments under different explosive loads were collected and counted to obtain their distance distribution values. Pan et al. [9,10] performed blast tests on float glass and verified the safe distances of frame-supported glass based on the impulses and peak overpressures.
Robert et al. [11] conducted filed tests on float glass under long-duration blast loads and studied the effects of glass thickness, area, aspect ratio, and boundary support conditions on their dynamic responses. The results show that, compared with elastic boundary conditions, rigid boundary conditions lead to local stress concentration, resulting in more obvious cracks and smaller fragments. For laminated glass, Kanzer et al. [12], Hooper et al. [13], Zhang et al. [14], and Le et al. [15] conducted a series of field explosion tests to study the dynamic responses of laminated glass. They concluded that, by increasing the thickness of a glass panel and the number of layers of glass, the resistance of the laminated glass to the blast could be effectively improved.
With the development of computer technologies, numerical simulation methods have gradually become an important method in the study of the blast-resistance behavior of window glass. In a numerical study, an appropriate constitutive model of glass is very important. Cronin et al. [16] introduced the JH-2 constitutive model for float glass and demonstrated the reliability of this constitutive model used in hydrodynamics software LS-DYNA. Zhang et al. [17,18,19] improved the JH-2 model (*MAT_ JOHSON_ HOLMQUIST_ CERAMICS model) and conducted a series of numerical simulations on the dynamic responses of the laminated glass under blast loading to establish its overpressure–impulse (P–I) relations.
Parametric studies were also conducted to further consider the influence of glass size, PVB (polyvinyl butyral) thickness, glass thickness, and the boundary conditions on the P–I curves. Ge et al. [20] used LS-DYNA to numerically study the influence of the duration of and overpressure on glass failure and found that the middle span displacement and maximum principal stress increased as the duration increased. Zhou et al. [21] performed a series of simulations to propose a new failure criterion for float glass under blast loads. The rationality of the proposed damage criterion was verified by comparing them to those in FEMA 426 [22]. It should be noted in most numerical studies that crack development was realized by eroding the damaged elements.
However, this method did not reflect the real-crack developing law and can lead to the energy imbalance of the system. Wang et al. [23], Liu et al. [24], and Shi et al. [25] studied the crack development and fragments of glass by using the node separation method, which can provide a better simulating result about flying fragments by comparing it to the testing results. However, the threshold value for nodal separation is difficult to determine. In summary, the scholars conducted extensive studies on the failure and fragments of many kinds of window glasses; however, few studies focus on the size effect of the glass, especially for the influence of the ratio of the length to the width. The different-sized glass may have different failure modes and different damage thresholds. This paper investigates the influences of the geometrical factors of glass on its failure properties and P–I curves.
2. Establishment and Verification of Numerical Model for Window Glass under Blast Loading
2.1. Numerical Model for Window Glass
2.1.1. Glass Material Model
The Johnson–Holmquist (JH-2) model has been widely used as a mechanical model for brittle materials, such as concrete, ceramics, glass, and rock, under high pressures, strains, and strain rates. In this study, the model was used to simulate the dynamic responses of glass under blast loading. The normalized equivalent stress (𝜎*) of this material depended on the normalized undamaged equivalent stress (𝜎𝑖*), the normalized fracture stress (𝜎𝑓*), and the material damage 𝐷, all of which were normalized by dividing by the stress at the Hugoniot elastic limit (HEL). The equivalent stress is shown in Equation (1):
![]()
The normalized intact stress means that no damage occurs to the material
![]()
The normalized fracture strength means that the material is completely damaged
![]()
where A, B, C, M, and N are the material constants obtained from the material tests. The normalized pressure 𝑃∗=𝑃/𝑃𝐻𝐸𝐿, 𝑃 is the actual pressure; 𝑃𝐻𝐸𝐿 is the pressure at HEL. The normalized maximum tensile hydrostatic pressure 𝑇∗=𝑇/𝑇𝐻𝐸𝐿, 𝑇 is the maximum tensile hydrostatic pressure or the tensile strength of the material. 𝜀˙ is the actual strain rate; 𝜀˙₀ is the reference strain rate (𝜀˙=1.0 𝑠⁻¹).
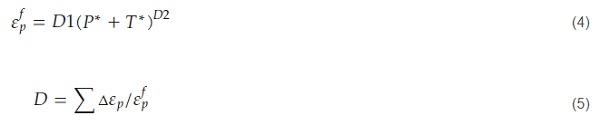
The damage factor 𝐷 is the ratio of the cumulative plastic strain integral ∑Δ𝜀𝑝 to the plastic strain at fracture 𝜀𝑓𝑝.
The expression for the hydrostatic pressure of the material is shown in Equation (6) and the expression for the tensile pressure, i.e., negative pressure, is shown in Equation (7), where K₁, K₂, and K₃ are material constants:
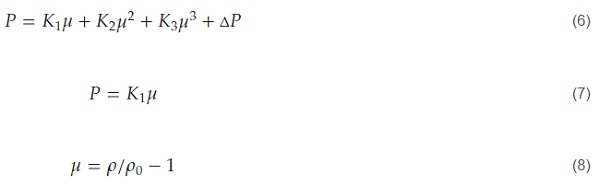
where μ presents the volumetric change in the material, as shown in Equation (8). In Equation (8), 𝜌 and 𝜌0 are the material density during deformation and the initial material density, respectively. Δ𝑃 is the increment of the pressure when bulking tends to begin.
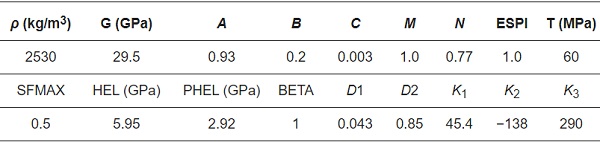
According to the study of Johnson et al. [26] and Hidallana et al. [27], the parameters of the JH-2 glass material model are shown in Table 1.
Table 1. Material parameters for input card of JH-2 model in LS-DYNA [26,27].
In order to simulate the physical phenomenon of glass failure under blast loading, the *MAT_ADD_EROSION command was used to erode the damaged elements in the simulation. For brittle materials, such as glass, the first principal stress (𝜎11) was usually used as an erosion criterion [27]. The element was deleted if 𝜎11 exceeded the dynamic fracture strength of the glass (𝑇𝑏). Under blast loading, Cormie et al. [28] proposed that the glass was considered to fail when the maximum principal stress exceeded 80 MPa. Therefore, in this study, the glass element was removed if 𝜎11>𝑇𝑏 (Tb = 80 MPa).
2.1.2. Structural Sealant Material
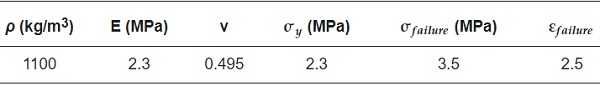
Generally, rubber materials are used as sealants to fix glass on a window frame. Hidallana et al. [27] regarded these materials as elastoplastic under blast loading and used the *MAT_24 material model in LS-DYNA to simulate their responses. The stress–strain curve of the sealant was given by defining the elastic modulus, yield stress, stress at break, and strain at break. The specific parameters are shown in Table 2. The von Mises stress 𝜎𝑣 of the material was used as the erosion parameter [26]. In this study, when 𝜎𝑣>𝜎𝑓𝑎𝑖𝑙𝑢𝑟𝑒, then the structural sealant was considered to fail.
Table 2. Material parameters of sealing structural adhesive.
2.1.3. Blast Load
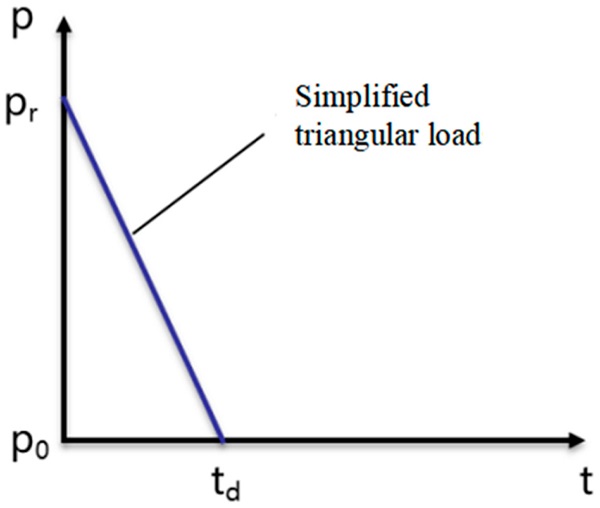
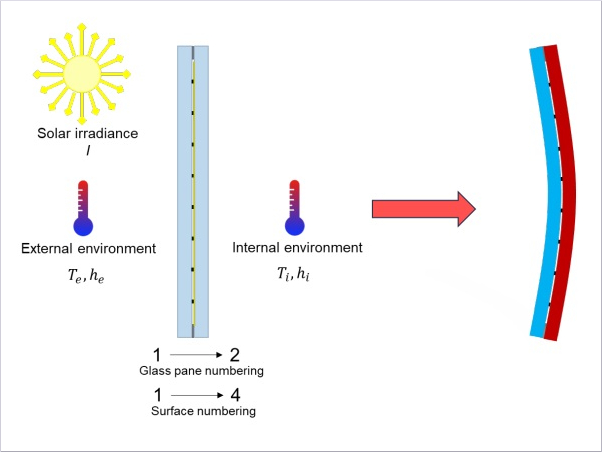
An explosion is the process of a high amount of energy being released in a very short time, creating a shock wave with high pressure, and expanding rapidly in the air. Figure 1 shows a typical pressure–time history of a blast.
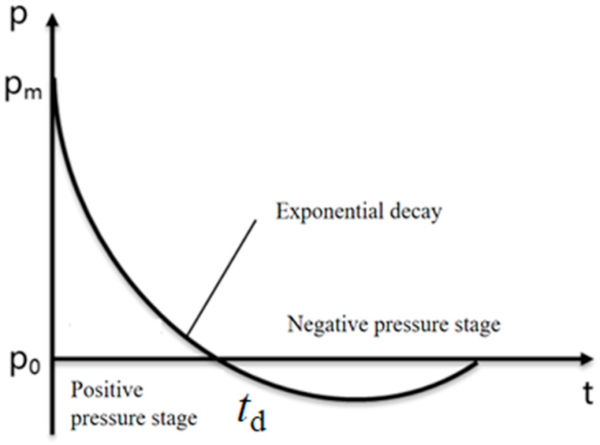
After the detonation of the explosive, the pressure rapidly reached the positive phase pressure peak 𝑃𝑚 and decreased to the initial atmospheric pressure 𝑃0 over a short time 𝑡𝑑. Then, a negative pressure followed, the duration of which was longer than the positive phase. It should be noted that the negative peak pressure was much lower than the positive one; therefore, in the design of the structure, the influence of the negative pressure on the structure was often negligible. Therefore, in this study, the blast loads were idealized to a triangular pressure–time load with zero rise time as shown in Figure 2 and uniformly acted on the front surface of the window glass. The overpressure P and impulse I are calculated by Equation (9):
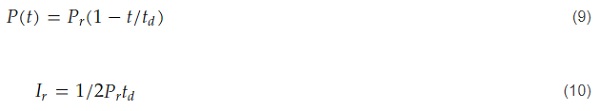
where 𝑃𝑟 is the peak value of the reflection overpressure, 𝑡𝑑 is the reaction time of reflected overpressure, and 𝐼𝑟 is the reflected impulse. The reflected positive pulse 𝐼𝑟 and reflected positive overpressure peak 𝑃𝑟 acting on the surface of the structural member were related to the weight of the explosive, the type of explosive, and the distance between the structural member and the explosive.
2.1.4. Finite-Element Model of Window Glass
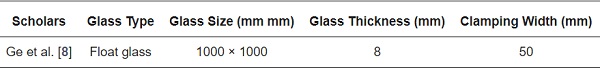
Glass and structural sealant are made of 8-node reduced-integration solid elements with an hourglass coefficient of 0.1. In the connection area, the glass and the structural sealant share a node. All the degrees of freedom of the structural sealant are constrained. In order to save calculation time, the quarter model shown in Figure 3 was used for the calculation. The size of the window glass used for the model verification and response analysis was consistent with the field test of Ge et al. [8], and the size parameters of the glass are shown in Table 3.
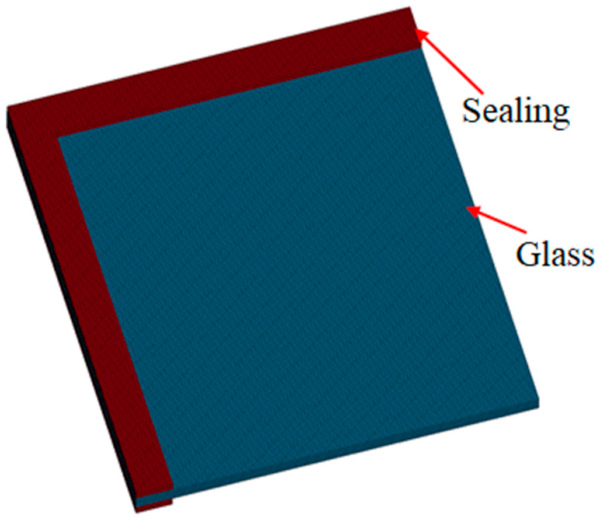
Table 3. Dimensions of the tested glass.
For the grid size, 2.5 mm × 2.5 mm was used for in-plane loading and 2 mm was used in the thickness direction, and the structural sealant was divided into three layers in the thickness direction, which proved to yield reliable predictions through mesh convergence tests.
2.2. Validation of Finite-Element Models
Ge et al.’s [8] field tests on float glass provided the overpressures and impulses under four blast conditions. In this paper, condition 4 was selected for verifying the numerical model. The specific parameters of condition 4 are shown in Table 4 and the blast load was simplified to an inverted triangular load applied to the surface of the float glass based on the principle of equal impulse. The parameters of the window glass in the simulation were the same as those in the test.
Table 4. Explosion load parameters in Ge et al.’s [8] test condition 4.
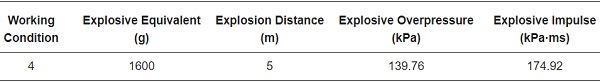
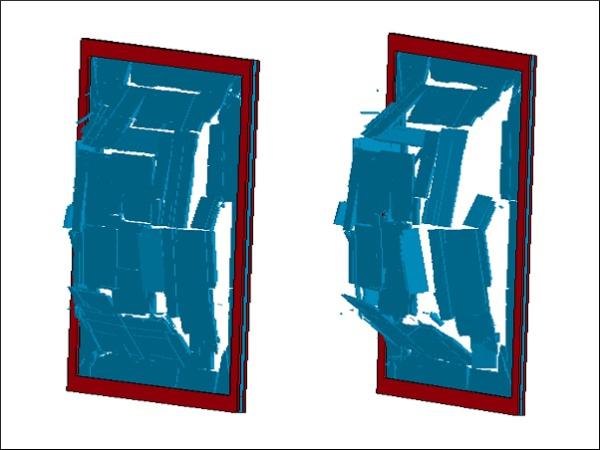
Figure 4 shows a comparison of the failure modes between the test and simulation. The figure shows that localized shear failure occurred in the middle region of the glass during the test and that larger fragments were produced during the failure, which is also shown in the results of the numerical simulation. The numerical simulation also showed localized shear failure not only in the middle region, but also around the window frame. This was mainly because, during the test, a spherical shock wave reached the center of the glass first, causing local shear damage to the center of the glass. In the numerical simulations, since a uniform load was applied, this resulted in shear failure also occurring in the vicinity of the window frame. Apart from this, the results of the numerical simulation provide a good indication of the failure mode of the glass. On the other hand, the model presented a failure threshold with a peak overpressure of 140 kPa and impulse of 70 kPa·ms successfully, where the mid-span displacement was about 20 mm.
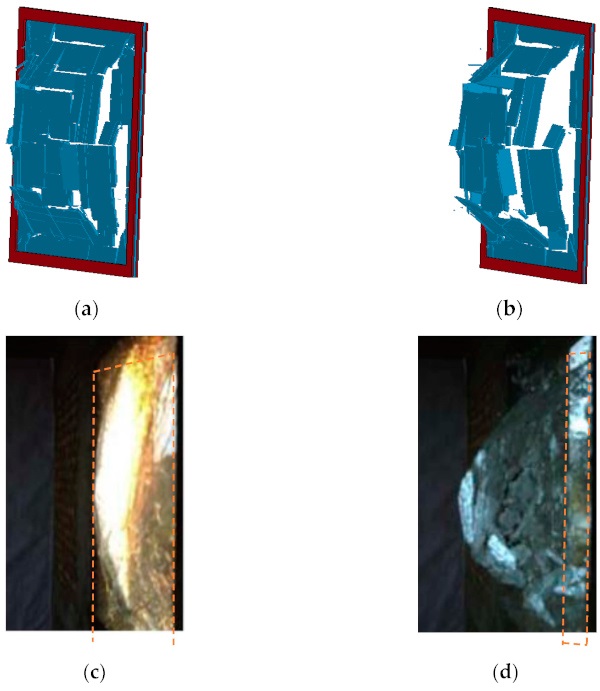
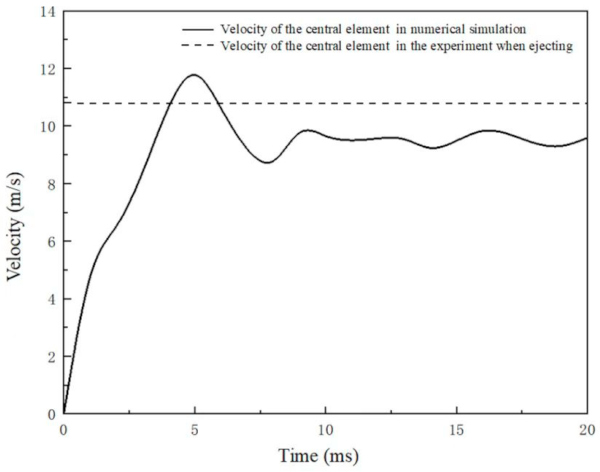
Figure 5 shows the velocity–time history of the center of the glass in the numerical simulation. The figure indicates that the velocity of the center element eventually stabilizes at approximately 10 m/s. In contrast, the ejecting velocity of the central fragment of the glass was 10.85 m/s in Ge et al.’s [8] field test, which proved the accuracy of the numerical model.
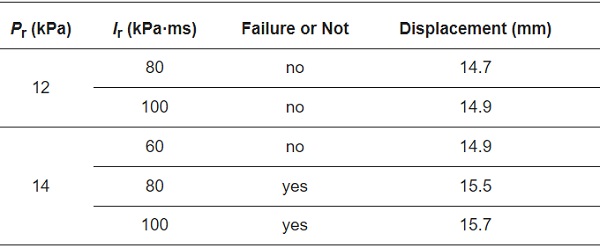
Monk S and Clubley’s [29] tests on float glass were also used to validate the accuracy of the numerical model for predicting the failure threshold. The size of the square panel was 954 mm: the thickness of the glass was 4 mm. The cases of elastic-framed window glass were simulated in this study: the width of the elastic support was 40 mm and the thickness was 12 mm. Table 5 presents the failure states and maximum central displacements before failure in the simulation. Figure 6 presents the failure states of the glass panel under peak reflected pressures (Pr) of 12 and 14 kPa, respectively. From the table and figure, it can be concluded that the threshold pressure of the 4 mm-thick glass is about 14 kPa, which is close to 12 kPa obtained in the tests. The impulse (Ir) and maximum central displacement at failure were about 80 kPa·ms and 15.5 mm, which also agrees well with the testing results of 70 kPa·ms and 13 mm, respectively.
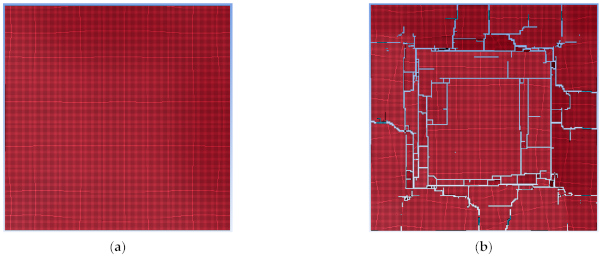
Table 5. Failure states and the maximum central displacements under different blast loads.
3. Effect of Geometric Dimensions on Blast Resistance of Window Glass
In order to analyze the effect of the size of the window glass on its blast-resistance performance, we conducted numerical simulations under various blast conditions to quantify the influence of the aspect ratio and glass area.
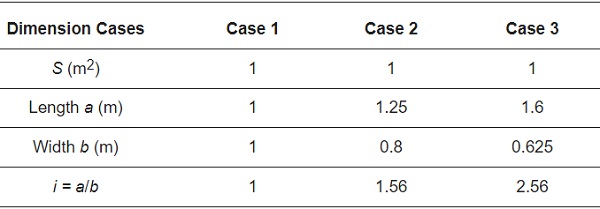
In investigating the influence of the aspect ratio of the window glass on blast-resistance performance, the area of the window glass was kept constant while adjusting the aspect ratio. The dimensions of the window glass used in this study are presented in Table 6.
Table 6. Dimensions of window glass when keeping the same area.
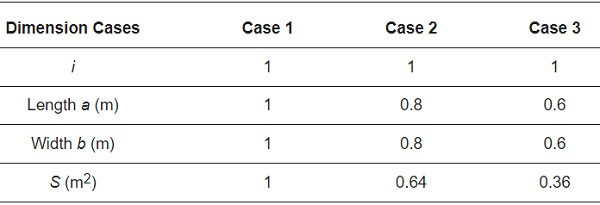
To analyze the influence of the area of the window glass on blast-resistance performance, the aspect ratio was set to 1 and kept constant while adjusting the area of the window glass. The dimensions used for this study are presented in Table 7.
Table 7. Dimensions of window glass when keeping the same aspect ratio.
In the numerical simulations presented in this section, the thickness of the glass was 8 mm. The width and thickness of the structural silicone adhesive were 15 and 5 mm, respectively. In the connection area, the glass and structural sealant shared a node. The all-degrees-of-freedom of the structural sealant were constrained. The in-plane mesh size was 2.5 mm × 2.5 mm, while the thickness was 2 mm. The mesh of the structural silicone adhesive was divided into two layers in the thickness direction. The dynamic responses of the window glass at a blast distance of R = 100 m and the three equivalent TNT weights of W = 1000, W = 300, and W = 125 kg were analyzed. The method of element erosion was adopted to simulate the damage and crack propagation of the glass.
3.1. The Effect of the Aspect Ratio
3.1.1. Failure Modes of the Glasses with Different Aspect Ratios
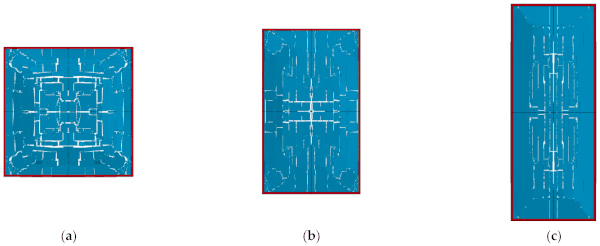
As can be seen from Figure 7, in the case of R = 100 m, W = 1000 kg, the window glass with three different aspect ratios were all destroyed and cracks first appeared in the middle area of the glass, and then gradually propagated outward, eventually leading to the complete fragmentation of the glass. For the glass with aspect ratios of 1 and 1.56, horizontal and vertical cracks appeared on the surface, and the intersecting cracks formed smaller glass fragments. For the glass with an aspect ratio of 2.56, most of the cracks developed vertically along the long side.
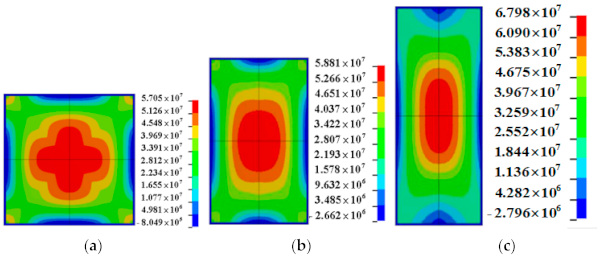
As shown in Figure 8, when the equivalent TNT is 300 kg, the glass with aspect ratios of 1 and 1.56 did not break during this explosion, while the glass with an aspect ratio of 2.56 broke, and the cracks mainly occurred along the long side. When the equivalent TNT was 125 kg, all the three glasses did not break, as shown in Figure 9. However, from the maximum principal stress presented in Figure 10, it can be seen that the maximum principal stresses of the glasses with aspect ratios of 1, 1.56, and 2.56 are 57.05, 58.81, and 67.98 MPa, respectively. As the aspect ratio increased, the maximum principal stress of the glass gradually increased, indicating that the glass with a larger aspect ratio, i.e., a narrow and elongated piece of glass, was more likely to break.

Therefore, from the failure threshold and the distribution of principal stress, it can be concluded that increasing the aspect ratio of the glass is adverse to its blast resistance. Thus, in the blast-resistance design of the window glass, it is better to make the glass aspect ratio close to 1.0, i.e., the length and width of the glass panels were similar.
3.1.2. P–t0 Curve for Glass Failure
To provide a more intuitive description of the blast-resistance performance of the window glass, this article selected 10 positive pressure durations of 2, 3, 5, 10, 20, 30, 50, 70, 100, and 200 ms for each aspect ratio of window glass, and then used a numerical simulation to find the maximum pressure that the window glass could withstand for each positive pressure duration. The maximum principal stress failure criterion was still used, that is, the glass was considered to fail when the maximum principal stress exceeded the failure threshold 𝜎11>𝑇𝑏 (𝑇𝑏 = 80 MPa).
The P–t0 curves of the glass were studied to better quantify the blast resistance of the glass with different aspect ratios, as shown in Figure 11. Table 8 provides the corresponding limit overpressure values for each duration when failure occured.
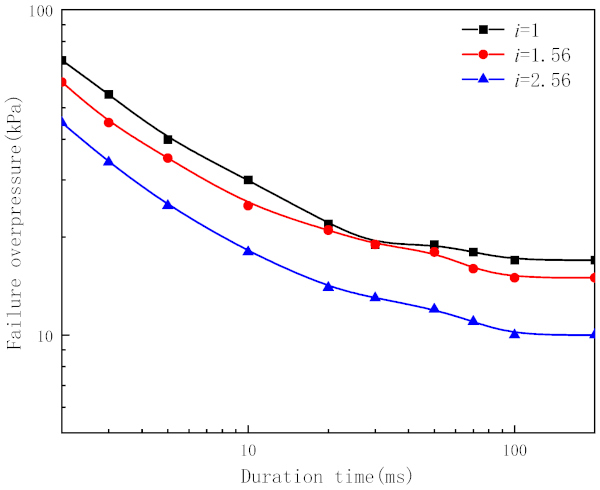
Table 8. Limit overpressure under each duration when the glass with different aspect ratios fail.
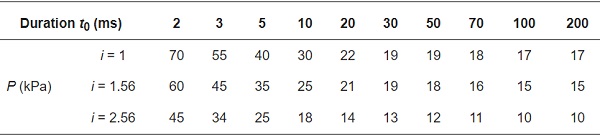
Figure 11 shows that the overpressure failure of the glass with an aspect ratio of 2.56 is significantly lower than that of the glass with aspect ratios of 1 and 1.56 under all durations. At the same time, the overpressure failure for glass with an aspect ratio of 1.56 was also lower than that with an aspect ratio of 1. As the aspect ratio of the glass increased from 1 to 2.56, the failure overpressure decreased from 17 to 10 kPa, with a reduction of approximately 41%.
The reason why the blast-resistance performance of the glass decreased with the increase in the aspect ratio was that, when the aspect ratio of the glass was close to 1, it was a bidirectional load-bearing member and both its sides could withstand the blast loads. With the increase in the aspect ratio, the glass plate gradually turned into a unidirectional load-bearing component, and only the short side could withstand the blast loads.
3.2. The Effect of Glass Area
3.2.1. Failure Modes of the Glasses with Different Areas
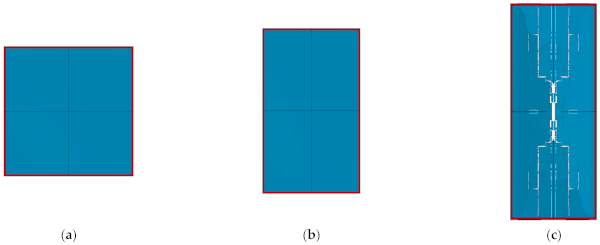
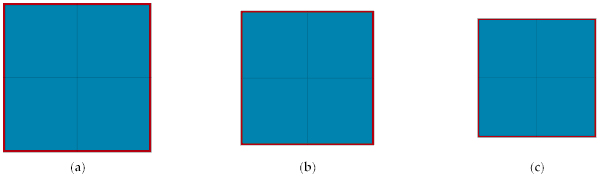
This section discusses the breakage and crack propagation of glass with different areas under blast loads. Figure 12 presents the damage of the glass under an explosion of W = 1000 kg, R= 100 m; it can be observed that, when the area of the glass is large, the glass breaks in the middle region first and then the cracks gradually expand in all directions until the glass is completely broken. In contrast, when the area of the glass is small, it remains undamaged during the explosion.
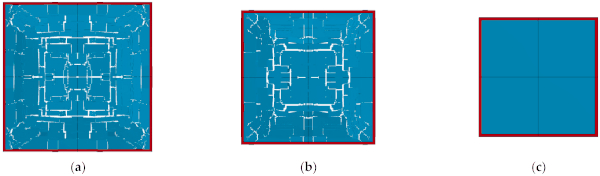
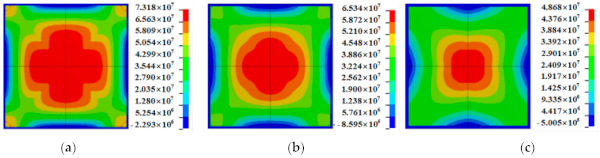
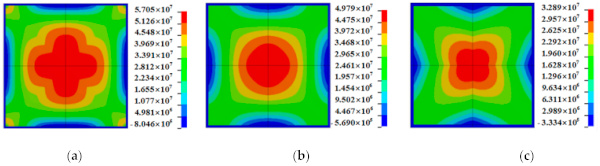
Figure 13 shows that no breakage occurred for all three glasses with different areas while W = 300 kg. Similarly, under the blast case of W = 125 kg, the glass was not damaged, which is the same as that shown in Figure 13 for W = 300 kg. The maximum principal stresses in the glass were also compared under the two blast conditions. It can be seen in Figure 14 that, when W = 300 kg, the maximum principal stresses of the glasses with areas of 1, 0.64, and 0.36 m² are 73.18, 65.34, and 48.68 MPa, respectively. When W = 125 kg, they are 57.05, 49.79, and 32.89 MPa, respectively (Figure 15). Although no breakage of the glass occurred under either condition for different areas, the maximum principal stresses in the glass gradually decreased as the area decreased. This indicates that the smaller area of glass also tends to be safer under blast loads. In the blast-resistance design of the window glass, it is better to decrease the area of the glass.
3.2.2. P–t0 Curves for Glass Failure
The P–t0 curves of the glass with different areas were studied to quantify the influence of this parameter on the blast resistance of the glass. Figure 16 presents the P–t0 curves of the three glasses with different areas, and Table 9 presents the corresponding limit overpressure values when failure occurs, for 10 durations.
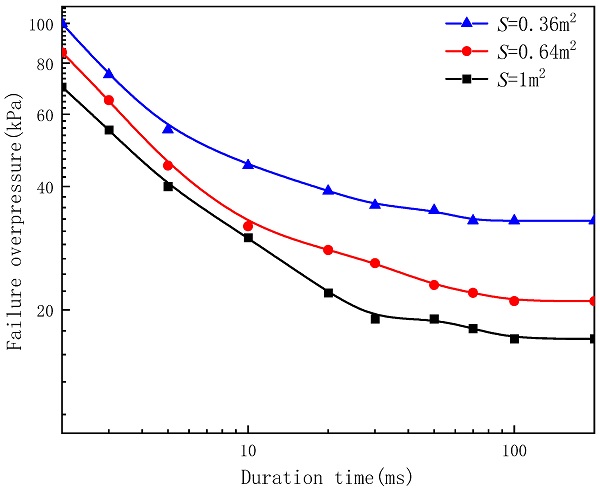
Table 9. Limit overpressure under each duration value when the glass with different areas fail.
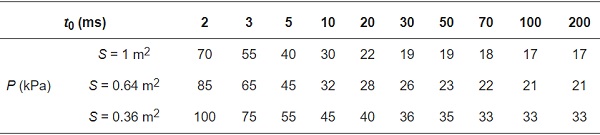
From Figure 16, it can be seen that, as the area of the glass decreases, the failure overpressure gradually increases. When the area of the glass decreases from 1 to 0.36 m2, the failure overpressure increases from 17 to 33 kPa, achieving an increment of 94%. This is because, as the area decreases, the overall stiffness of the glass panel increases and the resultant force decreases; therefore, the smaller window glass could withstand the more-intensive blast loads.
4. P–I Curve for Damage Evaluation of Different Sizes of Window Glass
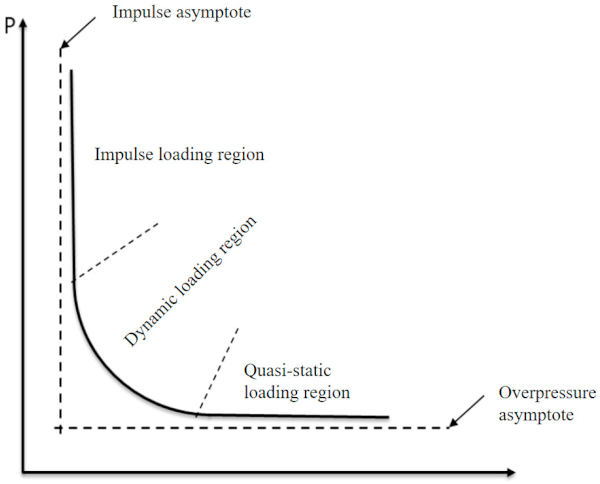
The P–I (pressure–impulse) curve is a critical failure threshold for a structure under different explosive loads [30]. Figure 17 shows a typical schema for a P–I curve, which reveals two asymptotic lines, namely, impulse and overpressure asymptotes, corresponding to the critical impulse and overpressure of the structure under particular damage, respectively. Meanwhile, a typical P–I curve consists of three regions, including the impulse loading, the dynamic loading, and quasi-static loading regions.
4.1. Simplified Numerical Method for Predicting P–I Curve of Glass
In this study, the P–I curve represents the critical break threshold of the glass. In order to determine the P–I curve for glass with different aspect ratios and areas, a series of numerical simulations were performed to find their break thresholds. An empirical equation for the P–I curves of glass was derived through trial calculations and with the assistance of references [5]. The equation is given as:
![]()
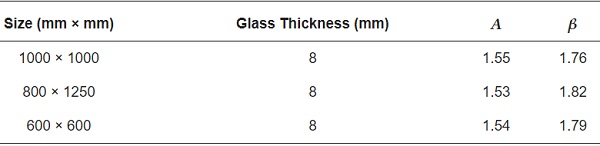
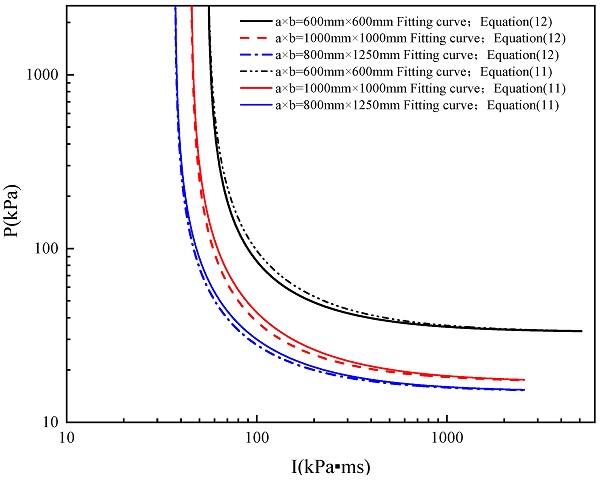
where P₀ is the overpressure asymptote of the P–I curve, while I₀ is the impulse asymptote. 𝐴 and β are constants relating to the damage criterion and structural member parameters. The two parameters of the P–I curves for the glass with different parameters are shown in Table 10. From the table, it can be seen that 𝐴 and β are less influenced by the glass size; therefore, in order to reduce the number of parameters, A was set to 1.5 and β was set to 1.8. Thus, Equation (11) is simplified to:
![]()
Table 10. P–I curve parameters in Equation (11).
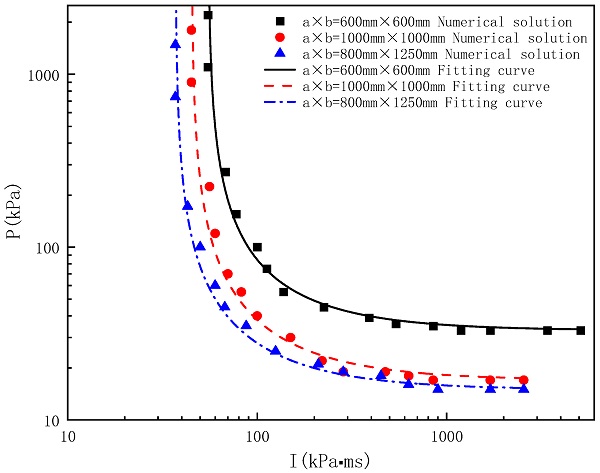
The P–I curves corresponding to different glasses obtained using Equation (12) as the fitting function are presented in Figure 18. It can be seen from the figure that the curves provide a good fitting result. Figure 19 compares the P–I curve obtained by fitting Equations (11) and (12) as the objective function. It can be seen that the two objective functions provide similar results. Based on the above analysis, the simplified numerical method for determining the P–I curve of the glass is summarized as follows: (1) conducting a lot of simulations to obtain the break threshold under different overpressures and impulses; (2) taking Equation (12) as the objective function, fitting the break points obtained from the first step.
4.2. Parametric Analysis of the P–I Curve for the Glass
Based on the simplified numerical method for predicting the P–I curve of the glass, this part analyses the influence of the parameters of the glass on the P–I curve.
4.2.1. Influence of the Aspect Ratio of the Glass
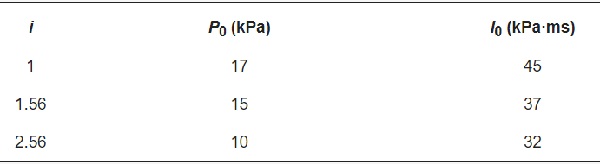
Figure 20 presents the P–I curves of the glass with different aspect ratios, and Table 11 presents the overpressure and impulse asymptotes corresponding to different aspect ratios (in this part, the area of the glass was 1 m2 and the thickness of the glass was 8 mm). It can be seen that both the impulse and overpressure asymptotes of the P–I curve decreased with the increase in the aspect ratio. The P–I curve shows that an increase in the aspect ratio reduces the blast-resistance ability of the window glass, which is consistent with the conclusions presented in Section 3.
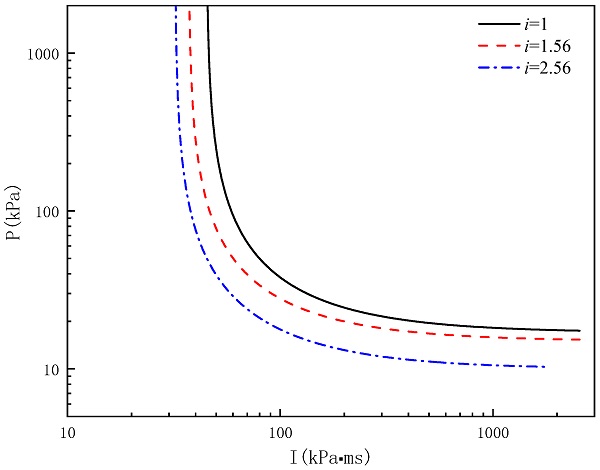
Table 11. Overpressure and impulse asymptotes of glass with different aspect ratios.
4.2.2. Influence of Glass Area
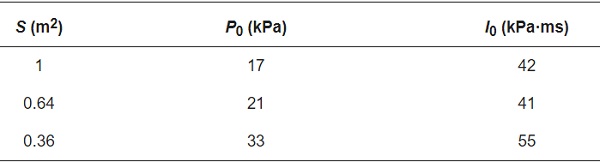
P–I curves for glass with different areas under the same aspect ratio were obtained by a series of numerical simulations, as shown in Figure 21 (in this part, the aspect ratio of the glass was 1.0 and the thickness of the glass was 8 mm). The values of the overpressure and impulse asymptotes are also presented in Table 12. It can be seen that, as the area decreases, the overpressure asymptote of the P–I curve increases. However, for the impulse asymptote, the difference is not as great as the overpressure value; for the areas of 0.64 and 1 m2, they were essentially the same. This was mainly due to the very short duration of the applied blast load and the brittleness of the glass under the impulse loading region; in this case, the glass did not have enough time to deform before failure occurred (deform as an overall structure) and the blast load at this stage was mainly resisted by the inertial resistance of the glass mass.
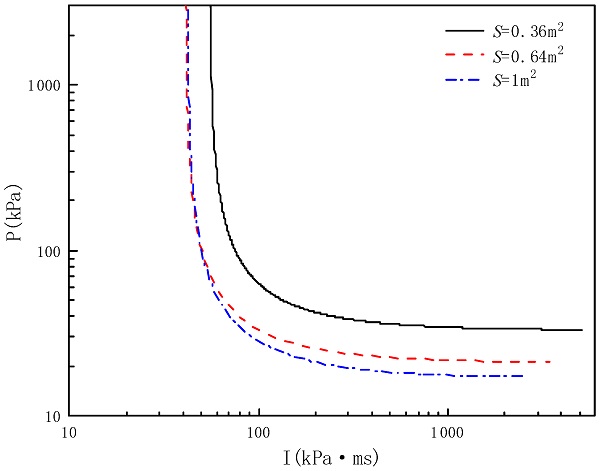
Table 12. Overpressure and impulse asymptotes of glass with different areas.
4.2.3. Influence of Glass Thickness
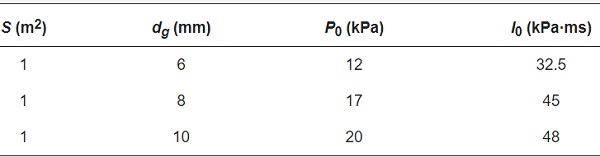
Similarly, to investigate the influence of glass thickness on the P–I curve, numerical simulations were conducted to obtain their P–I curves under the same aspect ratio and area, as shown in Figure 22 (in this part, the area of the glass was 1 m2 and the aspect ratio of the glass was 1.0). Table 13 also presents the values of the overpressure and impulse asymptotes for different thicknesses of glass. As can be seen from the figure and table, both the overpressure and impulse asymptotes of the P–I curve increase with the increment in the thickness. This was mainly because increasing the thickness of the glass effectively increased the bending load capacity of the glass panel. This result can be further verified by the experimental study of Monk and Clubley [29]. In their study, the threshold for 4 mm-thick glass with an area of 0. 89 m2 was close to an overpressure value of 12 kPa and impulse value of 70 kPa·ms, which is apparent in the bottom-left area of the P–I curve of 4 mm-thick glass and agrees well with the parameters of this study.
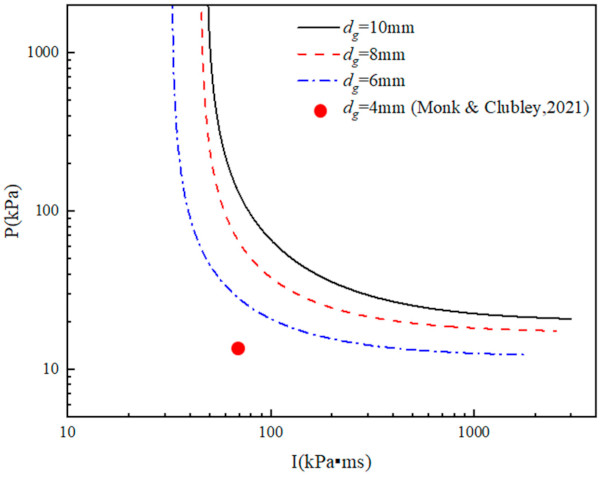
Table 13. Overpressure and impulse asymptotes of glass with different thicknesses.
4.3. Prediction Formula for P–I Curves for Glass of Different Sizes
Based on a large number of numerical simulations, empirical formulas for predicting the impulse 𝐼₀ and overpressure 𝑃₀ asymptotes as a function of the aspect ratio (i), length (𝑎),width (𝑏), and thickness (𝑑𝑔) were obtained as follows:
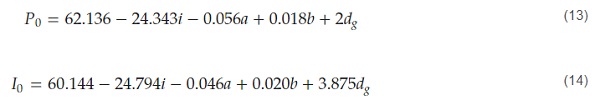
Several representative overpressure and impulse asymptote values obtained by numerical simulations were compared to the results achieved by the empirical formulas, as shown in Table 14.
Table 14. Comparison of overpressure and impulse asymptotes obtained from the numerical simulations and empirical formulas.
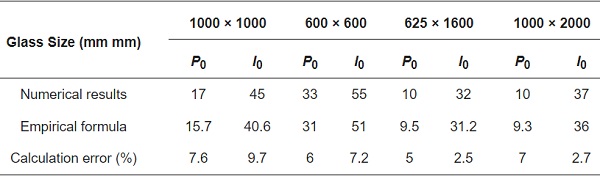
As can be seen from Table 14, the differences between the results obtained from the fitting formula and those obtained by the numerical method are small enough, which indicates that the built empirical formulas have a good applicability in predicating the P–I curve of arbitrary window glasses.
5. Conclusions
This paper studied the influence of glass size on blast-resistance performances. Empirical formulas of the P–I curves were proposed to predict the failure of glass with different aspect ratios, areas, and thicknesses. The main conclusions can be summarized as follows.
- Square window glass has the best blast-resistance performance. As the ratio of length to width increases, the blast resistance of the glass decreases.
- Reducing the glass area can effectively improve its blast resistance. As the glass area decreases, the overpressure asymptote of the P–I curve increases obviously. However, for the impulse asymptote, the difference is not as much as the overpressure value.
- Increasing the thickness of the glass can significantly increase the values of the impulse and overpressure asymptotes of the P–I curve, which results in the improvement of the blast resistance of the glass.
Author Contributions
Conceptualization, B.Z.; data curation, X.W.; investigation, B.Z.; methodology, J.T. and M.L.; validation, C.G.; writing—original draft, X.W.; writing—review and editing, M.L. All authors have read and agreed to the published version of the manuscript.
Funding
Support was received from the National Natural Science Foundation of China under grant number 51808129.
Institutional Review Board Statement
Not applicable.
Informed Consent Statement
Not applicable.
Data Availability Statement
The authors confirm that the data supporting the findings of this study are available within the article.
Conflicts of Interest
The authors declare no conflict of interest in this research.


")