This paper was first presented at GPD 2019 by Andreas Kasper, from Saint-Gobain, Herzogenrath / Germany.
Introduction
NiS inclusions are found everywhere in the raw glass; their repartition is visibly influenced by gravitational settling (Author’s presentation GPD 2017). We explain this physically, applying STOKES’ settling theory. Further elaboration with more parameters allows to understand the observed nickel sulphide inclusion size spectrum.
Obviously only a minority of the original NiS population (c.15%) arrives finally in the glass; also size-depending decomposition (“digestion”) and self-destruction (“explosion”) due to composition evolution in the glass melt are playing a rôle in this size separation process. Comparing this with the size spectrum of inclusions really having caused breakages reveals a “breakage ratio” curve that can be used to quantify how dangerous a given nickel sulphide inclusion population really is.
This will help to solve the actual key problem of spontaneous breakages on buildings, namely to quantify the residual breakage risk of HStested toughened glass (acc. EN 14179-1), and, therewith, proving that its safety is high enough to satisfy even highest demands. Real breakages of HS-tested glass on buildings are extremely seldom; therefore, quantification is difficult. We present an example from SaintGobain experience, revealing that the residual risk is much lower than previously estimated. Instead of 1 breakage in 400 t, it seems to be closer to 1 in 6000 t. Therewith, it reaches a component safety comparable to concrete or steel.
General understanding: The root cause of spontaneous breakages on façades
Definitely since the early 1960ties [(1) (2) BALLANTYNE-1957/1961] and by later extensive work, e.g. by [(7) (8) SWAIN-1980/1981] to give just one example, the glass industry knows that thermally toughened safety glass in façades can break spontaneously, disintegrating into small and comparatively harmless fragments; this is why it is called a safety glass.
In spite of being seldom, such events are strongly unwanted, imagining the small pieces dropping from height. One of the characteristics of the phenomenon is that the toughened glass built into a façade does, at first, show no sign of being impacted. Only after an incubation time of c. 1 year or more (depending on the climatic ambient conditions), breakages start and can continue for more than 10 years with, however, decreasing frequency.
Examining the details of such a breakage reveals a breakage departure point in the form of a butterfly. However, this phenomenon is a property of toughened glass and does not at all prove the presence of a nickel sulphide inclusion. Only closer examination, looking for a fault in the middle of the so-called fracture mirror located in the bulge of the butterfly, can re-assure the real breakage cause. Very often in such cases, a NiSx inclusion is then identified.
The root cause for just this seldom mineral (millerite) causing spontaneous breakages lies in its ability to form two phases of identical chemical composition but different crystallographic habitus, the so-called α (or high-temperature) and β (or low-temperature) phases. Now, during production of thermally toughened glass and due to the high cooling rate applied, the α phase is frozen in.
Due to some difference in the expansion coefficients of NiSx and glass, it sits in a cavity that is slightly bigger than itself, in this way not exerting any pressure onto its surrounding. However, because the matter is crystalline (NiS crystallizes at c. 1000°C), it made a print with a scarred surface into the glass. This makes some inclusions a weak point of the toughened glass, even prior to transformation, especially if the inclusion is big in comparison to the total glass thickness. However, for building glass this aspect is normally meaningless.
At ambient temperature, NiSx inclusions are subject to a slow α to β transformation, accompanied with a volume dilatation of c. 2.5%. Approximately, the first % of this is spent to bridge the space between the inclusion and its cavity. This fact also causes the time delay of the start of the breakages, as already mentioned above. Thereafter only, the inclusion starts to exert pressure onto its surroundings. If and when this pressure leads to a local transgression of the glass’ rigidity (so-called σIc value), first a crack is initiated that, if it oversteps a certain critical size, leads to total disintegration of the pane as described above.
Note that it’s not the inclusion that makes the glass disintegrate in that way; the real reason is the stress energy frozen in that makes the toughened glass (macroscopically) very strong, but at the same time (microscopically) vulnerable against certain inner weak points as e.g. (but not exclusively as we will see later) nickel sulphide inclusions. The latter are “only” the initiators of the failure. Consequently, annealed glass is completely safe against any consequence of this seldom glass fault.
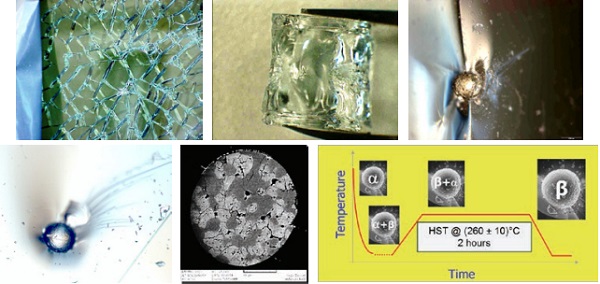
As a prevention against spontaneous breakages, the so-called Heat Soak Test (HST) was invented. It consists, seemingly simple, in heating up the toughened glass to a temperature above (all world-wide standards included) 210°C, and then to wait for a certain time (minimum, all standards included, 10 minutes) in order to let the α to β transformation finish itself. Panes containing critical inclusions sort themselves out, the survivors are said to be safe.
In order to find out the safety of the HST glass, already in the 1970ties a test was carried out At Pilkington’s German department in the frame of the construction of the Deutsche Bank twin tower in Frankfurt. 400 tons of toughened glass were foreseen in the façades, and the owners would not have wanted a breakage (which, indeed, did not happen up to date). So, the HST was designed for this: Less than 1 breakage in said 400 tons, however, expressed in expected residual breakages in the test itself because, understandably, the glass could not be tested on a building. The German Standard (DIN 18516) derived thereof fixed a holding time of eight hours “at constant oven temperature”, but it was, however, very imprecise and would easily be misinterpreted.
Therefore, in the middle of the 1990ties, the (at that time) three big European glass producers started to collaborate on a new HST product standard, the result thereof being EN 14179-1, called “Heat-Soak Tested Thermally Toughened Safety Glass”. Data of optimized HST furnaces were collected over 5 years, evaluated statistically using the WEIBULL function, and, based on this, the residual risk fixed to said max. 1 breakage in 400 tons by fixing a holding time of 2 hours at (280 ± 10)°C. Note that in this, the residual risk is also, and just as before, meant in terms of “expected additional breakages in HST” because these are the data that were, in fact, extrapolated.
Using the glass panes’ average mass as a lever, from this extrapolated residual risk a component safety of c. 10-5 p.a. is derived, also according to [(6) Schneider-Hilcken_2010].
We got motivated to review this state of knowledge because, in the frame of a routine review of the HST Standards, the questions about European homologation and the real safety of the HS-tested glass (that is, as we know for sure now, lower than the additional breakages expected in the HST oven) were intensively discussed again, and the component safety of “only” 10-5 p.a. being classified to be “too low” by some.
Consequently, the Author and some of his international colleagues collected all available knowledge and added some, partly new, partly older but previously unpublished data and evaluations. The result thereof were three papers published in 2018 in the scientific journal “Glass Structure and Engineering”, all devoted to “Spontaneous cracking of thermally toughened safety glass”, online available for free download at
Part 1: Properties of nickel sulfide inclusions (August): https://rdcu.be/5uiz
Part 2: NiSx inclusions identified in annealed glass (November): https://rdcu.be/bdQM6
Part 3: Real breakages in HST / on buildings (December): https://rdcu.be/bdQNa
The present GPD paper summarizes a part of this work, though being forced to letting some interesting facts apart. For complete information, the reader is motivated to download and read thoroughly said papers.
Properties of nickel sulphide inclusions
Nickel sulphide inclusions in float glass for building application are mostly spherical or slightly ellipsoidal. They crystallize at the entrance of the float bath at c. 1000°C, and if this occurs during the forming process, the (still liquid) NiSx droplets are stretched, more in thinner and less in thicker glass. As already pointed out, their surface is scarred by the crystallization, making the inclusion a “weak point” in some critical cases, even prior to α to β transformation.
Because NiSx has a significantly higher density than glass (about the double), every inclusion tends to settle in the molten glass. In general physical understanding (STOKE’s equation), bigger inclusions settle faster than smaller ones so that this process limits the size of the observable inclusions “coming through” to about 500 µm in diameter. Some additional effects correlated with the principal instability of all NiSx species in an oxidizing (e.g. float glass) melt (for details see papers mentioned) make the total yield of the nickel sulphide inclusion generation process to be not more than c. 15% by reference to the starting conditions from steel particles involuntarily added into the glass batch.
On the other hand, there is no fixed composition in the inclusions. The conversion of a nickel containing stainless steel particle into an inclusion in the ready-made glass comprises a liquid state wherein the S content (i.e. x in NiSx) increases continuously, possible x values being situated between c. 0.9 and 1.06, depending on their residence time and the temperature profile they have seen while they were liquid.
At the moment of crystallization, the actual value of x defines the crystalline state of the solid. Two cases are to be distinguished.
- If x < 1, the resulting inclusion will contain 2 phases, namely Ni9S8 and stoichiometric NiS. One example is shown in Fig.1 wherein both phases are clearly distinguishable by different shades of grey. Note that these inclusions always contain the fast-converting stoichiometric 1:1 phase.
- If x ≥ 1, this composition is frozen in as “α-NiSx”. The variable properties of this composition were described and characterized by [(4) LAFFITTE-1956] and [(9) (10) (11) YOUSFI-2010/2011]. In short, the conversion rate decreases with increasing x, and, according to YOUSFI, is too slow to do any harm if x > 1.054.
From this and the tendency of NiSx to decompose spontaneously (and randomly) if its vapor pressure is too high because of a high x value, the following diagram of probability of occurrence of NiSx compositions is derived. Examples of explicitly analyzed inclusions are shown below the schematic diagram.
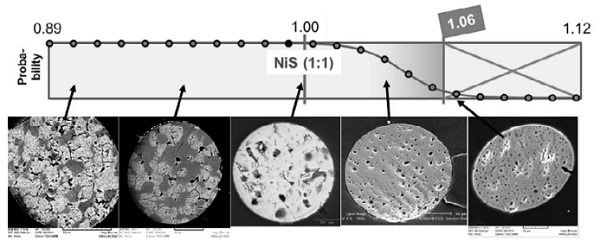
The visible bubbles in the inclusions indicate their over-pressure. Against intuition, smaller bubbles indicate higher over-pressure. This is due to the fact that the bubbles we see only generate at the moment of crystallization. Inclusions wherein bubbles already generated in the liquid state are unobservable because they destroyed themselves. This is the major reason for the decrease in occurrence of the inclusions with high over-stoichiometry as mentioned above.
In order to make these facts useful for the problem of comparing the HST against ambient conditions, their thermal expansion was calculated, well taking into account the cavity in the glass to be formed at 600°C, and all relevant phase transitions of the potential NiSx combinations leading to the crystalline state. One of the most important thereof is the transformation of Ni7S6 into Ni9S8 at 400°C, related with a strong volume increase that is, however, over-compensated by the high expansion coefficients of both Ni7S6 and Ni9S8.
The thinking behind this approach is that the different combinations build up different pressure depending on temperature and the given value of x, and that (range “T” [for “threshold] in the diagram) a minimum difference in diameters (∆d) must be built up in order to make the inclusion potentially critical. Fig.4 summarizes the resulting findings.
Consequently,
- If the inclusions are untransformed at ambient temperature (assumed to be max. 60°C) there is no indication for breakages, as assured by reality.
- If the inclusions are heated up to HST temperature (260°C), but without being transformed, surprisingly, inclusions containing a high proportion of Ni9S8 lead to breakage. This is due to the extremely high coefficient of thermal expansion of this material.
- At ambient, but transformed, preferentially over- and near-stoichiometric compositions lead to breakage.
- At HST temperature and transformed, every inclusion leads to breakage, and there is more pressure onto the glass due to the combination of facts.
Part B in Fig.4 summarizes these findings, putting relative the curves (c) and (d) for their parts over threshold T. Setting the values for the HST (curve d) at 100%, the relative values of curve (c) represent, at the same time, the relative breakage probability, and the surface below the dotted line marked “f” gives the relative breakage probability between ambient conditions and HST. It shows up that, only based on the simple facts of thermal expansivity, the HST globally destroys 2.5 times the number f panes that would be critical on building. This is a high safety margin.
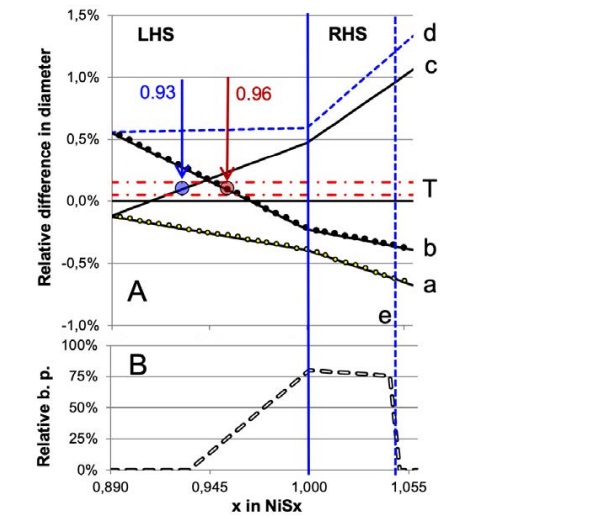
a : Before transformation, Building: I < Bu always
b : Before transformation, H.S.T.: I < Bu if x > 0.96
c : After transformation, Fassade: I < Bu if x < 0.93
d : After transformation, H.S.T.: I > Bu always
e: YOUSFI‘s Limit (transformation too slow)
B: Comparison of breakage probability (assumed proportional to ∆d) between Building (curve) / H.S.T. (=100%)
The calculation also demonstrates that the simple extrapolation of the HST breakage data can never lead to a correct estimation of the pane’s safety at ambient. The latter will always be under-estimated.
This is not the only fact leading to the same conclusion. Other results published extendedly in above-mentioned papers point out clearly, and independently because based on different facts, into the same direction. Main points of view therein are the examination and testing of nickel sulphide inclusions identified and characterized in annealed glass, and the statistical analysis of the difference in sizes and localization of inclusions found in both HST and “on building” breakages. Details thereof are committed to be resumed by the Gentle Reader of the present summary, reading the papers indicated above.
What, exactly, happens in the HST?
Production problems are often an important source for scientific perception. The following happened in 1999, and we can nowadays, 20 years later, be sure of its consequences, namely that, in spite of the big difficulties during production, up to date not one single pane failed on the façade in question. The plans to build the Peter-Merian house in Basel in Switzerland 1) needed several thousands of square meters of green patterned / casted glass for cladding that should look at the same time, from the point of view of color, like the green float glass used for the windows.
In order to fulfill this precisely, SG decided to colorize the whole content of one of its patterned glass furnaces. The glass was produced, toughened (30% breakages) and HS-tested (another 30% breakages). Naturally, the presence of nickel sulphide inclusions was thought to be guilty of this mess, but sampling using horizontal heat-soaking (the single panes repose on a metal support so that breakage origins can easily be collected) turned out to be basically untrue.
Most of the samples were composed of different kinds of SiO2, and identified as batch melting relicts because the furnace was not really designed for this kind of dark glass. Two were exotics, and only one out of eleven was indeed a nickel sulphide inclusion.
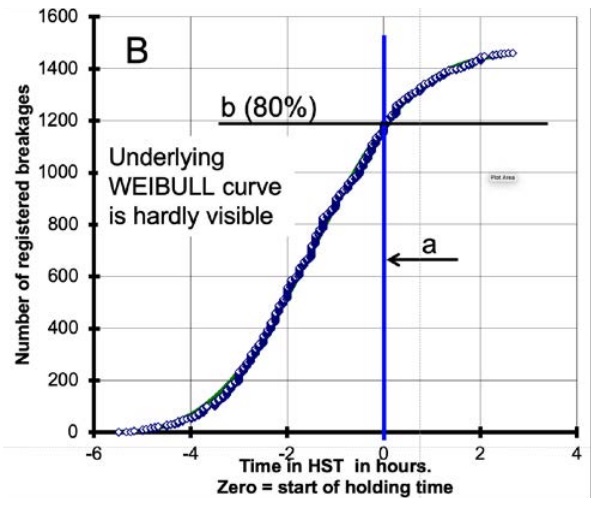
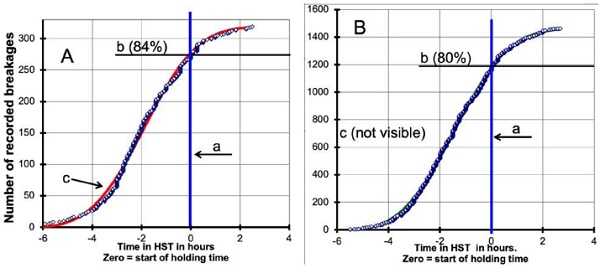
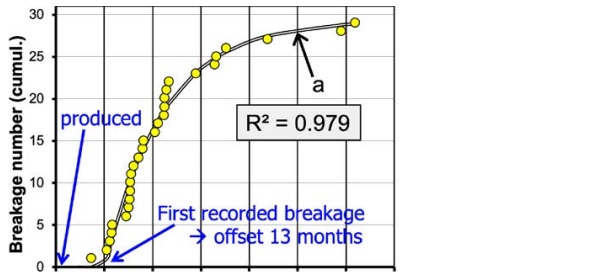
By instance, this happened just during the period when we were collecting data for the implementation of the new HST standard, and this glass production was just made in the same processing factory. The time-to-breakage data were, therefore, recorded, first because they were thought to be nickel sulphide breakages, but later, after the analyses, just “by the way”. At that time, nobody knew this series would have any importance for the interpretation of what happens inside a HST oven. The data went to the archive and were rediscovered and first evaluated statistically by the Author during his work on the present project. Fig.6 shows the result, in comparison with the nickel sulphide inclusion’s result collected for the EN standard.
Obviously (and also mathematically proven, see mentioned papers), both curves look like twins. The only visible difference is in the number and, therefore, in the statistical scattering. This, and the fact that the breakage causes are basically different, leads immediately to the conclusion that the kinetics of the α to β transformation of the nickel sulphide inclusions cannot be the basic cause for this shape of the curve, but that other reasons that are inherent in the HST itself must be preponderating.
Laboratory tests with different synthetic NiSx combinations were carried out since a long time and in many different laboratories, but the measured transformation rates never fitted. An explanation often proposed with emphasis (but, however, never proven experimentally) is that the pressure built up within the inclusion should speed down its transformation.
At least as long as there is no physical contact between the inclusion and its surrounding (see explanation above), this hypothesis is definitely wrong, and we were happy enough to find a prove that it is not true after contact, too. More precisely, we were able to prove that this impact is not making the transformation preponderate. Again, an after-production problem where we, as R&D, were involved in to get solved, brought this, first, access to the respective data and, later, the insight.
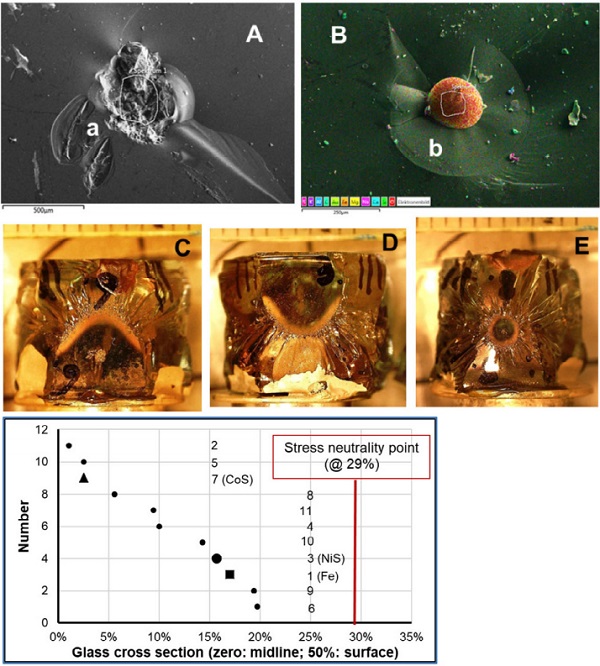
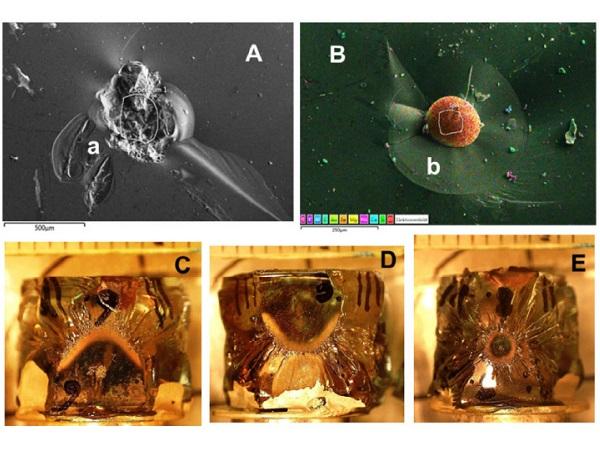
A: Typical SiO2 inclusion with (a) secondary SiO2 crystals (recrystallization).
B: Iron sphere (n°.1 in F). (b): The circular primary crack around the inclusion is clearly visible.
C (n°.6), D (n°.3): Form of breakage mirror reveals impact of external force (bowl-like bending of pane) at moment of breakage
E (n°.8): Form and size of breakage mirror reveal extremely high force coming from inclusion (50 MPa)
F: Positions of non-nickel sulphide inclusions in glass cross section
Basically, it should be possible to model nickel sulphide inclusion caused breakage series (of not HS-tested glass) on a building using an ARRHENIUS based kinetic function under the premise that all inclusions act comparatively, i.e. their transformation follows generally the same 1st order kinetics 2). However, absolute condition for this is that the temperature has to be known because it plays a central role in kinetic calculations.
Normally, this is not the case. Temperature is kind of random, for a given façade it can be between -30°C in winter, +20°C in shadowed areas in summer and more than +60°C in full sunshine. This adds a random influence into the time-to-breakage records, impossible to compensate mathematically, and this leads to the fact that, instead of the ARRENIUS function, a WEIBULL function is normally best adapted for a best-fit and the prognosis of potential future breakages. But there is one exception we know.
The special conditions therein are that the building consists in two separate towers with a closed lobby in-between. Several bridges, railed with toughened glass, link both towers, and the inside railings are entirely made of toughened glass, too. By instance, this inner glass was not HS-tested (in 1999), and there was a problem of a series of spontaneous breakages, see Fig.7. In this special situation the temperature is known because the lobby is airconditioned and, around the clock, kept more or less constant. In this case, the ARRHENIUS fit makes sense; its result showed to be significantly better than the WEIBULL approach.
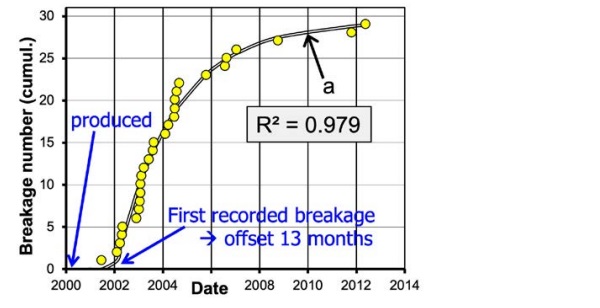
The parameters of the kinetic function were, under respect of the void around the inclusion at start conditions, derived from this approach and showed to be comparable to those obtained in laboratory trials made years ago. Fig.8 compares the different findings, including the time-to-breakage curve from the HST records. Obviously, all kinetic curves, including the one derived from the “Lobby” records, are too steep and too early to explain the HST WEIBULL-fitted curve.
According to any of the kinetic curves, breakages would be expected to stop long before the glass temperature reaches the holding temperature. And, naturally, the “Lobby” curve includes potential impact from pressure increase within the inclusions due to their proceeding transformation. This is maybe the reason why it is, indeed, slower than the curves derived from the laboratory results, but obviously, its form is still similar and it is comparatively fast.
Consequently, we now understand what is NOT the preponderating cause for the shape of the time-to-breakage curve in the HST. Another argument comes from the evaluation of the relative number of inclusions and breakages. It is not possible to fully show this here, but, as an example, we look at the number of “small inclusions” found in annealed glass, in breakages from HST and from buildings, Fig.9. In these histograms the inclusion’s sizes are pooled in classes of 50 µm each.
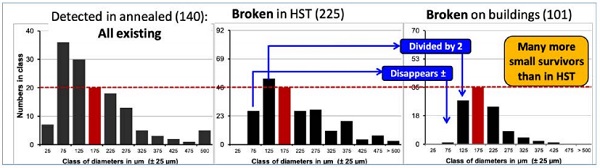
Because we do not have a combining reference 3), we choose the (175 ± 25) µm class as the reference for comparison. Without going into more details here, this comparison shows that in the HST much more small inclusions lead to breakage than on building. A more quantitative evaluation shows that the limit of criticality is c. 50 µm for the HST, and c. 75 µm for the Building situation. The difference (25 µm) is much higher than what can be allocated to thermal dilatation (0.8 µm / factor 31). In other words, even the thermal dilatation discussed above to cause many more breakages in HST than on building has only a minor effect in comparison to what the HST itself adds.
The only reasonable explanation for this seems to be that the HST process itself adds some kind of high stress that forces the smaller inclusions to become critical as well, and the same is true for the breakages due to non-NiS-stones as described above. Once presumed, this explanation seems even to be very plausible and evident. The toughened glass is piled up nearly vertically, often more than five tons at the same time; spacers in only the same thickness range as the glass itself are placed in-between, and the whole pile reposes on a rack made of steel.
After placing this into the HST oven, hot air is blown onto (normally) the lower edge of the pile. One can assume that this edge reaches the final temperature rather fast, but that other parts of the pile, mainly the inner pane’s middle ranges, are much slower. Additionally, the rack’s steel rods and the spacers shade the air flow so that, behind these, the heating rate is, again, different. It is well known that temperature differences in a glass pane induce proportional thermal stress.
This fact leads to the other fact that annealed glass is unable to survive a HST; the induced thermal stress can only be beard in the glass ia at least heat-strengthened. It is also an illusion to believe that the glass temperature is homogeneous when some thermocouples distributed in the glass pile (but, for god’s sake, not too close to the edge; so says the EN 14179-1, and there’s a reason behind it!) show, ± 10°, the same temperature. If the thermocouples are placed too close to the edges, they show the heating air temperature.
Self-understood that the latter is higher than the glass temperature, otherwise there would be no heating-up, but the glass edges are at this temperature. Reasons enough to believe firmly that temperature differences over the glass surfaces cause high membrane stress. From a practical point of view, the Author was reported by credible glass processors that this stress leads to visible bowl-like bowing of the whole panes. Now, if a toughened glass pane has no inner defects, it will survive this attack.
However, if there is a critical inner defect, be it a transformed nickel sulphide inclusion of sufficient size and in adequate stress field position, be it a refractory stone shrinking by the heating-up but, beforehand, having caused a primary crack that turns out to be critical under the external stress conditions, these panes do not survive. One can say that the HST tumbles the glass and eliminates every potentially defective pane, including those that would, at normal façade use, never ever break. No wind load on a building can be as strong as the tumbling stress in the HST.
Again the conclusion thereof is that the “simple” extrapolation of the HST results leads to under-estimation of the safety of HS-tested glass, but also that if the latter’s safety shall be estimated correctly, there is no way than to take into account (mathematically) the strong thermo-mechanic impact of the HST itself.
An example from practice: Heat-Soaked glass at SG Germany
Most of the estimations elaborated above are minimum estimations based on conservative assumptions, or they consider only one in many aspects so that it is sure that more safety has to be added. This is the reason why it is impossible to derive thereof a precise number for the overkill of glass plates taking place in the HST ovens working worldwide.
The way how the different impact factors combine is actually unknown; it seems, however, that the relation of breakages between buildings and the HST is low. Theoretical calculation is difficult, was never done up to date in sufficient quality and is – if at all – only possible using sophisticated, detailed finite-element simulation tools and accounting for each of the properties discussed in the different parts of the series of the Author’s papers mentioned above.
A definitive statement could be obtained in a pragmatic way by evaluating the breakage rates observed on buildings after assuredly proven HST. However, this is difficult if countable events (i.e. breakages on buildings) do not occur over years. Therefore, the practical experience of SG during the last years shall be described as an example; other glass producers are more than welcome to publish their own experience for support.
All producers of glass panes according to EN 14179-1 are obliged to make available statistical data referring to HST-glass production. In Germany this is even already mandatory since 2002, the year of the factual introduction of the new HST standard through the respective prEN. Numbers, sizes, masses, glass kinds (clear, tinted, coated etc.) and the related breakage numbers in the HST furnaces are systematically recorded in the factories concerned.
The four SG affiliates in Germany are under one quality directory. The respective data are systematically information-technically merged since 2011, and only since that time they are available for cross-plant evaluation. Thus the production of 17209 t of HST-glass was concretely recorded between 2011 and mid-2017 (both years included), and 2793 breakages (plus some collateral damages) were counted therein [(5) RUBBERT-2018].
This refers to 1 spontaneous breakage in 6.2 tons of glass, a common breakage rate also already published in e.g. [(3) KASPER-SERRUYS 2002]. Extrapolated onto the whole time during which the new HST was factually applied (from 2002 to 2017 included), c. 42’000 t of HST-glass were produced in these four facilities, including c. 6900 breakages in the furnaces.
In spite of the proven too high holding temperature, only four breakages on façades were claimed out of this complete 16 year’s production. Curiously, they all originate from the same factory, the same production period (2009) and are concerned to the identical built-in situation where HST is not forced by law since there’s no danger at all to life. Many coincidences at the same time; however, a small number of unreported single breakage cases cannot be entirely excluded, even if this is not probable in view of the high sensitivity of both the clients and the public media.
“Glass rain on a building” is always a good lead story, often enough read before and shortly after 2002, discrediting the use of toughened glass, and being the core cause for the development of EN 14179-1. Indeed, every customer complaint at SG concerning a spontaneous breakage (except the small series mentioned above) dates from before the factual introduction of pr-EN 14179-1; remember that spontaneous breakages of un-soaked glass can take place up to 30 years after toughening. Retrospectively, the factual introduction of pr-EN 14179-1 marked a turning point in the history of HST-glass.
Consequently, hypothesizing that the four reported breakages are indeed breakages after HST, that there might be a dark figure of three more 4), and that breakages after HST do not show the normal latency period of c. one year, leads to the estimation of a statistical residual breakage risk of one in 6000 t of HST-glass. This means that the formerly envisaged goal of one breakage in 400 t (see e.g. [(3) KASPERSERRUYS-2002]) is in reality excelled by a factor of fifteen.
A number of 6900 breakages in HST is accompanied by only (estimated) seven on building, i.e. the relation is 0.1% only, contrariwise to the 1.5% prospected in the mentioned publication by extrapolation of the breakages recorded during the holding time of the HST. Said 1.5% refer to c. 100 breakages; however, this counts only for SG products in Germany; the corresponding number from competing HST-glass producers would have to be added, so that we would expect much more, eventually up to 500 breakages only in Germany. This high number would certainly not escape to the alertness of clients and public media.
In summary, based on the practical finding at SG, the efficiency of the HST is estimated to be 99.9% instead of the prognosticated (extrapolated) ratio of 98.5%, and the statistical residual breakage risk of Heat Soak Tested Thermally Toughened Safety Glass is estimated to be one in 6000 tons of HST-glass.
Conclusion
We show very clearly that, and why, there are always more glass breaks in HST than on buildings. To date, only the difference in thermal expansion between glass and nickel sulphide has been assumed responsible for this effect; consequently, it has been looked at to be very small. The time-to-breakage data obtained in HST have thus been used and extrapolated to make an estimate of the residual breakage probability of Heat Soak Tested Thermally Toughened Safety Glass. The facts being presented here should help to providing better estimating methods for HST toughened safety glass residual breakage probability.
New findings and calculations of the impact of the composition of nickel sulphide inclusions onto the difference in breakage probability between HST and façades have been compiled. In short, the result of this is that the HST eliminates every inclusion that could lead to breakage on buildings and additionally more than the same number as a “safety margin”.
The Kathedral glass evaluation dataset reveals that heat-soak tested glass is also safe if the breakage rate during production is very high. Not only nickel sulphide inclusions, but also other stones are responsible for significant breakage in HST. The general form of the time-to-breakage curve and other findings (position in glass section, breakage stress in case of pre-damage derived from the radius of the breakage mirror) are nearly identical with those from nickel sulphide inclusions. The conclusion from this is that the nature of the inclusions causing breakage in HST is not the deciding factor for the time to breakage; the α to β transformation speed of the nickel sulphide inclusions is not the process determining the speed of this devolution.
This observation solves a long-existing question, namely why the time-to-breakage curve in HST cannot be explained by the measured phase transformation speed of the different relevant NiSx species. Considering the occurrence frequency derived here, the latter is much faster.
This leads to the new conclusion that in HST also other impact factors than the difference in thermal expansion play an important role. We presume the main influencing factor to be strong thermo-mechanical forces (temporary stress) induced into the glass during heatingup. This absolutely non-negligible factor for the final safety of HS-tested glass could be quantified by stress measurement or finiteelement simulation.
Overall, the new findings are important arguments for why the existing estimations of residual breakage probability of toughened glass tested according to EN 14179 1 underestimate actual safety. The presumption that the breakage behavior in HST and on buildings would be the same is clearly not correct. Consequently, our recommendation is to review the present safety estimation. For now, it should be considered as a minimum estimation with a big safety margin.
An example from Saint-Gobain practice shows additionally the very high real safety of the Heat-Soak Tested Thermally Toughened Safety glass.
Please note that the present R&D work does not aim to change the existing HST conditions according to EN 14170-1.
Literature list
More literature citations are listed in the Author’s articles available for free download:
Spontaneous cracking of thermally toughened safety glass.
Part 1: Properties of nickel sulfide inclusions (August): https://rdcu.be/5uiz
Part 2: NiSx inclusions identified in annealed glass (November): https://rdcu.be/bdQM6
Part 3: Real breakages in HST / on buildings (December): https://rdcu.be/bdQNa
1) BALLANTYNE-1957 Ballantyne, E.R.: Cracking of coloured glass used as a wall cladding. Architecture in Australia 46 (1957) 72
2) BALLANTYNE-1961 Ballantyne, E.R.: Fracture of toughened glass wall cladding, ICI house, Melbourne. Commonwealth Scientific And Industrial Research Organisation (CSIRO), Div. Build. Res. Melbourne (Australia). Report 06 1-5. 1961.
3) KASPER-SERRUYS-200 KASPER, A., Serruys, F.: Estimation of the Safety of Toughened Glass after a Heat Soak Test. Internet-publication: http://www.glassonweb.com/publications/safetyoftoughenedglass/index.php, July 2002
4) LAFFITTE-1956: Laffitte, M., Crousier, J.-P.: Limites du domaine de stabilité du NiS hexagonal. c. R.Acad.Sc. 242(1956) pp.518-521 Laffitte, M.: Origine des variations de composition du NiS hexagonal. c. R.Acad.Sc. 243(1956) pp.58-61
5) RUBBERT-2018 F. Rubbert, Quality Director of SG Glass Solutions for Germany and Austria, Communication based on Internal technical SG report on NiS breakages in HST, End 2017
6) SCHNEIDER-HILCKEN-2012 Schneider, J., Hilcken, J., Kasper, A.: Ein Modell zur Bestimmung der Versagenswahrscheinlichkeit von heißgelagertem ESG. In: Glasbau 2012 (ISBN978-3-433-03021-9), pp.171-184
7) SWAIN-1980 Swain, M.V.: A fracture mechanics description of the microcracking about NiS inclusions in Glass. J. Non-Cryst. Solids 38&39(1980) pp451-456
8) SWAIN-1981 Swain, M.V.: NiS Inclusions in Glass: An Example of microcracking induced by a volumetric expanding Phase. J. Mat. Science 16(1981) pp. 151-158
9) YOUSFI-2010 : Yousfi, O., Kasper, A., Serruys, F.: Proposition to improve the efficiency of the HST according to EN14179-1. Verre 16(2010)n°1 pp.38-44
10) YOUSFI-2010 a Yousfi, O., P. Donnadieu, Y. Brechet, A. Crisci, A. Kasper, F. Serruys: Composition and microstructure of nickel sulphide stones found in tempered glass. Verre, 2010, 16, pp.30-35
11) YOUSFI-2011 Yousfi, O.,et al.: Phase transformations in NiS: microstructure, mechanisms and modelling through in situ microscopy. Solid state phenomena 172-174(2011) pp.402-40713-07-2011
1 - Architects: Hans Zwimpfer / Donald Judd. Pictures on internet e.g: https://stechphoto.photoshelter.com/; https://commons.wikimedia.org/wiki/File:Basel_-_2017_-_Peter_Merian_Haus.jpg
2 - If this is, in detail, different for the individual inclusions, the presumed general basic behavior according to a 1st order kinetic law assures that the average transformation rate would appear in this summary evaluation.
3 - i.e. we do not know how many out of the total numbers out of those inclusions present in annealed glass lead to breakages in HST or on building. However, we know that some factually do, and that the small (< 50 µm in HST; < 75 µm on buildings) are harmless. Consequently, the tacit assumption made by choosing the (175 ± 25) µm class as the reference is that in this one and the bigger classes the number of breakages in HST and on building were the same. This is not forcedly true but leads to a minimum estimation in the comparison. – Going a little more into detail: We found out that overall (i.e. for all classes together), 25% of the inclusions identified in annealed glass lead to glass breakage in a simplified HST. The estimation above is 7/12 = 58%. This shows that also in the reference class, not every inclusion yet causes a breakage in HST, but less than half of it. The same is true for the Building breakages, but because we see that much less of the smaller ones led to breakage here, we can exclude that the breakage rate in the reference class is higher than in HST.