Source: International Journal of Applied Glass Science: Volume 16, Issue 1
Authors: Kumiko Murakami, Souta Matsusaka, Sho Itoh, Hirofumi Hidai and Mitsuru Kitaichi
DOI: https://doi.org/10.1111/ijag.16686
Abstract
Wheel scribing on glass generates a vertical crack with a periodic stripe pattern beneath the wheel (hereafter referred to as the first crack). After the passage of the scribing wheel, sometimes seconds later, the first crack is repropagated with a smooth surface (the second crack). The second crack propagates to 90% or more of the glass thickness under suitable scribing conditions, facilitating the breaking process. The mechanism of secondary crack propagation has not been sufficiently explained in previous studies. Therefore, this study used analytical and experimental methods to examine stress distribution and crack propagation behavior during wheel scribing. Finite element analysis suggests that the increase in the stress intensity factor contributing to the propagation of the second crack was due to not only the crack opening force but also the bottom deformation of the glass specimen. An analytical model accounting for the bottom deformation can simulate the characteristic behavior, such as rapid deepening when the scribing load exceeds a specific threshold value, of the second crack. This study indicates that the elastoplastic deformation caused by wheel contact induces the deformation of the entire specimen, and the state of the bottom constraints is important for controlling the second crack.
1 INTRODUCTION
In recent years, information terminals with liquid crystals or organic light-emitting displays, such as graphic user interfaces, have become widespread. Glass has been used in many displays because of its superior transparency, scratch resistance, heat resistance, and corrosion resistance compared to resin materials. Displays are offered in various sizes and shapes, and it is necessary to cut the original large glass substrates into product shapes. Moreover, the state of the cut substrate edge affects the strength of the display, and ultimately, the product quality. Therefore, glass cutting is important in display panel manufacturing.
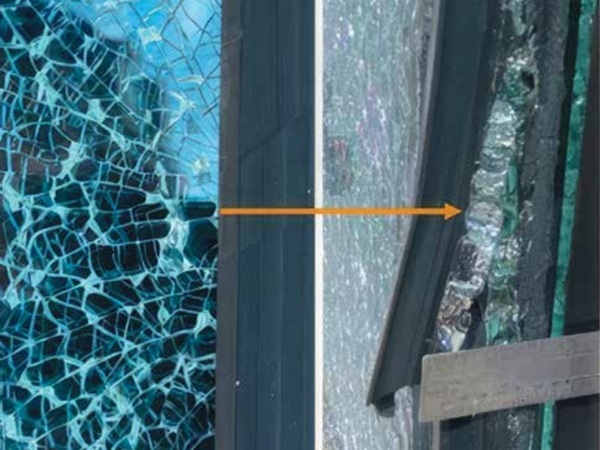
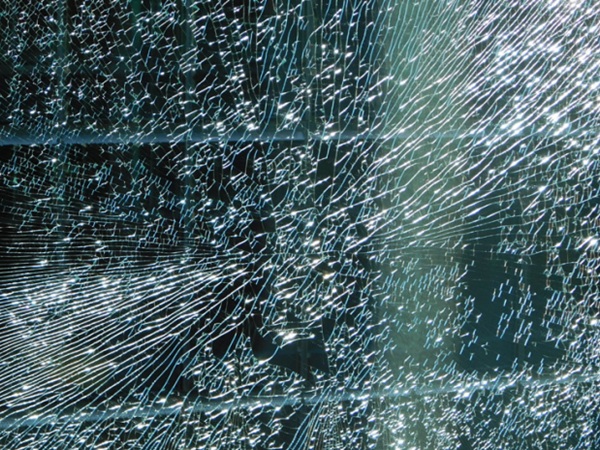
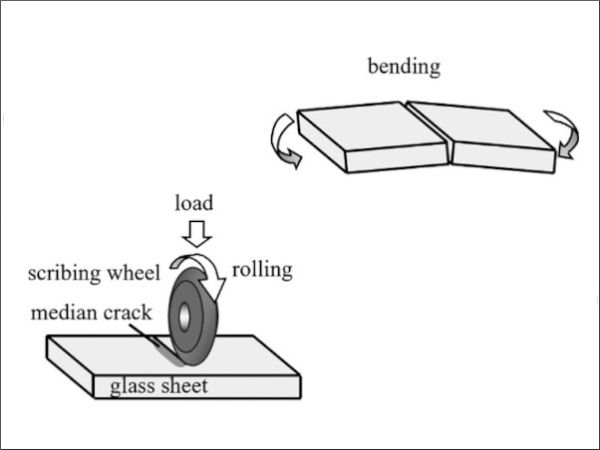
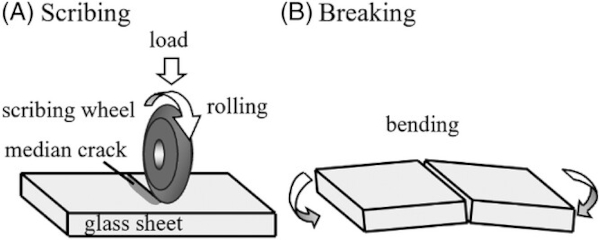
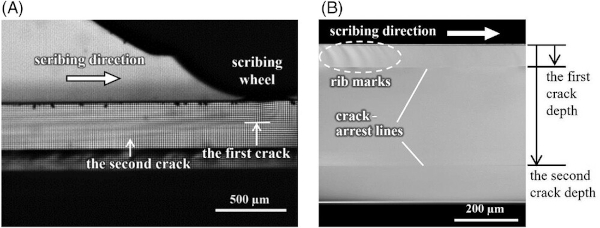
A widely used method for cutting glass involves scribing and breaking using scribing wheels.1 As shown in Figure 1, a load was applied perpendicularly to the scribing wheel and moved parallel to the glass surface. The scribing wheel was passively rotated by the frictional force with the glass, and a median crack was generated in the glass. The glass is separated by applying a bending force along the median crack. Figure 2A shows a captured image of the crack propagation behavior in glass during wheel scribing obtained by a high-speed camera from the lateral side, using a method from previous studies as a reference.2-4 Beneath the scribing wheel, the first crack was formed, followed by a deeper second crack. As shown in the figure, the second crack propagates as a repropagation of the first crack after the passage of the scribing wheel.2-5 In several cases, two horizontal crack-arrest lines were observed on the cutting surface, as shown in Figure 2B. A periodic stripe pattern known as the “rib mark” appeared near the glass surface. Below the upper crack-arrest line, a smoother surface was observed. The areas with rib marks and smooth surfaces were the surfaces of the first and second cracks, respectively. The area from the lower crack-arrest line to the bottom surface separated during the breaking process.
Display panels, in which some components are assembled between two sheets of glass, such as liquid crystal displays, are usually scribed on both the top and bottom surfaces. When median crack propagation is insufficient, a large bending deformation is required to split the glass substrate, leading to damage on the opposite side of the glass. Therefore, it was necessary to form a deep median crack to avoid damage during the breaking process. To date, several measures have been proposed to increase median cracks.6, 7 When the depth of the second crack reaches 90% or more of the glass thickness under suitable scribing conditions, the crack extension phenomenon is useful for glass cutting during manufacturing processes. The optimal scribing conditions for the second crack extension were empirically determined. Understanding the repropagation behavior of a median crack is necessary to promote and control the propagation of a second crack.
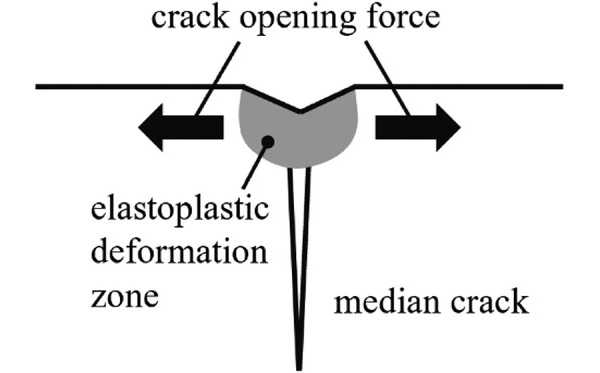
Many studies on indentation cracking have shown that contact with rigid bodies such as diamond indenters causes plastic deformation, even in brittle materials such as glass or ceramics.8-19 Currently, Johnson's model20 is widely accepted and can deal with stress fields in plastic deformation zones by assuming a hemispherical plastic core just beneath the indenter. The stress field inside the material can be analyzed by considering plastic deformation as an expansion of the hemispherical core. It has also been suggested that the strain mismatch between the plastic and surrounding elastic regions induces tensile stress as the driving force for various cracks.21-25 Lawn et al. indicated that the plastically deformed zone induced by indentation contact produces a normal force on the median crack plane, that is, the crack opening force shown in Figure 3.26 Swain et al. reported the behavior of the first crack as a function of the wheel's geometrical characteristics, scribing speed, and applied load.27-30 Thus, many studies have been conducted on the crack propagation behavior near glass surfaces, such as first cracks31, 32 or radial cracks.26, 33 However, there has been much less research on the second crack propagation than on the first crack propagation. Therefore, in this study, the secondary crack propagation behavior was experimentally observed, and the stress intensity factors (SIFs) were calculated using the finite element (FE) method to elucidate the mechanism of secondary crack propagation.
2 EXPERIMENTS
2.1 Experimental methods
The alkali-free glass slides (20 × 85 mm, EAGLE XG) of 400, 500, and 700 µm thicknesses were scribed. A scribing wheel made of sintered tungsten carbide with an edge angle of 120°, outer diameter of 2 mm and wheel tip radius of.4 µm was mounted on a wheel scriber (LS500; Mitsuboshi Diamond Industrial [MDI]) and used for scribing. The corners of the specimen were lightly fixed on a support stage with adhesive tape from above to prevent the horizontal movement of the specimen during scribing. Glass was used as the support stage because of its low surface roughness and flatness.
The type of support stage glass was the same as that used for the specimens. The applied load ranged from 3 to 9 N and was perpendicular to the glass surface. The scribing speed was set at 100 mm/s. Scribing lines were formed longitudinally at the center of the specimen. During scribing, the scribing wheel was moved from the outside to the surface of the specimen and stopped approximately 2 mm from the edge. The experimental conditions were at a temperature range of 22–25°C and a humidity range of 11%–23%. After 15–24 h, when the cracks had fully propagated, the specimens were manually separated along the scribe lines. Cut planes were observed under a laser microscope (LEXT OLS4000; OLYMPUS).
2.2 Experimental results
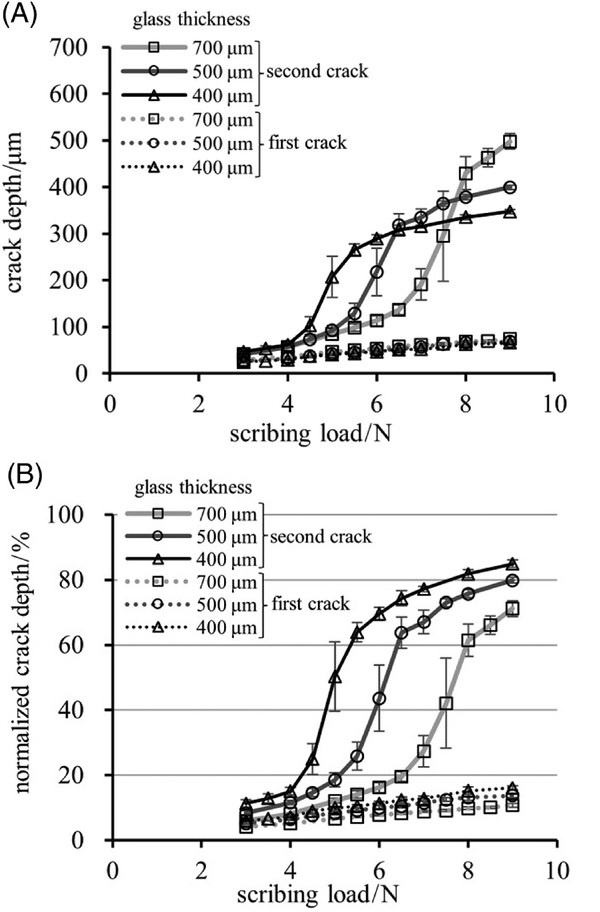
The variations in the first and second crack depths with scribing load are shown in Figure 4A, and the first and second crack depths normalized by the glass thickness are shown in Figure 4B. Each plot represents the average of the results of eight trials, and the error bars indicate standard deviations. As noted in previous studies,4, 29 the first crack depth increased linearly with increasing load and was independent of the glass thickness (Figure 4A). In contrast, the second crack depth demonstrated distinctive properties. When the scribing load was less than 4 N, the second crack depth did not depend on the glass thickness and was determined by the scribing load (Figure 4A). When the crack depth reached approximately 20% of the glass thickness, the inclination of the depth curve increased (Figure 4B). Ono et al. and Tomei et al. reported that the second crack depth suddenly increased above a certain threshold load with increasing scribing load,4, 34 which is in good agreement with our experimental results. When the crack depth exceeded 60%, the inclination was gradual again. The scribing loads with the largest inclination were 5 N for a thickness of 400 µm, 6 N for 500 µm, and 7.5 N for 700 µm. The threshold load increased with increasing thickness. This relationship between scribing load and crack depth is a characteristic behavior only for the second crack.
3 NUMERICAL CALCULATIONS
Numerical analyses were conducted using an FE program (ANSYS MAPDL 2023 R1, ANSYS Inc.) to investigate the deformation behavior and calculate the SIFs. The schematic illustrations of the FE models are shown in Figure 5. The FE models were two-dimensional models symmetrical to the centerline (y-axis), and the indentation of a triangular body simulated the wheel motion. In the numerical analysis, we focused on the second crack. No additional plastic deformation was estimated to have occurred behind the wheel where the second crack propagated. The permanent strain was regarded as constant in the scribing direction. Therefore, we recognized that the basic characteristics of the second crack can be verified using with a two-dimensional analysis. The width of glass models was 10 mm, and the thickness was 400 µm, 500 µm, and 700 µm. The elastoplastic elements with a mesh size of.5 µm were placed in an area of 24 × 44 µm underneath the wheel.
At the maximum load applied in this study, the elastoplastic element region was set to include the entire plastic deformation region and to have the smallest size. Elastic elements have been used in other areas. The Young's modulus and Poisson's ratio were 73.6 GPa and .23, respectively.35 Bilinear isotropic hardening was assumed, and the yield stress and the plastic tangent modulus were 3.5 GPa and 1 GPa,4 respectively. The support stage and scribing wheel were assumed to be rigid. The effect of gravity is ignored. The symmetrical plane on the y-axis was constrained by symmetric boundary conditions. The bottom surface of the glass along the x-axis was constrained on the support stage. Initially, it was assumed that the bottom constraints did not affect the numerical analysis results. Subsequently, as described in Section 4.1, based on the results of the initial model (constrained FE model), the model was improved to eliminate the bottom constraints (unconstrained FE model).
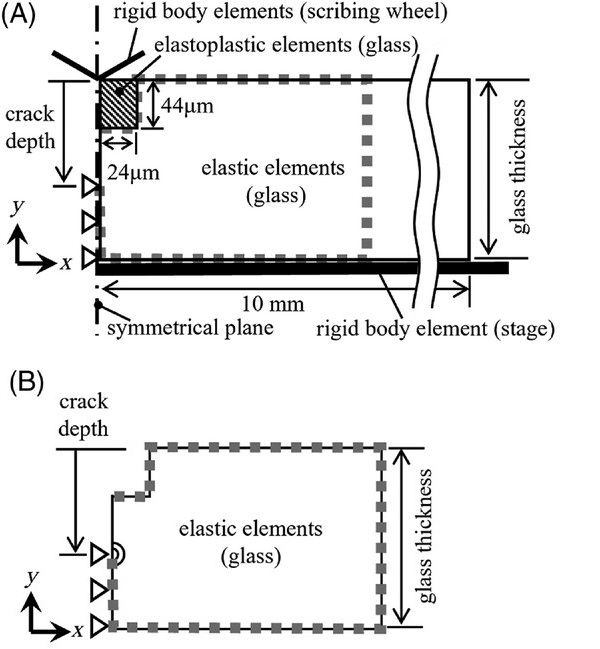
The scribing wheel was indented perpendicular to the x-axis. After the fully applied load was attained, it was removed. Subsequently, a median crack (i.e., a second crack) was formed by deleting the constraints on the symmetrical plane on the y-axis. In advance, the contact elements were placed on the y-axis in the elastoplastic region to simulate the contact between two glass surfaces opposite each other on a symmetrical plane. The SIFs were calculated using the submodel to reduce calculation costs. A schematic illustration of the submodel is presented in Figure 5B. In the global model, the stresses and strains were concentrated within a width equivalent to the glass thickness. The width of the submodel was set to twice the glass thickness to allow for a margin. The displacements obtained from the global model were imposed on the dotted lines of the submodel as boundary conditions. Finally, to simulate the glass separation along the y-axis, the symmetrical constraints from the glass surface to a 90% depth of thickness were released and the contact elements on the y-axis in the elastoplastic region were deleted.
4 DISCUSSION
4.1 Estimation of the second crack depth by the FE calculation
Assuming that a crack propagates only when the SIF exceeds the fracture toughness, the crack depth can be estimated using the applied load. The fracture toughness value is .75 MPa m for the general glass.28 The SIFs were calculated at every 10% of the glass thickness in the depth direction at every 10 mN/µm of the applied load. The crack depth at which the SIF was equal to the fracture toughness was determined by linear interpolation, and is plotted in Figure 6A. Although the crack depth increased linearly with the applied load, no rapid increase was observed above a certain threshold. This result is inconsistent with the characteristic behavior of the second crack propagation (see Figure 4) and suggests that our FE model does not fully reproduce the experimental conditions.
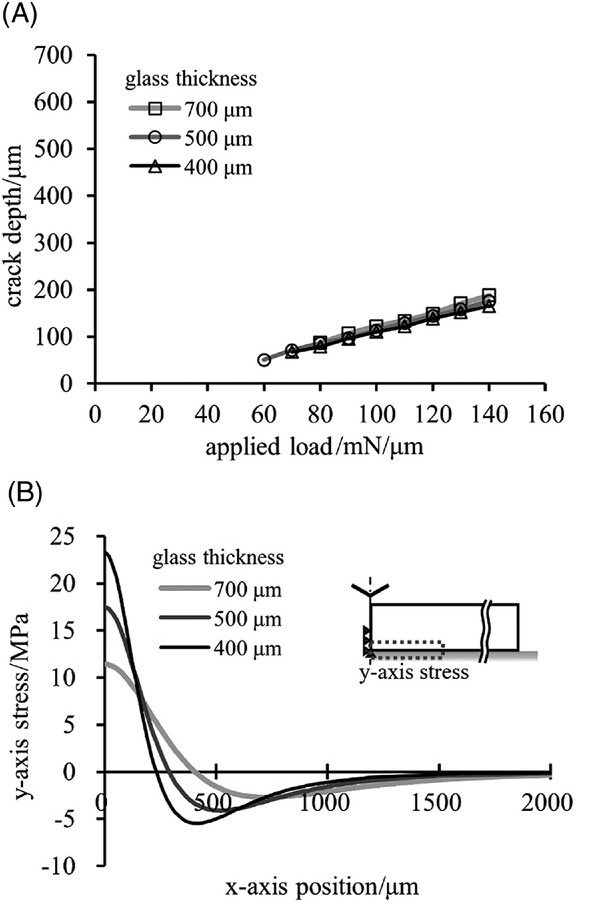
The stress distribution inside the glass was calculated to investigate the reason for the discrepancy between the analytical and experimental results. For example, Figure 6B shows the y-axis stress distribution at the bottom surface when the applied load is 100 mN/µm, and the crack depth is 50% of the thickness. The maximum stress increased as glass thickness decreased. Although it was assumed that the wheel indentation did not affect the bottom surface because plastic deformation occurred in a tiny top surface region, this result suggests that plastic deformation could influence the stress distribution at the bottom surface. The closeness between the plastic deformation and the bottom surface increased the maximum stress. The bottom surface behaved differently depending on the glass thickness. In the model described above, no bottom deformation occurs because the deformation is completely constrained. Therefore, to improve the calculation model, the FE model must consider bottom surface deformation.
4.2 Estimation of the secondary crack depth using the unconstrained FE model
To consider the deformation of the glass bottom surface, the latter was unconstrained as follows: After calculating the loading/unloading processes using the previously described method, the nodes of the glass bottom surface were fixed at their current displacements, the support stage elements were deleted, and an analysis was performed. Subsequently, the reaction forces on the nodes at the glass bottom surface were applied ramped to zero, and the analysis was repeated. To inhibit the rigid-body motion of the model, the displacement in the y-axis direction at the origin, that is, the intersection of the bottom surface and the y-axis, was constrained. In practice, the parameters associated with the support stage (e.g., friction with the stage, the glass's self-weight, and the glass's constrained state) would affect the results. However, the support stage was removed to simplify the phenomenon and understand the intrinsic motion of the glass. Crack-depth estimation was performed in a manner similar to that described above. The results obtained using the unconstrained models are shown in Figure 7A.
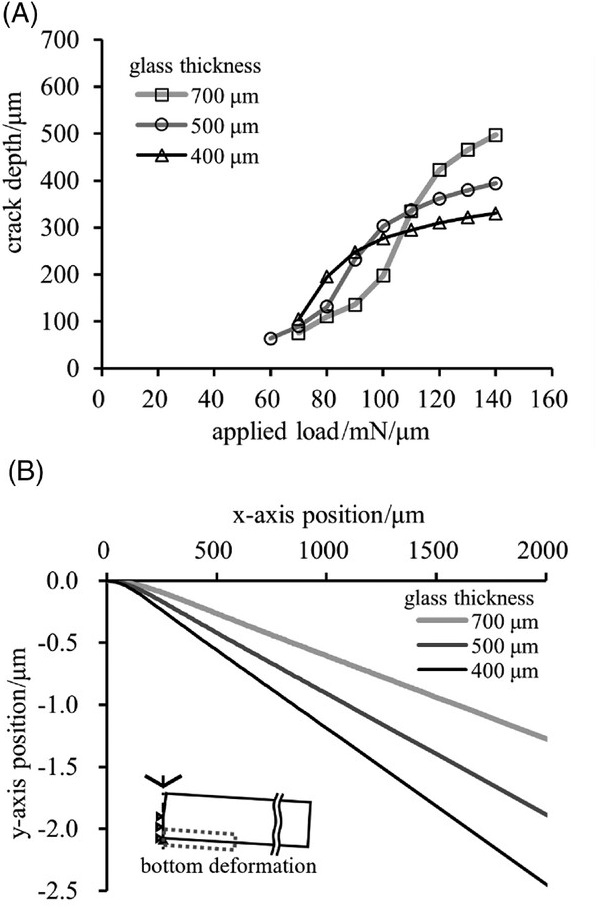
By removing the constraints at the glass bottom, a different result was obtained compared with that in Figure 6A. In Figure 7A, a rapid increase in the crack depth is confirmed when the indentation load exceeds a threshold value, and the threshold load increases as the glass thickness increases. These characteristics are in good agreement with those of the second crack, as shown in Figure 4A. Figure 7B shows the bottom shape of glass when the applied load is 100 mN/µm and the crack depth is 50% of the thickness. Bending deformation occurred around the symmetrical plane and the amount of deformation decreased with increasing glass thickness.
Figure 8A shows the contact force that the elastoplastic elements received from their counterparts facing across the symmetric plane when the crack depth was changed. As shown in Figure 8A, the contact force decreased with the crack growth. No other external force values were used for the calculations. Here, it should be noted that the contact force induced not only the crack propagation but also the deformation of the glass.
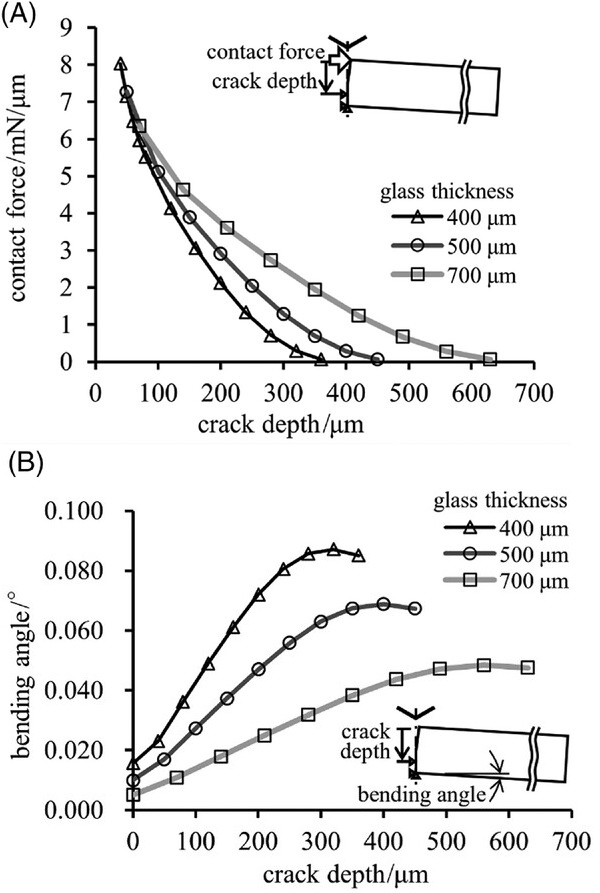
Figure 9 shows the deformation of the elastoplastic element of the FE model with a thickness of 500 µm and load of 100 mN/µm, before and after the breaking process. In Figure 9A, the color contours represent the first principal plastic strain magnitude, and the arrows indicate the strain directions at representative locations. The region of the positive first principal plastic strain, indicated on the left side of the dashed line in Figure 9A, is approximately equal to the permanent deformation region, outside of which lies the elastic deformation region. The permanent deformation by the surface indentation contains a positive permanent strain in the horizontal direction. After the breaking process, the elastoplastic elements on the y-axis horizontally overhang owing to the positive permanent strain in the horizontal direction and recovery of elastic deformation. Figure 9B shows a view of the outer shapes magnified along the x-axis direction. Before the breaking process, the overhanging elements were pushed against the counterpart contact element. This contact force generated a compressive stress in the x-axis direction, resulting in a crack opening force and bottom deformation.
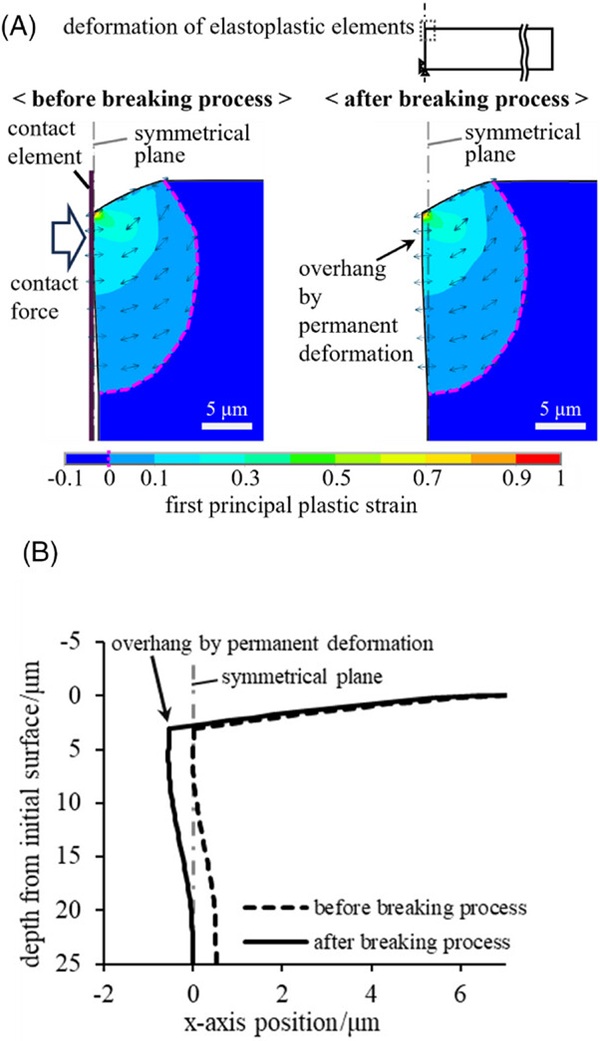
The first principal plastic strain distribution and external shape in Figure 9A,B were approximately identical for 400 and 700 µm thicknesses at the same load. These plots are omitted herein because of the overlapping lines. A rigid body was used as the support stage in the numerical analysis, whereas the support stage used in the experiment was composed of glass. If the material properties of glass were used for the support stage in the numerical analysis, then the effect of thickness on plastic deformation would be less significant, and the characteristics of the second crack propagation would presumably remain the same.
Here, the bending angle was defined as the angle between the x-axis and a line connecting two points: a point on the bottom surface distant from the origin by the thickness of the glass and a point at the side and bottom corners. Figure 8B shows changes in bending angles with the median crack depth when the applied load was 100 mN/µm. In all cases, the bending angle increased as the median crack depth increased. However, it decreases when the crack depth exceeds 80% of the glass thickness. This was because the length of the overhang at the top surface was the upper limit of the crack gap. Accordingly, the bending angle decreased when the crack gap reached its upper limit. As shown in Figure 8B, the calculated bending angles were negligible. However, the estimated median crack depth changed remarkably when bending deformation was considered. Therefore, it is concluded that bottom deformation has a decisive influence on the propagation behavior of the second crack.
4.3 Effect of bottom deformation on stress intensity factor
Figure 10A plots a relationship between median crack depth and SIF to clarify the effect of the glass bottom deformation. The glass thickness and the applied load were 500 µm and 100 mN/µm, respectively. As can be seen, in both the constrained (solid line with cross mark) and the unconstrained (solid line with filled circle) FE models, the SIFs decrease as the median crack depth increases. However, the shapes of the two curves differ significantly, especially when the crack depth exceeds 20% of the thickness. In the unconstrained FE model, the curve gradient decreases significantly when the crack becomes deeper than 20% of the thickness, and increases again with crack growth. The curve gradient in the constrained FE model decreases consistently and gradually as the crack depth increases. Because the SIFs for the unconstrained FE models are larger than those for the constrained FE models, the median crack tends to be deeper when the bottom deformation is allowed.
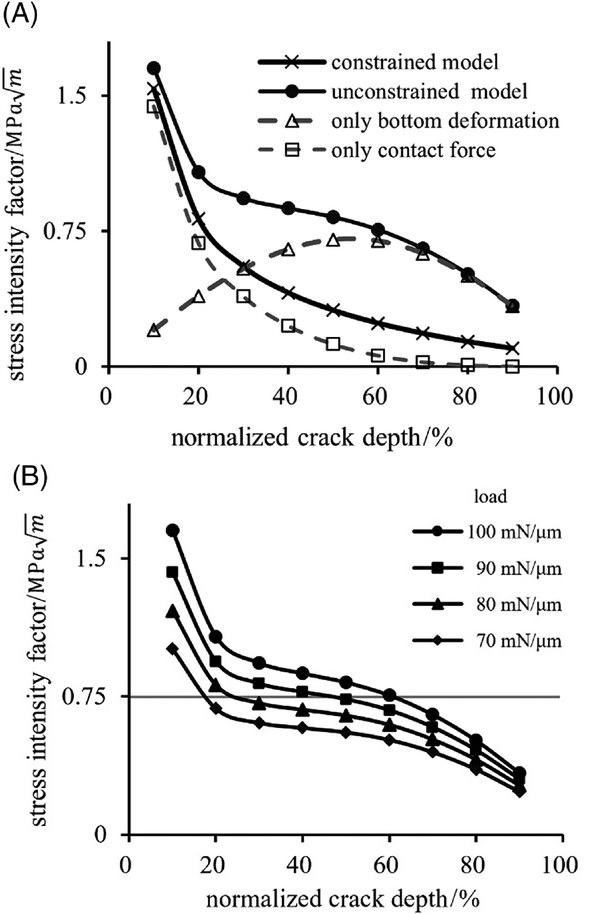
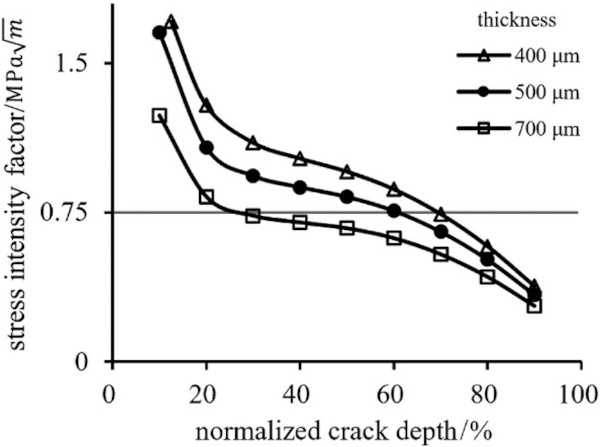
Figure 10B shows the variations of SIF with the applied loads when the glass thickness is 500 µm. As the applied load increases, the SIFs shift upward. However, no significant change was observed in the shape of the curve. The small gradient of the SIF curves in the region of 20%–60% of the crack depth indicates that the crack propagates rapidly when the SIF exceeds the fracture toughness. Assuming that fracture toughness is .75 MPa m, for example, the crack depth is estimated to grow from approximately 17% for 70 mN/µm, 24% for 80 mN/µm, and 48% for 90 mN/µm.
The crack-depth range where the gradient of the SIF curve is small is consistent with that where the median crack rapidly deepens, as shown in Figures 4 and 7A. Therefore, the characteristic shape of the SIF curve causes the rapid growth of the second crack when the threshold load is exceeded. To confirm the contribution of the glass bottom deformation to the SIF, numerical analyses were performed under the following two conditions, and the results were compared. (1) The glass model was subjected to bottom deformation without contact force. (2) The glass model was subjected to a contact force, and its bottom was constrained on the support stage. The calculated results of SIF when the glass thickness and the indentation load were 500 µm and 100 mN/µm are shown in Figure 10A.
The dashed lines with triangles and squares represent the SIF calculated for cases (1) and (2), respectively. It was found that the contribution of the contact force to the SIFs was large for small crack depths, and decreased with increasing crack depth. For crack depths greater than 30% of the thickness, the contribution of bottom deformation exceeded that of contact force. When crack depth was greater than 70%, the effect of bottom deformation became dominant. It should be noted that in both cases (1) and (2), fracture occurs in mode I (opening mode); therefore, the principle of superposition can be applied to the SIF calculation.36, 37 The SIFs obtained for the two conditions agreed accurately with the results of the unconstrained FE model (solid lines with filled circles). It follows that the characteristic propagation behavior of the second crack is not only due to the crack opening force, but also to the glass bottom deformation.
4.4 Influence of glass thickness on stress intensity factor
Figure 11 shows the variations of SIF with the glass thickness under the applied load of 100 mN/µm. The SIF curves for 400 and 700 µm are similar to that for 500 µm and shift downward as the thickness increases. Therefore, the greater the glass thickness, the greater is the applied load required for the SIF to reach the fracture toughness. This result indicates that the threshold load for rapid crack propagation increases with the thickness; this result is in good agreement with the experimental results. Empirically, the thicker the glass, the more difficult it is to form a deep median crack during wheel scribing because the large thickness has an effect similar to that of the bottom constraint. In addition, the median crack depths at low applied loads were almost the same, regardless of the glass thickness, as shown in Figure 4. This was presumably because the deformation at the bottom was small. Within the low-load range, the unconstrained and constrained FE models were equivalent for the same reason.
5 CONCLUSION
This study aimed to elucidate the mechanism of secondary crack propagation during wheel scribing through experimental and numerical analyses. The experimental results indicate that the secondary crack propagated rapidly when the applied load exceeded a certain threshold. This characteristic behavior cannot be explained by the concept that only the crack opening force beneath the wheel drives crack propagation. The results of the FE analysis indicated that the contact force between the two facing crack surfaces caused not only crack growth, but also bending of the glass substrate when the glass bottom was not constrained. Thus, the bottom deformation significantly affected the second crack propagation. This understanding provides another control for glass scribing and another perspective on the contact fracture of brittle solids. The behavior of glass in three dimensions should be discussed in the future to obtain a better understanding of crack propagation.
ACKNOWLEDGMENTS
The authors have nothing to report.
REFERENCES
1Smirnov MI, Spiridonov YA, Karapetyan AR. Modern sheet-glass cutting technologies. Glass Ceram. 2011; 68(1–2): 6–10. https://doi.org/10.1007/s10717-011-9310-3
2Matsusaka S, Mizobuchi G, Hidai H, Chiba A, Morita N, Onuma T. Observation of crack propagation behavior and visualization of internal stress field during wheel scribing of glass sheet. J Jpn Soc Precis Eng. 2015; 81(3): 270–275. (in Japanese). https://doi.org/10.2493/jjspe.81.270
3Hasegawa R, Matsusaka S, Hidai H, Chiba A, Morita N, Onuma T. In-process estimation of fracture surface morphology during wheel scribing of a glass sheet by high-speed photoelastic observation. Precis Eng. 2017; 48: 164–171. https://doi.org/10.1016/j.precisioneng.2016.11.017
4Tomei N, Murakami K, Fukunishi T, Yoshida S, Matsuoka J. Direct observation of crack propagation in a liquid crystal display glass substrate during wheel scribing. Int J Appl Glass Sci. 2018; 9(1): 105–113. https://doi.org/10.1111/ijag.12272
5Swain MV. Median crack initiation and propagation beneath a disc glass cutter. Glass Technol. 1981; 22(5): 222–229.
6Tsai CH, Huang BW. Diamond scribing and laser breaking for LCD glass substrates. J Mater Process Technol. 2008; 198(1–3): 350–358. https://doi.org/10.1016/j.jmatprotec.2007.07.017
7Liao YS, Yang GM, Hsu YS. Vibration assisted scribing process on LCD glass substrate. Int J Mach Tools Manuf. 2010; 50(6): 532–537. https://doi.org/10.1016/j.ijmachtools.2010.03.004
8Marsh DM. Plastic flow in glass. Proc R Soc London Ser A Math Phys Sci. 1964; A279: 420–435. https://doi.org/10.1098/rspa.1964.0114
9Hagan JT, Swain MV. The origin of median and lateral cracks around plastic indents in brittle materials. J Phys D: Appl Phys. 1978; 11(15): 2091. https://doi.org/10.1088/0022-3727/11/15/007
10Arora A, Marshall DB, Lawn BR, Swain MV. Indentation deformation/fracture of normal and anomalous glasses. J Non-Cryst Solids. 1979; 31(3): 425–428. https://doi.org/10.1016/0022-3093(79)90154-6
11Marshall DB, Lawn BR, Chantikul P. Residual stress effects in sharp contact cracking: part 2 strength degradation. J Mater Sci. 1979; 14: 2225–2235. https://doi.org/10.1007/BF00688429
12Hagan JT. Shear deformation under pyramidal indentations in soda-lime glass. J Mater Sci. 1980; 15: 1417–1424. https://doi.org/10.1007/BF00752121
CASWeb of Science®Google Scholar
13Chiang SS, Marshall DB, Evans AG. The response of solids to elastic/plastic indentation. I. Stresses and residual stresses. J Appl Phys. 1982; 53(1): 298–311. https://doi.org/10.1063/1.329930
CASWeb of Science®Google Scholar
14Lawn BR, Marshall DB. Indentation fractography: a measure of brittleness. J Res Nat Bur Stand. 1984; 89(6): 435. https://doi.org/10.6028/jres.089.024
15Tanaka K. Elastic/plastic indentation hardness and indentation fracture toughness: the inclusion core model. J Mater Sci. 1987; 22: 1501–1508. https://doi.org/10.1007/BF01233154
16Cook RF, Pharr GM. Direct observation and analysis of indentation cracking in glasses and ceramics. J Am Ceram Soc. 1990; 73(4): 787–817. https://doi.org/10.1111/j.1151-2916.1990.tb05119.x
CASWeb of Science®Google Scholar
17Sglavo VM, Green DJ. Influence of indentation crack configuration on strength and fatigue behaviour of soda-lime silicate glass. Acta Metall Mater. 1995; 43(3): 965–972. https://doi.org/10.1016/0956-7151(94)00335-F
CASWeb of Science®Google Scholar
18Fischer-Cripps AC. Introduction to contact mechanics. New York: Springer; 2007.
19Kassir-Bodon A. Raman mapping of the indentation-induced densification of a soda-lime-silicate glass. Int J Appl Glass Sci. 2012; 3(1): 29–35. https://doi.org/10.1111/j.2041-1294.2012.00078.x
CASWeb of Science®Google Scholar
20Johnson KL. Contact mechanics. Cambridge: Cambridge University Press; 1987.
21Lawn BR, Swain MV. Microfracture beneath point indentations in brittle solids. J Mater Sci. 1975; 10: 113–122. https://doi.org/10.1007/BF00541038
CASWeb of Science®Google Scholar
22Marshall DB, Lawn BR. Residual stress effects in sharp contact cracking: part 1 indentation fracture mechanics. J Mater Sci. 1979; 14: 2001–2012. https://doi.org/10.1007/BF00551043
23Haranoh T, Ishikawa H, Shinkai N, Mizuhashi M. Crack evolution in Vickers indentation for soda-lime-silica glass. J Mater Sci. 1982; 17: 1493–1500. https://doi.org/10.1007/BF00752265
CASWeb of Science®Google Scholar
24Liao YS, Yang GM, Hsu YS. Effect of geometrical characteristics of a scribing wheel on the bending strength of LCD glass substrates. J Soc Inf Disp. 2009; 17(3): 287–291. https://doi.org/10.1889/JSID17.3.287
25Rouxel T. Driving force for indentation cracking in glass: composition, pressure and temperature dependence. Philos Trans R Soc A Math Phys Eng Sci. 2015; 2038(373):20140140. https://doi.org/10.1098/rsta.2014.0140
26Lawn BR, Evans AG, Marshall DB. Elastic/plastic indentation damage in ceramics: the median/radial crack system. J Am Ceram Soc. 1980; 63(9–10): 547–581. https://doi.org/10.1111/j.1151-2916.1980.tb10768.x
27Swain MV, Metras JC, Guillemet CG. A deformation and fracture mechanics approach to the scoring and breaking of glass. J Non-Cryst Solids. 1980; 38: 445–450. https://doi.org/10.1016/0022-3093(80)90459-7
28Cook RF. Deformation and fracture by sharp rolling contacts. J Am Ceram Soc. 1994; 77(5): 1263–1273. https://doi.org/10.1111/j.1151-2916.1994.tb05401.x
29Ono T, Tanaka K. Effect of scribe-wheel dimensions on the cutting of AMLCD glass substrate. J Soc Inf Disp. 2001; 9(2): 87–94. https://doi.org/10.1889/1.1828775
30Pan CT, Hsieh CC, Su CY, Liu ZS. Study of cutting quality for TFT-LCD glass substrate. Int J Adv Manuf Technol. 2008; 39: 1071–1079. https://doi.org/10.1007/s00170-007-1293-4
31Lawn BR, Evans AG. A model for crack initiation in elastic/plastic indentation fields. J Mater Sci. 1977; 12: 2195–2199. https://doi.org/10.1007/BF00552240
CASWeb of Science®Google Scholar
32Sglavo VM, Green DJ. Subcritical growth of indentation median cracks in soda-lime-silica glass. J Am Ceram Soc. 1995; 78(3): 650–656. https://doi.org/10.1111/j.1151-2916.1995.tb08227.x
CASWeb of Science®Google Scholar
33Marshall DB, Lawn BR. Flaw characteristics in dynamic fatigue: the influence of residual contact stresses. J Am Ceram Soc. 1980; 63(9–10): 532–536. https://doi.org/10.1111/j.1151-2916.1980.tb10759.x
34Ono T, Pai G, Teng O, Gildea M, Zenteno L, Helfinstine J, et al. 69.4: Superior cuttability performance of jade glass for thin and strong mobile displays. SID Symp Dig Tech Pap. 2009; 40(1): 1052–1055. https://doi.org/10.1889/1.3256469
35 EAGLE XG® Product information sheet. Corning Incorporated.
36Anderson TL. Fracture mechanics fundamentals and applications. Boca Raton: CRC Press; 2017.
37Wang CH. Introduction to fracture mechanics. Melbourne, Victoria: DSTO Aeronautical and Maritime Research Laboratory; 1996.