Source:
Challenging Glass 7
Conference on Architectural and Structural Applications of Glass
Belis, Bos & Louter (Eds.), Ghent University, September 2020.
Copyright © with the authors. All rights reserved.
ISBN 978-94-6366-296-3, https://doi.org/10.7480/cgc.7.4492
Authors:
Christian Scherer
Thomas Scherer
Wolfgang Wittwer
Thomas Schwarz
Ernst Semar
H.B. Fuller | Kömmerling, Pirmasens, Germany

Since time began there has been a strong fascination in foreseeing the behavior of buildings and constructions. Now In order to predict this behavior, we use experimental, and increasingly more time-and cost-effective, computational simulations. Finite Element Analysis (FEA) is a method that has become increasingly prevalent and has become firmly established in aviation and vehicle construction for decades. In recent years, there has been a marked growth in the use of numerical simulations for the verification of adhesive bonds, particularly in façade development where polymeric materials such as sealants or thermoplastic spacers are becoming increasingly important.
This is partly driven by their expansion stress behavior, which differs greatly from the classic linear behavior of established materials such as aluminum, steel or glass. The present work uses non-linear material laws for FEA and exhibits the behavior of the sealant joint in various load scenarios on several projects. The presented case studies show that the developed calculation methods can be used to describe polymeric materials very precisely and thus simulate a wide variety of load scenarios on glued components in time and money saving manner.
1. Introduction
Glued connections are generally recognised as amongst the most universal of connection technologies with almost all technically usable materials being joined using adhesive technology. Adhesives are therefore increasingly being used in structural applications due to versatility and continual technological progress that allows the use of tailor-made and application-oriented production techniques. Correspondingly, bonded connections can be found in numerous applications, primarily in the field of structural glass & lightweight construction for joining structural elements.
Even in the early development and construction phases, simulations are often used for time & cost reasons in order to shorten development times, identify weak points and optimize component and adhesive joint geometry. Since the 1970s, finite element analysis (FEA) has increasingly been used for the numerical calculation of structural problems where these cannot be solved exactly using analytical methods. FEA has the clear advantage in that the mechanical properties of an adhesive in almost any geometrical shape can be determined under different load conditions.
This method is also able to determine stress and strain distributions in composite structures that result from an applied force or displacement. The accuracy of the design calculations depends on the validity of the material models used in the analysis to describe the deformation behavior of the adhesive and the adhesive surfaces, and the availability of suitable material parameters for these models.
Many adhesives, especially elastomers, show a complicated stress-strain behavior due to their three-dimensional network structure with quasi-static stress demonstrating clear differences between the tensile and compressive load range. This behavior can no longer be described by linear calculation methods; rather, non-linear calculation methods must be developed and used. This article describes the development of nonlinear material models for the description of polymeric materials and their application using various examples.
2. Procedure
The material behavior of polymeric materials can usually only be described relatively inaccurately using linear material laws. It depends on the loading speed, the type of loading, the temperature and also on the thermomechanical history of the material or the component made from it. At the same time, the requirement for the accuracy of calculations tends to increase. The parameterization or even development of nonlinear material models that depict a large number of these properties is very time-consuming and therefore costly.
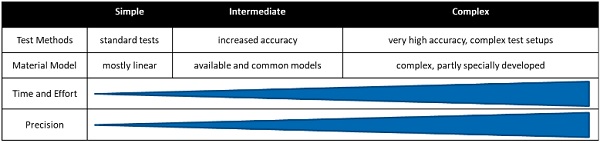
In order to be able to work efficiently in this environment, it is essential to determine the required accuracy in advance of a calculation. For this purpose, it can be useful to carry out relatively simple calculations with less complex material models in an early concept phase in order to gain basic knowledge. Conversely, simpler models often do not provide the necessary accuracy for detailed considerations. Figure 1 illustrates the different levels in terms of accuracy and effort.
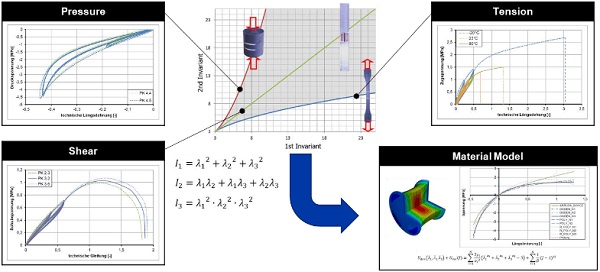
When selecting suitable test methods, it is necessary to know the load case to be mapped, and the required accuracy, as precisely as possible in order to be able to select suitable tests or test setups. For the parameterization of non-linear material models, tests with several load modes are usually necessary, which may also be carried out at different temperatures and speeds. Figure 2 shows an example of the test selection for the parameterization of a hyperelastic material model. The experiments span the field of possible deformations (gray) in the diagram of the second over the first invariant of the deformation tensor (cf. Baaser, H. 2010, Scherer, T. 2014, Weiß, R., Osen, E., and Baaser, H. 2010).
The selection of tests shown in Figure 2 is only an example, further or different tests are conceivable (see e.g. Drass, M., Schwind, G., Schneider, J., and Kolling, S. 2017). A material model that has been reversely parameterized by the measured force-deformation curves is then validated in order to be able to assess and validate its predictability for real applications. This is usually done by comparing the measurement data of a test with the most complex deformation state possible with the calculation based on the parameterized model (as e.g. in Scherer, T. 2014).
In the following, the basic procedure is illustrated using examples, and the results obtained are briefly described. The aim is to give the broadest possible overview of the possibilities rather than to describe each example in detail.
3. Proof of strength for L-shaped adhesive connections of solar thermal modules
3.1. Task
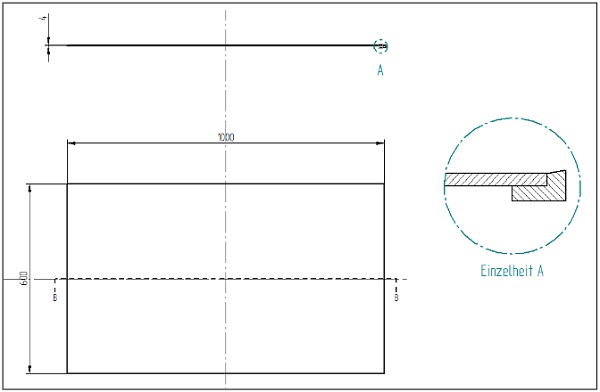
Here, for example, an L-shaped adhesive joint (two component structural silicone adhesive) is to be dimensioned, which fixes a glass pane (thickness d = 4 mm) in an aluminum frame. Such adhesive joints are common, for example, in solar thermal collectors. The dimensioning of this joint geometry is not based on international standards such as covered the EOTA ETAG 002 (EOTA - European Organisation for Technical Approvals. 2012). The dimensions of the pane and the shape of the L-joint are shown in Figure 3. In the present example, a wind load case with wind suction of 2400 Pa is calculated. The aim is to evaluate the loads on the adhesive.
3.2. Model
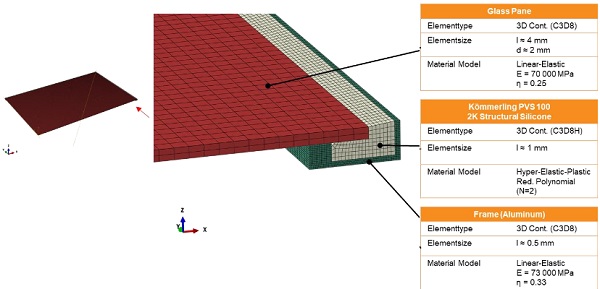
In this application a nonlinear material model is used for the adhesive, while a linear-elastic approach is used for the substrate materials. The model is described in more detail in Figure 4.
In addition to the selected material models, a design size must be specified here that is suitable for evaluating the load in the adhesive. For this purpose, design strain energy is calculated from the design values according to EOTA ETAG 002, which can only be used for pure tensile or tensile shear loads, which is then suitable for multi-axis stress-strain states. The procedure is described in more detail in (Scherer, T., Wittwer, W., Scherer, C., and Semar, E. 2018). This gives the design value described in Equation 1.

with Udes design strain energy.
3.3. Results
The result of the calculation for the strain energy density is shown below (Figure 5).
![Fig. 5 Deformation energy density [J / mm³] in the cross section of the L-shaped adhesive joint (long side a), corner b), short side c)).](/sites/default/files/inline-images/Fig5_132.jpg)
The section through the long and short side as well as through the module corner is displayed. The results clearly indicate the critically stressed areas in the adhesive. They occur where relatively thin adhesive layer thicknesses connect the two substrates and the load caused by large impediments to transverse expansion has high hydrostatic proportions. The model provides valuable insights into dimensioning and geometry optimization for the described component.
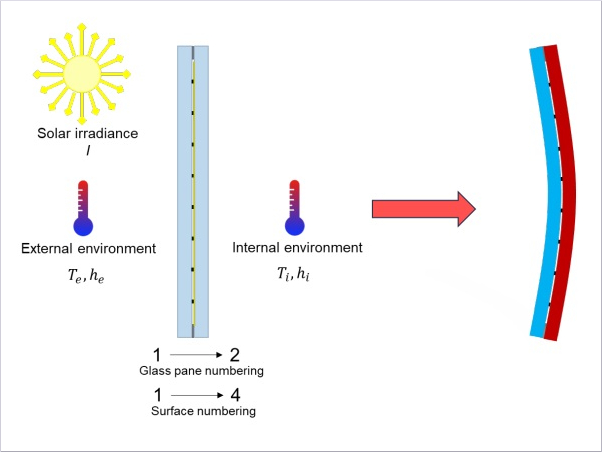
4. FEA of cold-bent insulating glass units
4.1. Task
This example shows the calculation of an initially flat insulating glass unit, which is then bent when installed in an aluminum substructure in order to be able to achieve a curved shape. The demand for such applications is currently growing strongly, because it allows optically very elegant and sophisticated shapes for the building envelope. An example of such an application is the biaxial curved roof of the Chadstone Shopping Center in Melbourne, Australia. The roof can be seen in Figure 6. The loads on the edge bond of the insulating glass unit are to be examined.

4.2. Model
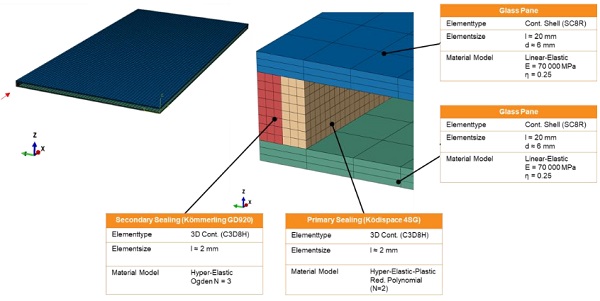
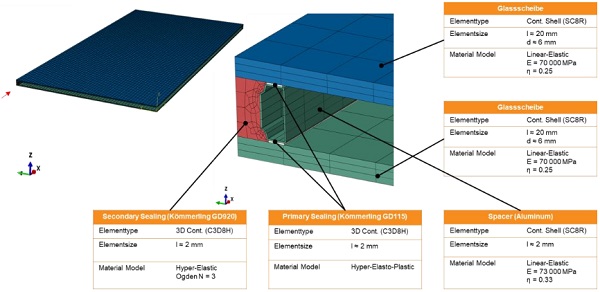
Non-linear material models are used for the secondary sealing as well as for the primary seals (Ködispace 4SG in the first model and Kömmerling GD 115 in the second model) for the comparative calculation of two alternative insulating glass structures. The glass panes are mapped linearly and elastically. The models are described in more detail in Figures 7 and 8.
4.3. Results
The bending causes a shear deformation in the edge bond, which is transferred to the edge bond via the frame and the glass panes. Fig. 9 shows the shear deformations in the edge bond. The results clearly show the advantages of Ködispace 4SG in such load cases.
![Fig. 9 Comparison of the shear deformations occurring [ ] for the model with a conventional spacer (left) and Ködispace 4SG (right).](/sites/default/files/inline-images/Fig9_64.jpg)
Due to the significantly increased layer thickness, the deformations (here shear deformations) are distributed over the entire cross-section and the maximum deformations are almost 10 times smaller. These results are described in more detail in (Scherer, C., Scherer, T., Semar, E., and Wittwer, W. 2019), whereby the loads in the aluminum spacer are also considered.
5. Effect of pressure load on IG units during curing
5.1. Task
In the production of insulating glass, the freshly manufactured units are stacked in packages immediately after production with a slight angle of inclination from the vertical. A part of the weight of the units above acts on the lowest IG unit. It should be estimated which deformations occur in the edge bond. The behavior of units with a thermoplastic spacer should be considered in particular.
Here, a 1000 mm x 2000 mm IG unit with a window space of 16 mm is considered.
5.2. Model
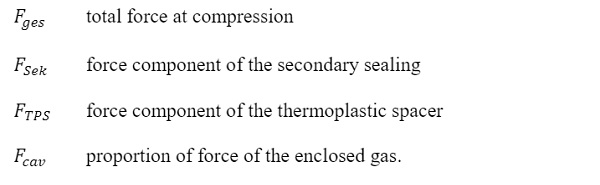
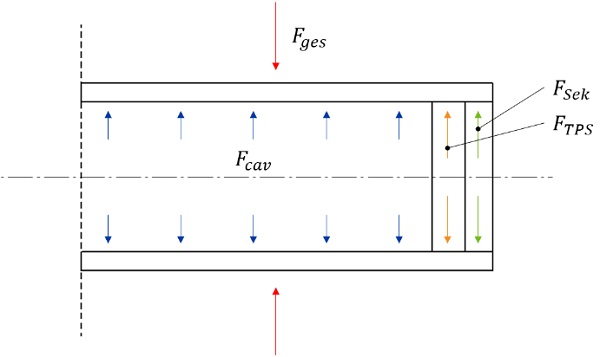
The load case described is very complex and is influenced by several effects, some of which change over time. Three essential components contribute to the overall rigidity of the IG unit: the contribution of the secondary seal, which increases after the manufacturing process as it cures, the contribution of the viscoelastic behavior of the thermoplastic spacer, which decreases over time and the contribution of the hermetically sealed gas filling. The following balance of forces applies (cf. Figure 10):

With
The increase in stiffness over time is determined for the curing secondary sealant using rheometer measurements. The same procedure is followed for the thermoplastic spacer. The proportion of force for the enclosed air or the enclosed gas is calculated on the basis of the ideal gas law. This gives the forces as a function of time and strain, as shown in Fig. 11.

The compression of the entire edge bond can be calculated with this. As already mentioned, the expected accuracy here is in the range of a rough estimate for a better understanding of the overall system.
5.3. Results
Using the assumptions made in 5.2 one can calculate the time dependent strains for the respective components and thus the deformation of the whole IGU. These results are shown in Fig. 12.
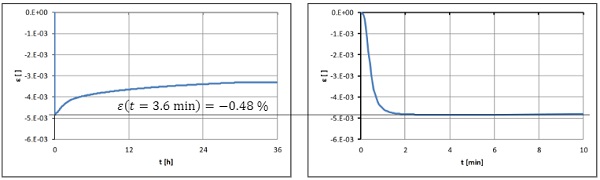
One options the highest compression after 3.6 min followed by a relaxation over time. The results show that the compressions that occur are overall very slight. For the manufacture of the units, this means that stacking is still possible during the curing time without impairing the dimensional accuracy of the IG units. Fig. 13 shows the force shares over time.
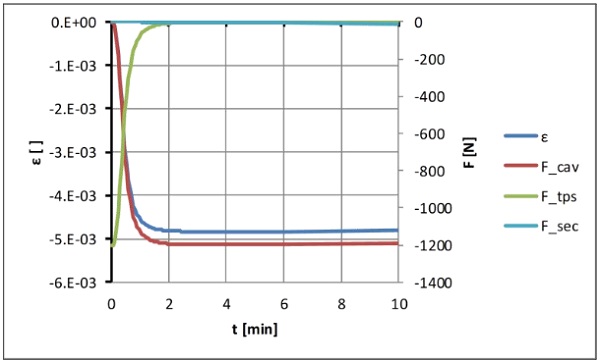
It is striking that by far the largest part of the load-bearing capacity comes from the confined gas, so that the temporal effects of secondary sealant and thermoplastic spacer play a subordinate role. Although the accuracy of the results is not comparable to that of those described in chapter 3 and 4, they are nevertheless very well suited to understand the complex behavior in the load case described with sufficient accuracy.
6. Glass laminates with a cross-linked polymeric interlayer
6.1. Task
Ködistruct LG is a composite resin based on polyurethane for the production of glass laminates. Its excellent mechanical properties allow weight reduction compared to monolithic panes and the production of stable, cold-bent laminates. A material law is required for the technical modeling, which precisely describes the deformation of the laminates depending on load, time and temperature. This material law was ultimately the prerequisite for granting the German national technical approval (abZ) for laminates made with above mentioned liquid composite material.
6.2. Model
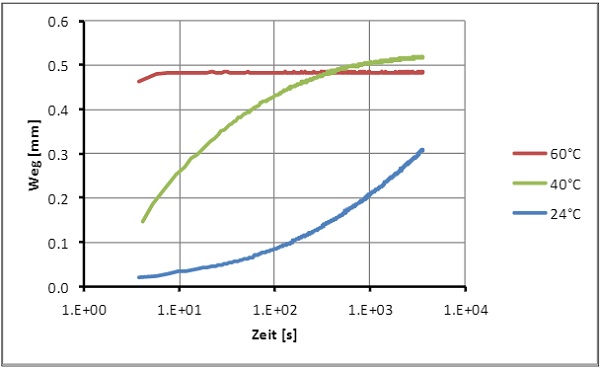
Relaxation experiments at different temperatures show a very different behavior at first glance (Fig. 14). At higher temperatures asymptotic creep behaviour of the laminate is observed ending at a fixed limit whilst at lower temperature a progressive creep is recorded.
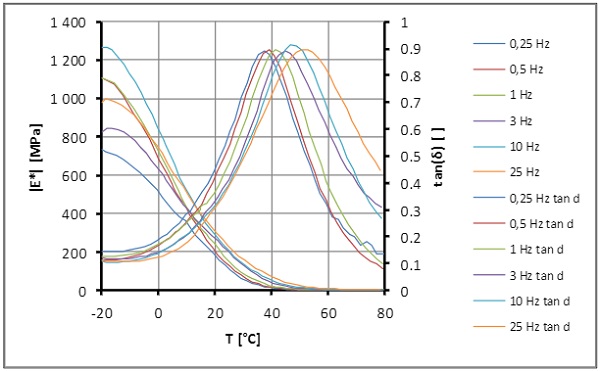
To determine the Arrhenius activation barrier EA the thermos mechanical properties where determined by a dynamic thermos mechanical analysis (DMTA) carried out at six different frequencies f (0.25; 0.5; 1; 3; 10 and 25 Hz) in tear mode on an Eplexor 100 N device and the results for the complex elastic modulus E* and the loss factor tan δ recorded and plotted (see Fig. 15).
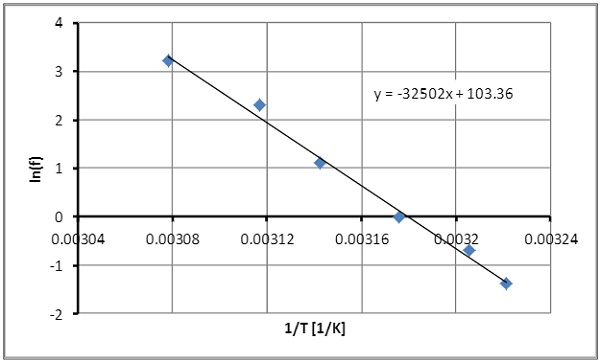
The evaluation of maximum tan (δ) at each frequency f - as a criterion for glass transition temperature Tg-in the Arrhenius plot (see Fig. 16) provides the Arrhenius activation energy EA if the frequency is considered as the velocity in the Arrhenius equation.
Time-temperature superposition factors can be calculated from using equation (3).
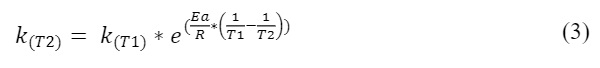
With
A temperature correction for the entropy-elastic part of the shear modulus (G∞) results from measurements at a higher temperature. A conversion to other temperatures is done by:
![]()
with
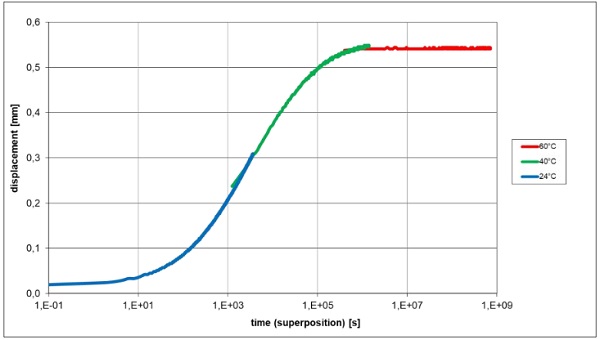
Using these factors, the measured relaxation (creep) curves can be combined to form a continuous master curve (see Fig. 17).
6.3. Results
The master curve can be approximated well by a Weibull function.

With
From these relationships, there is a possibility of calculating the shear modulus of the composite layer, which is also valid over a large time and temperature range.
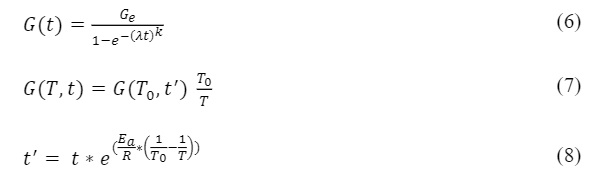
With
With these rheological material parameters for a viscoelastic finite element model, the experimental results can be calculated with good degree of accuracy to the actual measurements. Based on this model, excellent long-term forecasts can be derived from short-term tests on a laboratory scale, provided the material is thermorheologically simple and thermosetting (see also Wittwer, W., Schwarz, T. 2013and Wittwer, W., Schwarz, T. 2016).
7. Summary
Using various examples, it is shown that polymeric materials can be described very precisely using non-linear calculation methods, which means that a wide variety of load scenarios can be simulated on bonded components at low cost. For example, hyperelastic material models are presented in order to investigate the load behavior of L-shaped silicone joints in solar thermal collectors - used in numerical simulations. Furthermore, FEA impressively demonstrates the reduction in deformation in flexible, thermoplastic spacers compared to conventional, rigid box profiles in mounting-bent insulating glass units.
The development of non-linear calculation methods for adhesives allows both the description of complex load cases in very application-related areas such as the stacking of freshly sealed insulating glasses with uncured edge bonds, as well as the excellent long-term prognosis of the deformation behavior of glass laminates depending on different loads and effects. In the future, calculations and simulations will be carried out even more precisely and will replace more and more complex component tests, making them an integral part of adhesive technology.
8. References
Baaser, H.: Simulationsmodelle für Elastomere. ATZ -Automobiltechnische Zeitschrift, Ausgabe 05/2010, 364–369(2010)
Drass, M., Schwind, G., Schneider, J.,Kolling, S.: Adhesive connections in glass structures—part I. Experiments and analytics on thin structural silicone. Glass Struct Eng 9, 3, 140(2017)
EOTA -European Organisation for Technical Approvals. ETAG 002 -Guideline for European Technical Approval for Structural Sealant Glazing Kits (SSGK), Brussels(2012)
Scherer, C., Scherer, T., Semar, E., and Wittwer, W.:Ködispace 4SG, der Schlüssel für energieeffiziente kaltegebogene Structural-Glazing-Fassaden. In Glasbau 2019, B. Weller and S. Tasche, Eds., 439–449(2019)
Scherer, T.:Werkstoffspezifisches Spannungs-Dehnungs-Verhalten und Grenzen der Beanspruchbarkeit elastischer Klebungen, Technische Universität Kaiserslautern(2014)
Scherer, T., Wittwer, W., Scherer, C., and Semar, E.:Dimensioning of Elastic Adhesive Joints with Complex Geometries? –A Systematic Approach beyond ETAG 002. In Challenging Glass Conference Proceedings, Vol. 6, pp. 369-380(2018).
Weiß, R., Osen, E., and Baaser, H.:FEM–Simulation von Elastomerbauteilen. ATZ -Automobiltechnische Zeitschrift, Volume 103, Issue 3, 242–247(2010)
Wittwer, W., Schwarz, T.:A material law for shear load and creep behavior of glass laminates. COST Action TU0905, Mid-term Conference on Structural Glass –Belis, Louter & Mocibob (Eds)© 2013 Taylor & Francis Group, London, ISBN 978-1-138-00044-5(2013)
Wittwer, W., Schwarz, T.:A Deterministic Mechanical Model based on a Physical Material Law for Glass Laminates. Engineered Transparency (2016)