Authors: Cenk Kocer, Antti Aronen, Richard Collins, Osamu Asano & Yumi Ogiso
Source: Glass Structures & Engineering | https://doi.org/10.1007/s40940-022-00172-2
Abstract
This is the second of two papers concerning errors in the measurement of the thermal insulating properties of Vacuum Insulating Glass (VIG) due to non-uniformities in the heat flow due to the support pillars. Part 1 deals with the situation where the measurement area is in direct thermal contact with the glass sheets. This paper discusses how the non-uniformities and associated measurement errors can be reduced using thermally insulating buffer plates on each side of the specimen. A single parameter is developed that characterises the maximum error for measurement areas of all sizes. Values of this parameter are given for all practically relevant designs of the VIG and properties of the buffer plates. Methods are developed for selecting measurement conditions that lead to acceptable tradeoffs between reducing the errors associated with non-uniformities in the heat flow and errors due to heat flow through the edges of the specimen.
Introduction
Vacuum Insulating Glass (VIG) consists of two sheets of glass that are hermetically sealed together around the edges, with a thin evacuated internal space (Collins et al. 1995). A square array of small support pillars separated by λp maintains the separation of the glass sheets under the forces due to atmospheric pressure. The localised heat flow through the pillars results in non-uniformities in the heat flux, defined as the heat flow per unit area, over the surfaces of the VIG.
This is the second of two papers discussing the measurement of the thermal insulation properties of VIG specimens. The first paper (Part 1) considers configurations in which the measuring area of the apparatus is in direct thermal contact with the glass sheets of the VIG. In this situation, the non-uniformities in the heat flux can be quite large, leading to large errors in the estimates of the thermal insulating properties of the specimen. This paper (Part 2) discusses configurations in which the spatial non-uniformities in the heat flux over the measurement area are reduced by inserting slabs of material, referred to as buffer plates, between the glass sheets and the measurement area. This is the approach taken in a recent Standard (International Organisation for Standardization 2018).
Methods are developed for estimating the maximum possible errors for measurement areas of any size and all practically relevant VIG design parameters. In addition to reducing the non-uniformities in the heat flow through the pillars, the buffer plates increase the size of the peripheral region of the VIG over which heat flow through the edge seal can contribute significantly to the measured heat flow. Achieving acceptably small measurement errors associated with these two competing effects imposes limitations on the parameters of the buffer plates and the size of the specimen.
Heat transfer processes in VIGs
The following relationships, discussed in Part 1, are relevant to the analysis in this paper. A unit cell of the pillar array is defined as a square area of dimensions λp×λp, with sides oriented parallel to the rows of pillars. For glass sheets with average temperatures TC and TH, the magnitude of the heat flow through a single highly conducting support pillar is:
![]()
where rp is the radius of the pillar and kg is the thermal conductivity of the glass.
The thermal conductance of the pillar array hp, is (Wilson et al. 1998):
![]()
For a VIG with glass sheets having mean temperature Tm and individual hemispherical emittances εhotεhot and εcold (at temperatures Thot and Tcold), the thermal conductance hr associated with radiative heat transport through the evacuated space is (Zhang et al. 1997):
![]()
where σ is the Stefan–Boltzmann constant (5.67 × 10⁻⁸ W m⁻² K⁻⁴), and ε is the effective emittance of the two surfaces, given by:
![]()
The total thermal conductance between the glass sheets of the VIG, hv, can be written:
![]()
In a practical VIG installation, the thermal conductances associated with heat flow between the surrounding external hot and internal cold environments to the respective surfaces of the glass sheets are he and hi. The overall heat transfer coefficient, hH−C, (also referred to as the U-value of the glazing) associated with heat flow through the specimen between the environments on the hot and cold sides is:

In these papers, U-values are calculated using values of hehe and hihi of 23 W m⁻² K⁻¹ and 8.3 W m⁻² K⁻¹, respectively (International Organisation for Standardization 1994). Here the glass contribution is not included since the conductance of the panes is quite high compared to the other contributions and therefore has a negligible effect on the final U-value.
The thermal resistance R (having units m² K W⁻¹) associated with individual or combined physical heat transfer processes is the inverse of the relevant thermal conductance:
![]()
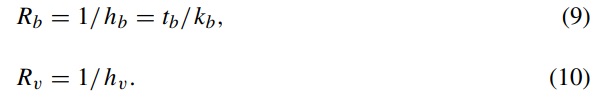
In this paper, the buffer plates on both sides of the VIG are assumed to be identical with thickness tb and thermal conductivity kb. For such buffer plates, the heat transfer coefficients he and hi in Eq. (6) are replaced by the heat transfer coefficient of the buffer plate hb:
![]()
The respective thermal resistances Rb and Rv associated with the heat flow through unit area of the buffer plates and between the glass sheets are, respectively:
Measurement configuration
Principle of the measurement method
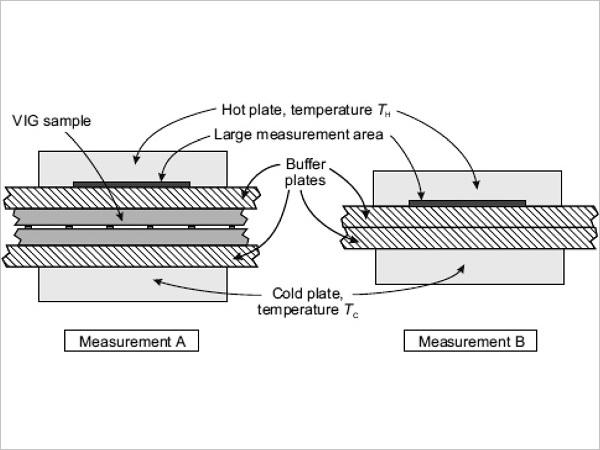
The guarded measurement configuration described in Part 1 is also used in the procedures discussed in this paper for the measurement of the thermal insulation properties of VIG remote from the edge seal. As shown in Fig. 1, two measurements are made in which the external surfaces of the measured assembly are placed in good thermal contact with isothermal plates at temperatures TH and TC.
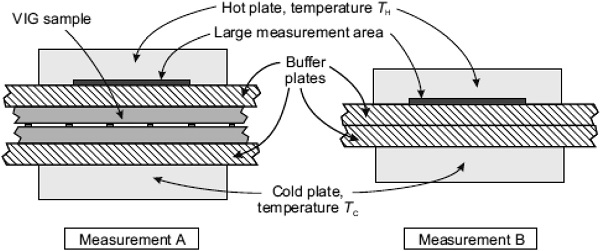
Measurement A gives the combined thermal resistance of the VIG specimen and the two buffer plates in series:
![]()
Measurement B gives the thermal resistance of the two buffer plates:
![]()
The thermal resistance of the VIG is obtained by difference (International Organisation for Standardization 2018):
![]()
Although not immediately obvious, there is an intrinsic error in Eq. (13) because the heat flow through the buffer plates in Measurement A is non-uniform, whereas in Measurement B the heat flow is uniform. Numerical modelling procedures discussed in Sect. 4 show that the associated error in Rv is small provided that:
![]()
As discussed in Sect. 6, the restriction in Eq. (14) does not impose a significant practical limitation on the method.
Errors associated with different types of measuring instrument
These two papers discuss measurements made with instruments having a square detection area with sides parallel to the rows of pillars. Figure 7 of Part 1 shows that the maximum and minimum measured heat flows through such areas are always in two specific positions: when the centre of the measurement area is directly above a support pillar, and when the centre of the area mid-way between 4 pillars. The size of the area determines which of these two positions has the maximum heat flow and which has the minimum heat flow.
As discussed in Part 1, large area measurements of the thermal insulating properties of VIGs can be made with two different types of instruments—the guarded hot plate apparatus and the heat flow meter. In the guarded hot plate apparatus, the heat flux is continuous between the measuring area and the VIG specimen, as assumed in the analysis in this paper. In contrast, in the heat flow meter the heat flow is determined using a heat flux transducer that is in direct contact with the specimen. When this type of instrument is used to measure a specimen with non-uniform heat flux such as a VIG, there are significant discontinuities in the spatial distribution of the heat flux across this transducer. This results in a reduction in the magnitude of the non-uniformities in the heat flux, and the associated errors compared with a guarded hot plate instrument. Examples of this reduction are given in Part 1 for a measurement without buffer plates.
The practical significance of this result is that the analysis presented in this paper may significantly overestimate the measurement errors that could occur when a heat flow meter is used. The extent to which the spatial non-uniformities in the heat flux are reduced depends on the detailed design of the heat flux transducer. In the absence of publically available information about the transducer design in commercial instruments, this currently cannot be modelled with confidence.
Quite independently of the analysis in this paper, and as discussed in Part 1, it is possible experimentally to obtain an upper limit for the magnitude of the measurement errors that could occur in any specific measurement situation with both types of measuring instrument. This can be done by using the instrument to measure the heat flow at the two extreme positions—with the centre of the measuring area above a pillar, and mid-way between 4 pillars.
Modelling methods
Finite element modelling
Part 1 describes the finite element model used to determine the spatial distribution of the heat flux over a unit cell of the pillar array in a VIG for which the external surfaces of the glass sheets are isothermal. As shown in Fig. 2a, the unit cell is modelled in the same way here, with the addition of the two buffer plates between the external surfaces of the glass sheets and the isothermal surfaces.
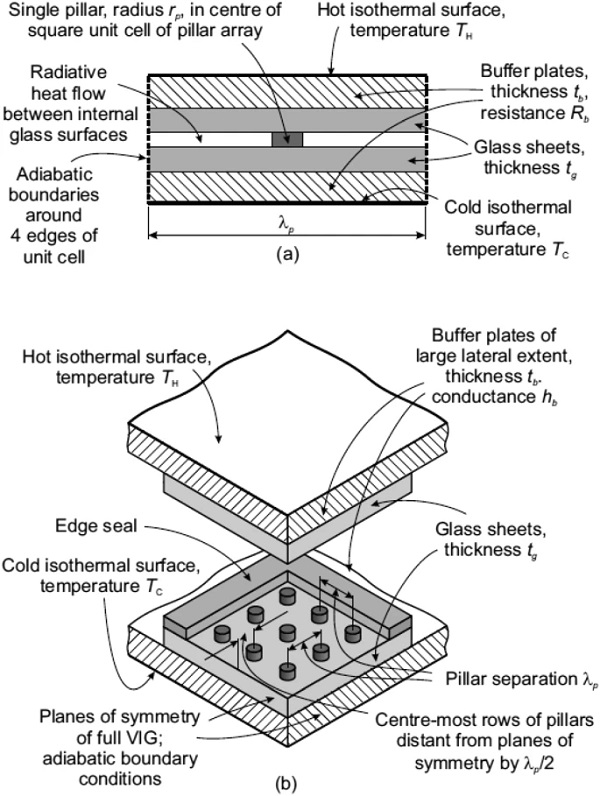
This system was modelled for all combinations of the parameters given in Table 1. The cases with tb=0 correspond to no buffer plates.
Table 1 Modelling parameters - Full size table
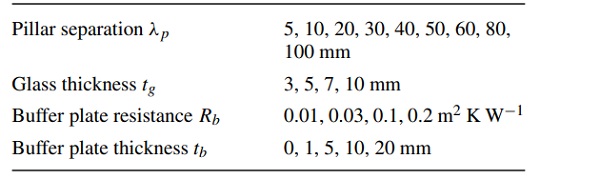
The parameters of the system modelled are the same as those given at the beginning of Sect. 6 of Part 1. The pillar is 0.5 mm in diameter and 0.2 mm high and made of material with thermal conductivity of 20 W m⁻¹ K⁻¹. The temperatures of the hot and cold isothermal surfaces are 17.5 °C and 2.5 °C.
As in Part 1, the finite element modelling data presented here are for heat flow due to the pillars only, although radiative heat flow can be included in the model if desired. Section 6.6 shows how the effects of radiation are included analytically when estimating the measurement errors.
Edge effects are analysed using the finite element model by building up an array of individual unit cells with a surrounding edge seal. One quarter of the rectangular VIG is modelled with adiabatic boundary conditions over the planes of symmetry (Fig. 2b). The edge seal is 6 mm wide with the same height of the support pillars and has thermal conductivity kg. The pillar array is positioned so that the rows of pillars are equidistant from the adjacent planes of symmetry in the full structure. The buffer plates extend well beyond the edge seal to simulate practical measurement configurations.
Analytic model of heat flow in the vicinity of an edge seal
The analytic model described here provides a useful way of quantitatively evaluating how various system parameters influence the way in which edge effects contribute to the measured heat flow. This modelling approach, illustrated in Fig. 3, is based on previously described methods (Simko et al. 1995).
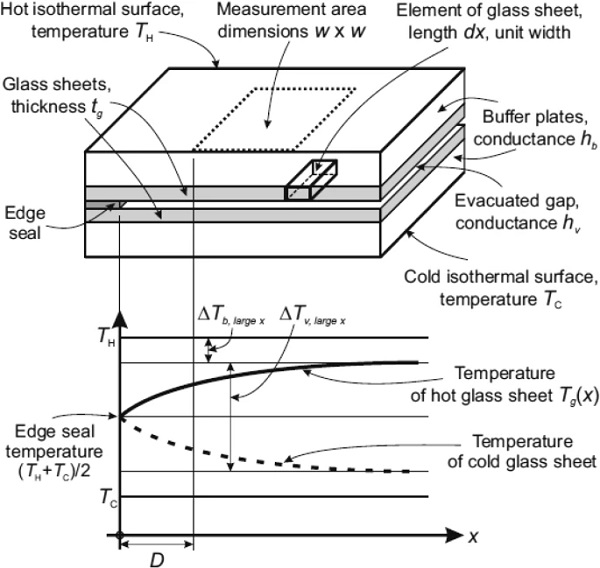
The heat flow through the evacuated space due to radiation and the pillar array is simulated by the thermal conductance hv (or its inverse, the thermal resistance Rv) of the space between the glass sheets. As with the finite element model, the glass sheets of the VIG are plane slabs of thickness tg and thermal conductivity kg. However, in the analytic model the temperature of each glass sheet is assumed to be uniform through the thickness and depend only on the distance xx from the inner extremity of the edge seal. We write the temperature of the hot glass sheet as Tg(x). The heat flow through the buffer plates is simulated by a thermal conductance hb (or its inverse, a thermal resistance Rb). This is equivalent to assuming that the heat flow through the buffer plates is perpendicular to the plane of the VIG.
Remote from the edge seal, the total heat flow through unit area of the assembly Qmeas,sample can be determined using the thermal resistances:
![]()
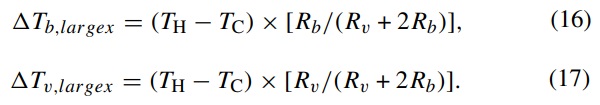
In this region, the temperature differences across the buffer plates ΔTb,largex and between the glass sheets ΔTv,largex are, respectively:
It is convenient to write the temperature of the edge seal as (Simko et al. 1995):
![]()
The analysis involves calculating heat flow through an elemental piece of each glass sheet of length dx perpendicular to the edge, and unit width parallel to the edge, as shown in Fig. 3. Such energy flow can occur from the contacting buffer plate, between the glass sheets, and along the glass sheet. Under steady state conditions, the sum of these heat flows is zero.
As has been previously shown (Simko et al. 1995), this analysis generates two coupled second order differential equations involving the temperatures of each glass sheet. In general, these equations cannot be separated and must be solved numerically. However, in the symmetric case considered here, the equations decouple, and can be solved analytically. For the hot glass sheet, the equation is:
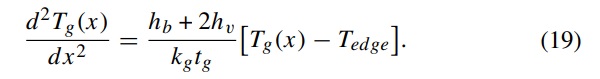
This equation can be solved exactly:
![]()
where the characteristic length L of the exponential is given by:

The temperature difference across the buffer plate can then be written:
![]()
We consider a square measuring area of side length w in the plane of the hot isothermal surface, oriented with its nearest edge parallel to the VIG edge seal and located a distance D from the inner extremity of this seal, as shown in Fig. 3. The amount of heat that flows from this area through the buffer plate due to the specimen and edge seal is:
![]()
Integration of this equation gives:
![]()
In Eq. (24), the exponential term from the upper limit of integration is omitted because it is negligible compared with the term from the lower limit in all practical situations.
When the measurement area is a large distance from the edge, the measured heat flow has negligible contribution from the edge, and can be written:
![]()
The additional heat flow through the measuring area due to the presence of the edge seal is therefore:

Combining Eqs. (25) and (26), the additional heat flow through the measuring area due to the edge seal can be written as a proportion of the heat flow through the measuring area remote from the edges:
![]()
The heat flow through the measuring area due to the edge seal results in an error Δhv in the measured value of the thermal conductance hv of the VIG. To determine this error, Eq. (15) is rewritten in terms of the heat transfer coefficients in the measurement system:
![]()
Taking differentials and using Eqs. (21) and (27), to first order we obtain the proportional error Δhv/hv in the measured thermal conductance of the specimen:
![]()
To the same level of approximation, the consequential proportional error ΔU/U in the U-value of the specimen is:
![]()
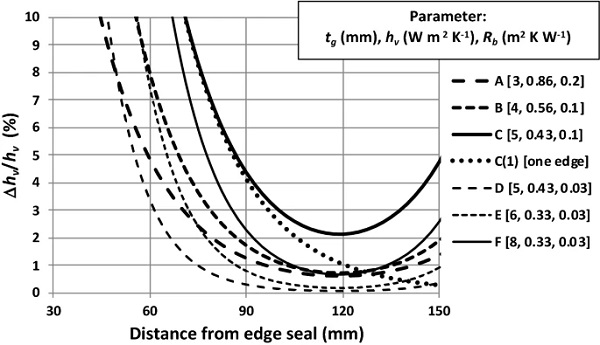
Figure 4 shows the proportional error Δhv/hv in the measured value of the thermal conductance for several VIG designs and buffer plate resistances. These data were obtained from Eq. (29) for a single edge and a square measuring area of dimension 100 mm.
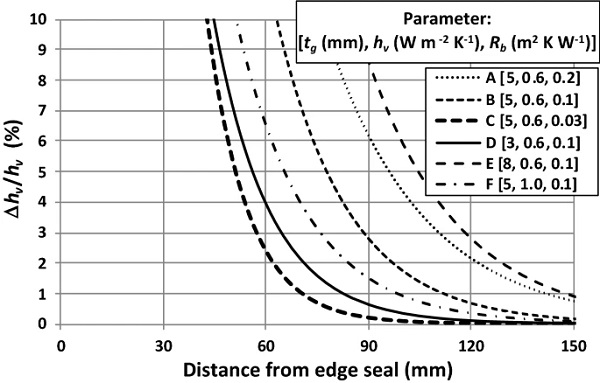
The dependence of Δhv/hv on system parameters is dominated by the exponential term in Eq. (29). For parameters of practical relevance, Eq. (21) shows that the characteristic length L in the exponent of this term is approximately proportional to √Rb and √tg. The Δhv/hv values in Fig. 4 at distances D≫L are therefore larger for higher thermal resistance buffer plates (Lines A, B and C in Fig. 4) and for VIGs with thicker glass sheets (Line E in Fig. 4). For all cases of interest, Eqs. (21) and (29) show that the thermal conductance hv of the VIG specimen has only a small effect on Δhv. For specified values of other parameters, Δhv/hv is therefore approximately inversely proportional to hv (Lines B and F in Fig. 4). The quantitative extent to which the specimen and buffer plate properties affect the choice of measurement parameters is discussed in Sect. 6.
Validation of the analytic model
The validation of the unit cell finite element model is discussed in Part 1. In this Section we discuss the validation of the analytic model.
Figure 5 compares analytic (lines) and experimental (points) U-value data for a specific VIG specimen as a function of the closest distance of the measuring area from an edge seal. The specimen is 395 mm square with 5 mm thick glass sheets, has a 6 mm wide edge seal, and contains 0.45 mm diameter pillars separated by 30 mm. One internal glass surface has a coating with hemispherical emittance 0.04.
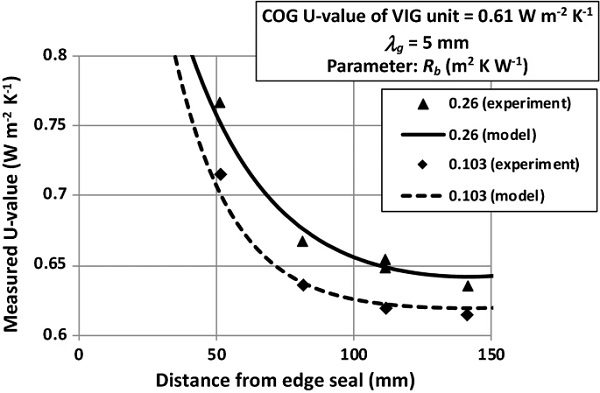
The experimental U-value data in Fig. 5 are obtained from measurements of heat flow at different distances from an edge of a VIG specimen and applying Eq. (6) with values of external heat transfer coefficients given in Sect. 2. The measurements were made with buffer plates of different resistances using an EKO HC-074/630 heat flow meter with a square measuring area of side 100 mm. The centre of the measuring area was positioned along an axis of symmetry of the specimen. The horizontal axis in this figure is the distance of the edge of the measuring area from the inner extremity of the nearest edge seal. As shown in Sect. 6 below, the position of a measuring area of this size relative to the pillars has a negligible effect on the measured U-value for a VIG specimen with these parameters and buffer plates of resistance and thickness given in Fig. 5.
The analytic data in Fig. 5 are calculated using Eq. (30) and include the effect of all four edges of the VIG specimen, estimated by adding the separate contributions from each edge, as shown to be valid by the finite element model. The U-value of the specimen used to obtain the analytic data is 0.61 W m⁻² K⁻¹, as measured using lower resistance buffer plates at distances from the edge seal where the contribution from the edge seal is calculated to be negligible. To within the accuracy of the nominal design parameters of the experimental specimen, this U-value is consistent with that calculated using Eqs. (2), (3) and (6). These results provide strong validation of the analytic model.
Comparison of finite element and analytic modelling of edge effects
The analytic and finite element modelling approaches provide independent estimates of the temperature of the external surface of each glass sheet in the vicinity of the edge seal. These estimates can be compared using finite element modelling data along a plane of symmetry of the one quarter model shown in Fig. 2b. Except in regions very close to the edge seal, the temperature of the external glass surface along this line is very close to the local average temperature through the thickness of the glass sheets.
For all practically relevant conditions, the temperature of the glass sheets determined by the finite element model decreases approximately exponentially with distance from the edge seal, consistent with the analytic model. Figure 6 compares the characteristic length of this exponential dependence as obtained with both modelling approaches for buffer plates of two different resistances and a VIG with 3 mm and 5 mm thick glass sheets and thermal conductance of 0.46 W m⁻² K⁻¹. Similar results are obtained for all relevant buffer plate resistances and VIG properties.
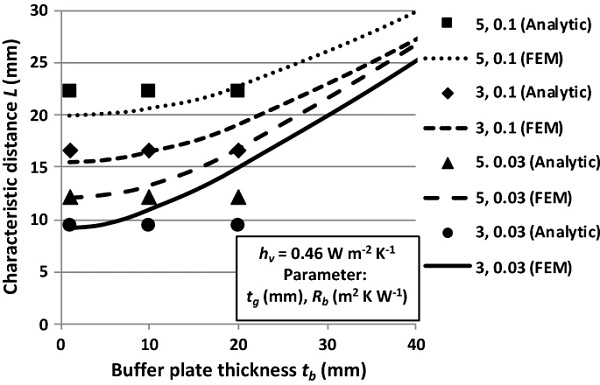
For thin buffer plates, the characteristic lengths obtained with the two modelling approaches agree reasonably well. For thicker buffer plates, the characteristic lengths obtained with the finite element model increase, reflecting the greater significance of off-normal heat flow through these plates. The increases in the characteristic length are relatively small for buffer plates of thickness up to about the analytic estimate of the characteristic length, which is between about 10 mm and 20 mm for typical VIG designs and measurement parameters. For the remainder of this paper, the buffer plates are specified to be sufficiently thin that the edge effects are well-characterised by the analytic model:
![]()
Clearly, the analytic model only accounts for the heat flow contribution that is due to a single edge. However, the contribution from all four edges of the VIG unit should be taken into account.
The edge contribution from all 4 edges of the VIG unit to the measured heat flow was analysed using the finite element models. In all practically relevant cases, the combined heat flow from the 4 edges of the VIG unit, as measured by a heat flux sensor, is approximately equal to the sum of the individual heat flows due to each edge. For example, if the measurement area is equidistant from the 4 edges of a square specimen, the total contribution from all 4 edges is approximately 4 times the contribution from a single edge.
Conditions for tolerably small edge effects
The errors associated with edge effects can, in principle, be reduced to any level by positioning the measuring area at a sufficiently large distance from the edge. In practice, however, the size of the VIG specimen limits this distance. In addition, as shown in Eq. (29), errors associated with edge effects are greater for smaller measuring areas. The effect of the edges on the measurement of heat flow can therefore only be quantified in the context of a specific specimen size and measurement area. The analysis in this Section illustrates how these effects are determined.
The VIG specimens are assumed to have external dimensions of 350 mm × 500 mm—a size often specified in Standards for testing highly insulating glazing units (International Organisation for Standardization 2008). The width of the solder glass seal is assumed to be 6 mm, so that the dimensions of the evacuated space 338 mm × 488 mm. The measurement area is assumed to be square, with side dimension 100 mm—a size commonly used in heat flow measuring equipment.
In this analysis, the centre of the measurement area is positioned along the short axis of symmetry of the specimen. In this configuration, only the two long edges of the specimen make significant contributions to the measured heat flow.
For the purposes of characterising the performance of highly insulating window glazing, a total error in the measured VIG thermal conductance of up to ~ 5% is probably acceptable. To allow for errors from other sources, particularly due to the non-uniformities in the heat flow through the pillars, the contribution to the total error from the edge seal should be somewhat less than this value (~ 2–3%). Obviously, if very high accuracy is required, correspondingly smaller errors would be appropriate.
Figure 7 shows analytic modelling data for the proportional contributions Δhv/hv to the measured VIG thermal conductance from the two closer edges for several specimens and buffer plate resistances. The buffer plate resistances in these data are chosen to illustrate limiting values that will be appropriate in practice. For comparison, Line C (1) in Fig. 7 shows data for a single edge with the same measurement and specimen parameters as Line C.
For distances up to ~ 90 mm from the edge seal, the error in the measured thermal conductance decreases rapidly, and there is negligible contribution from the opposite edge seal (Lines C and C(1) in Fig. 7). For larger distances, the error decreases much less rapidly with distance as contributions from the second edge seal become progressively more significant. The total edge error is least when the measuring area is equidistant from the two edges (119 mm from the edge seal in these data). For most measurements in which the edge errors are large enough to be of concern (~ 4% at 90 mm), relatively limited additional reductions (≲ factor of 2) are obtained if the measurement area is more than ~ 90 mm from the edge seal.
The data in Fig. 7 illustrate how the maximum resistance of the buffer plates must be less for VIGs with larger glass thicknesses. For 3 mm thick glass, (Line A in Fig. 7), a buffer plate resistance of 0.2 m² K W⁻¹ results in adequately small edge contributions. However, this resistance leads to unacceptably large errors for all VIGs with thicker glass (see, for example, Line A in Fig. 4). Buffer plates of resistance ~ 0.1 m² K W⁻¹ can be used when measuring VIGs with 4 mm thick glass sheets (Line B in Fig. 7). For VIGs with glass thickness ≳ 5 mm, buffer plates of resistance 0.03 m² K W⁻¹ are required (Lines C, D and E in Fig. 8, and Line B in Fig. 4).
As shown in Sect. 6, non-uniformities in the heat flow due to the pillars result in a lower limit to the resistance of the buffer plates for VIGs with large pillar separations. However, a buffer plate resistance of 0.03 m² K W⁻¹ still results in adequately small errors due to the edges for quite large glass thickness (Line F in Fig. 7).
In summary, when measuring the thermal conductance of most VIGs of dimension 350 mm × 500 mm using a 100 mm square measuring area, the edge of the area should be at least 90 mm from the closest edge seal, and buffer plates with resistance between 0.1 m² K W⁻¹ and 0.03 m² K W⁻¹ should be used. For 5 mm thick glass sheets, Eq. (31) specifies that the thickness of these buffer plates should be ≲ 20 mm.
These buffer plate parameters have been adopted in a recent VIG measurement Standard (International Organisation for Standardization 2018).
Errors in the measurement of centre-of-glazing heat flow utilising a large area instrument
This Section discusses the magnitude of the largest possible errors in the measurement of heat flow through a VIG remote from the edges using a large area instrument. The discussion in Sects. 6.1–6.5 is for heat flow due to the pillars alone. The effect of radiation is subsequently included in Sect. 6.6.
Nomenclature for quantities relating to heat flow due to the pillar array
The non-uniformities in the local heat flux in regions of the VIG remote from the edge seal are periodic along the orthogonal rows of pillars, with period equal to the pillar separation λp. It follows that the heat flow QU through a unit cell U is independent of the position of the cell relative to the individual pillars.
This Section defines the nomenclature used for describing the dependence on position of the heat flow QM through a square measurement area M with sides of length w oriented parallel to the rows of pillars. The maximum and minimum values of QM are respectively written QM,max and QM,min.
The area of M is equal to (w/λp)² unit cells of the pillar array. We define the accurately characterised heat flow QM¯¯ through M as:

The largest positive and negative departures of the measured heat flow from the accurately characterised heat flow are respectively:
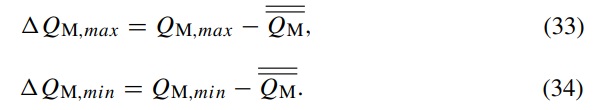
We write ΔQM as the larger of the magnitudes of these maximum departures:
![]()
The following analysis develops a parameter that can be used to obtain a reasonable estimate of the maximum proportional error ΔQM/QM¯¯ in the measured heat flow due to the pillars through a square area of any size greater than a unit cell. This ratio is also equal to the maximum proportional error Δhp/hp in the measured thermal conductance of the pillar array:
![]()
Examples of heat flux data for specific VIG designs and measurement configurations
This Section presents examples of finite element modelling data for the heat flux distribution and the total heat flow at the isothermal plates due to a single pillar at the centre of a unit cell of the pillar array (Fig. 3a). These data are given for several values of the four parameters that affect the heat flux: glass thickness tg, buffer plate resistance Rb, buffer plate thickness tb and pillar separation λp.
Heat flux distribution
In order to illustrate the greatest variation, the heat flux data presented in this Section are plotted along a diagonal of a unit cell.
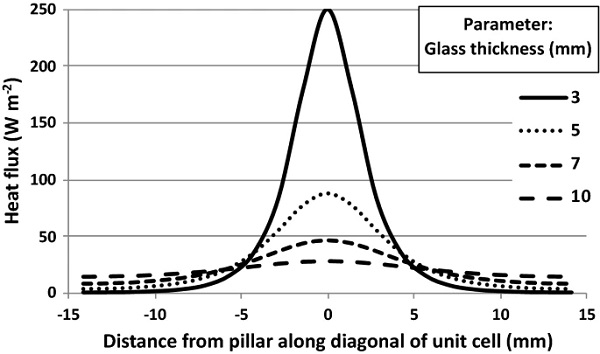
For comparison with subsequent data, the heat flux data for the case with no buffer plates given in Part 1 are repeated here, and shown in Fig. 8 for a pillar separation of 20 mm.
Figure 9 illustrates how the heat flux is affected by buffer plate resistance and glass thickness. These data are for 10 mm thick buffer plates and a pillar separation of 20 mm. Larger values of buffer plate resistance and glass thickness reduce the absolute and relative spatial non-uniformities in the heat flux (note suppressed zero in Fig. 9). More resistive buffer plates also reduce the overall magnitude of the heat flux due to the larger total thermal resistance between the hot and cold isothermal surfaces.
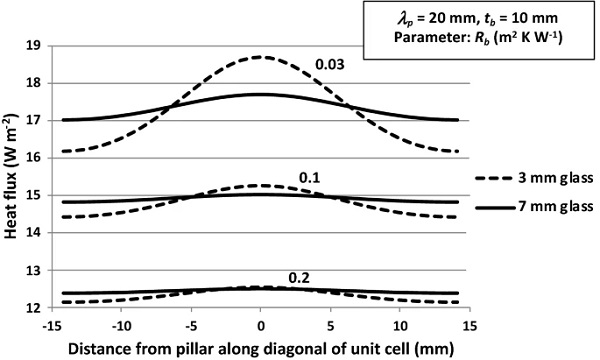
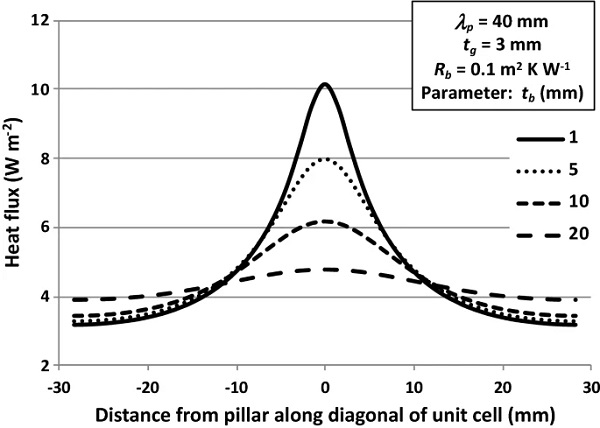
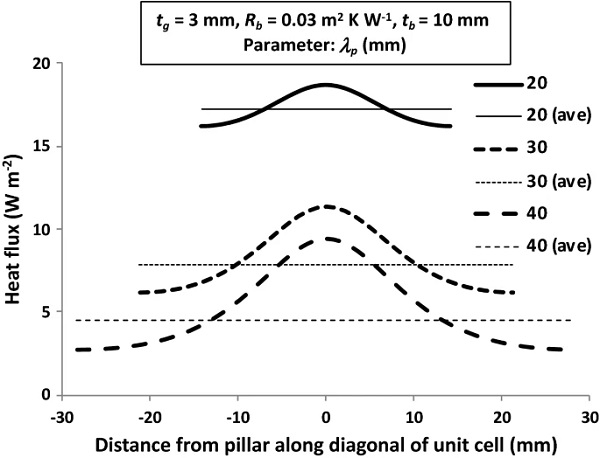
Figure 10 provides examples of how thicker buffer plates reduce the non-uniformities in the heat flow. These data are for 3 mm thick glass, a pillar separation of 40 mm, and buffer plates of resistance 0.1 m² K W⁻¹. Figure 11 illustrates how larger pillar separations increase the proportional and absolute spatial variations in the heat flux. Obviously, larger pillar separations also lead to lower average heat fluxes because of the greater unit cell area. These data are for 3 mm thick glass and 10 mm thick buffer plates of resistance 0.03 m² K W⁻¹.
The data in Figs. 8, 9, 10 and 11 are typical of those obtained for all practically relevant VIG and measurement parameters.
Total heat flow
The total heat flow for each set of parameters is obtained by integrating the heat flux data at the isothermal surface over the unit cell. This total heat flow value is used to calculate the thermal resistance between the hot and cold isothermal surfaces of the VIG/buffer plate system. The glass-to-glass thermal resistance associated with heat flow through the pillar array is then obtained by subtracting the combined resistance of the two buffer plates, as shown in Eq. (13).
These modelling values of pillar array thermal resistance with buffer plates agree to within ~ 2% with the value obtained assuming highly conducting, non-interacting pillars between two semi-infinite glass plates (Eq. 1). This agreement is observed for all practically relevant VIG designs and measurement parameters, provided that the resistance of the buffer plates is less than the resistance of the unit cell. This condition, noted in Eq. (12), does not impose a significant limitation on the measurement method for two reasons. Firstly, consistent with good experimental practice, Eq. (14) ensures that the use of Eq. (13) does not involve calculating the small difference between two large quantities. Secondly, as shown in the previous Section, Eq. (14) is satisfied for buffer plates that achieve tolerably small edge effects for all practical measurement conditions and VIG design parameters.
In summary, the finite element modelling data show that the measured thermal resistance of the pillar can be accurately determined using Eq. (2) and is effectively independent of glass thickness and buffer plate parameters.
Parameter for characterising non-uniformities in the heat flux due to the pillars
The heat flow through a square measurement area of side w=nλp is obviously equal to n²QU, and is independent of the position of the area.
It is also clear that the heat flow through an area of side
![]()
is equal to (n²+n+1/4)QU. Figure 12a illustrates this situation for n=1, when one corner of the area is located at a pillar. Of relevance to the discussion in Sect. 6, it is noted that in this position the centre of the measuring area is mid-way between a pillar and the centre of 4 pillars for all values of n in Eq. (37).
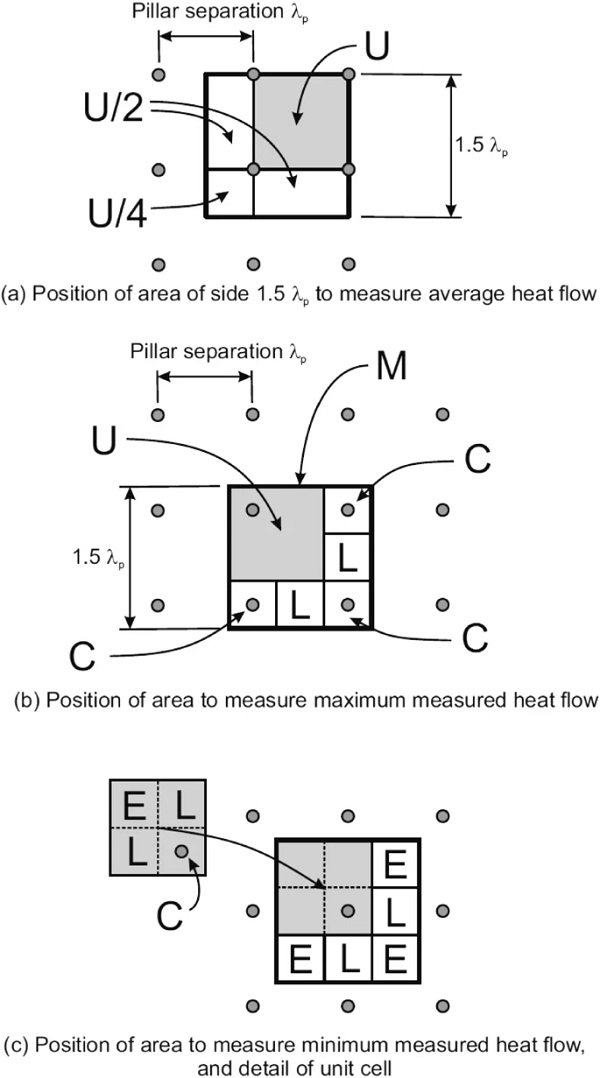
Figure 12b and c show a measuring area M with side 1.5λp with the centre respectively at the mid-point of 4 pillars and directly above a pillar. The measured heat flow in each case is respectively the largest (QM,max) and smallest (QM,min) that could occur for an area of this size. This situation applies for all values of n in Eq. (37), except that the positions of maximum and minimum heat flow are reversed for even values of n. As will be shown in Sect. 7, the magnitudes of the relative departures of the measured heat flow from the average heat flow through areas of dimension (n+1/2)λp are very close to the greatest that could occur for any square area of dimension (n+δ)λp, where 0<δ<1. Areas of dimension (n+1/2)λp therefore give very close to the largest positive and negative errors in the measured heat flow when respectively positioned with their centres mid-way between a pillar and at the centre of 4 pillars for n odd. The positions are exchanged for n even.
The accurately characterised heat flow through an area having the "worst case" dimension in Eq. (37) is:
![]()
The measuring area in Fig. 12b and c can be divided into 6 separate square areas: a single larger area of side λp that is a unit cell (U) of the pillar array, and 5 smaller areas of side λp/2. In both cases, two of the smaller areas (called Type L areas in this discussion) are located midway along a line between adjacent pillars. In Fig. 12a, the three remaining smaller areas (Type C areas) are centred over individual pillars. In Fig. 12b, the three remaining smaller areas (Type E areas) are equidistant from four pillars.
If the heat flow over the unit cell were uniform, the heat that would pass through each of the smaller areas would be QU/4. We define the parameter PC for a Type C area as the proportional difference between the actual heat flow through this area and that which would occur for uniform heat flow:
![]()
Equivalent definitions apply for Type L and Type E areas.
Figure 12c also shows how a unit cell can be partitioned into one Type C area, one Type E area, and two Type L areas. Thus:
![]()
It follows that:
![]()
The heat flux in the vicinity of the pillar is always at least slightly greater than the average over the unit cell and decreases with distance from the pillar. In addition, the Type E area is further from the pillar than the Type L areas. Thus QC>(QU/4), QL<QC, and QE<QL. It follows that PC is positive, PE is negative and smaller in magnitude than PC, and PL is negative and smaller in magnitude than PE. If the heat flux is nearly uniform, QC≅QL≅QE≅QU/4, and PC, PL and PE are all very small. In the limiting case where the heat flux is highly localised around the pillar, QC≅QU and QL≅QE≅0, so PC≅3, and PL≅PE≅−1.
The parameters for the 5 small areas in Fig. 12b and c respectively can be combined to calculate the largest positive and negative proportional departures from the accurately characterised heat flow through the measurement area QM¯¯:
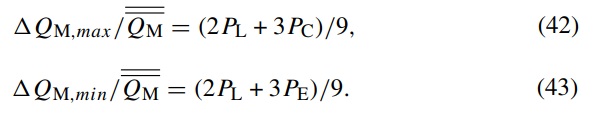
It is straightforward to generalise Eqs. (42) and (43) for measurement areas M of side w defined by any value of the integer n in Eq. (37):
Although the positions of maximum and minimum heat flow are exchanged for odd and even values of n, Eqs. (44) and (45) remain the same.
Examples of values of the parameters PC, PL and PE
As noted above, the spatial distribution of the heat flux due to the support pillars at the isothermal surfaces of the measurement system is affected by tg, λp, Rb and tb. Table 2 gives values of the parameters PC, PL and PE in terms of these quantities for the examples in Figs. 8, 9, 10 and 11.
Table 2 Values of the parameters PC, PL and PE for the values of tg, λp, Rb and tb that apply in Figs. 8, 9, 10 and 11 - Full size table
The relative magnitudes and signs of PC, PE and PL in these examples are consistent with the above qualitative description. In addition, there is a strong quantitative correlation between these three quantities. The data points in Fig. 13 show how PE and PL vary with PC for all combinations of tg, λp, Rb and tb in Table 2, including cases with no buffer plates.
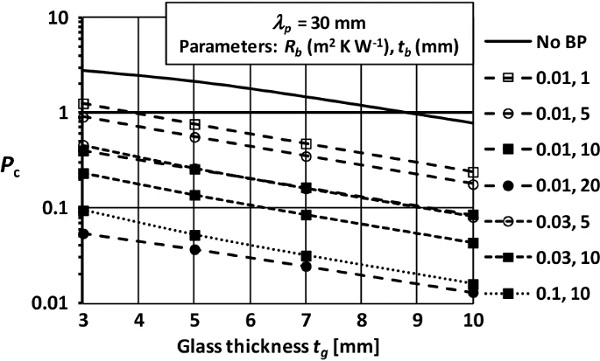
The lines in Fig. 13 are least square quadratic fits to the data with the following regression relations:
Substituting these relations into Eqs. (44) and (45), we obtain:
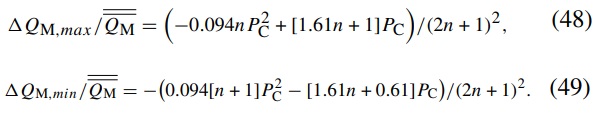
In all cases, ΔQM,max is greater than |ΔQM,min|. Using Eq. (36), the maximum possible proportional error in the measured heat flow through a VIG due to the pillars for square areas of side (n+1/2)λp is therefore:

Figure 14 shows this maximum error as a function of PC for different values of n.
Obviously, the errors that may occur are larger for smaller measurement areas (lower values of n). The data in Fig. 14 show that values of PC slightly less than 0.1 can lead to significant errors with VIG specimens and measurement equipment for which n=1. In order to cover all possible experimental configurations, the PC data presented in the next Section are therefore for selected sets of parameters of tg, λp, Rb and tb that give PC values above 0.01. PC data for other values of these parameters can be obtained by interpolation or extrapolation.
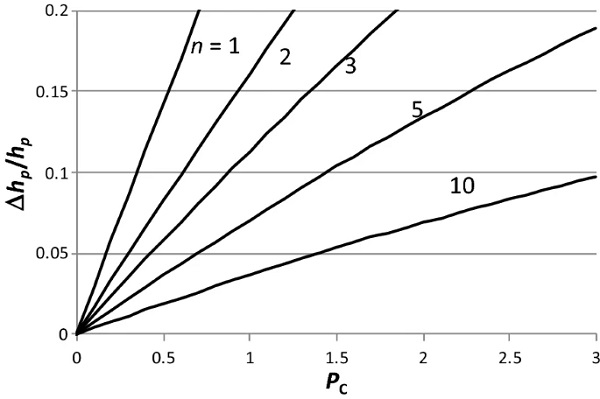
Values of PC for a wide range of VIG and buffer plate parameters
The data points in Figs. 15, 16, 17, 18, 19 and 20 are finite element modelling values of PC as a function of glass thickness tg, for VIGs with pillar separations of 20, 30, 40, 50, 60 and 80 mm, respectively. The parameters for each set of 4 points are the various combinations of buffer plate resistances and thicknesses that give PC values of possible practical relevance. The lines are smooth fits through the 4 data points for each pair of parameters. The data are presented on a logarithmic scale for clarity.
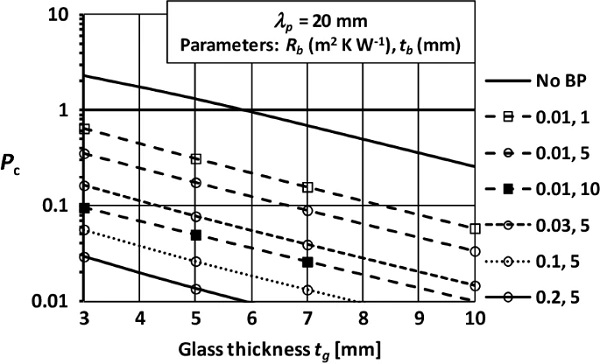
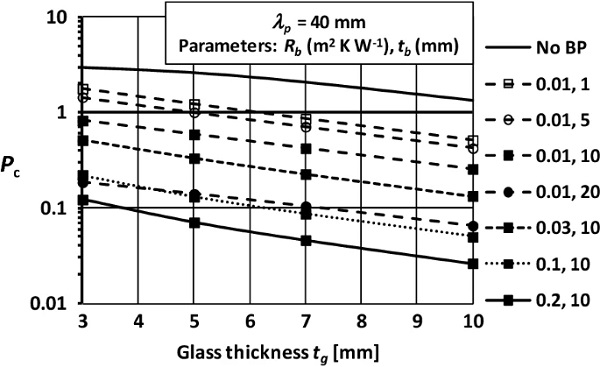
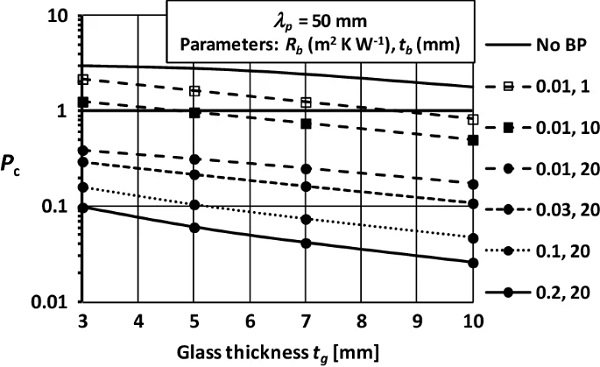
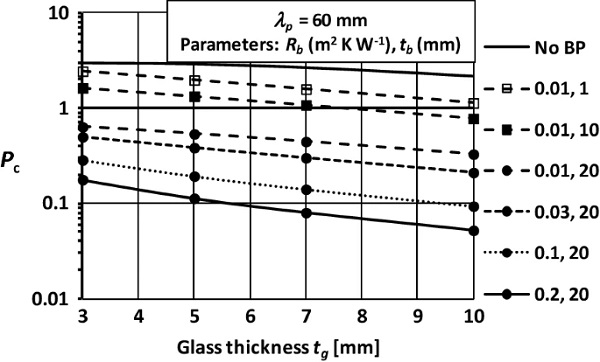
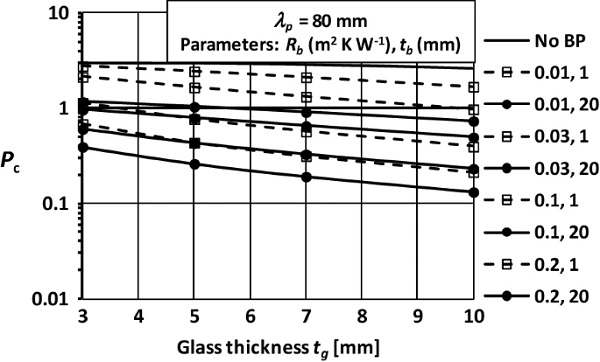
Figures 15, 16, 17, 18, 19 and 20 contain sufficient PC data to determine the magnitude of maximum possible measurement errors for all possible practical combinations of VIG designs and buffer plate parameters. Several examples of the use of these data are given in Sect. 6.7 below.
Including the effect of heat flow due to radiation
As noted in Eq. (5), to a very good approximation radiative heat flow is uniform and unaffected by the heat flow through the pillars. Radiation therefore does not contribute to the error Δhv in the measured thermal conductance of the VIG, and we can write:
![]()
Using Eq. (50), the maximum proportional error in the measured VIG thermal conductance can therefore be written:
![]()
Thermal performance data for insulating glazing units are conventionally presented as U-values, as this is the relevant quantity for assessing performance in practical installations. Following the same procedure in the derivation of Eq. (39), the maximum proportional error ΔU in the measured U-value of the VIG is:
![]()
Thus:
![]()
Maximum departures from average of measured VIG U-value
Table 3 presents numerical values of the quantities involved in the determination of the maximum possible proportional deviations ΔU/U from the average U-value, for several specific designs of VIG and selected buffer plate parameters. For each derived quantity, the relevant equation or data source is given. The dimensions of the square measuring areas are respectively 110, 105 and 100 mm for VIGs with pillar separations of 20, 30 and 40 mm in order to satisfy the "worst case" condition in Eq. (37). The different cases in this table are chosen to illustrate the procedures and tradeoffs required when selecting measurement parameters for a wide range of VIG designs.
Table 3 Examples of the maximum possible proportional deviation from average ΔU/U in the measured U-value for several VIG designs - Full size table
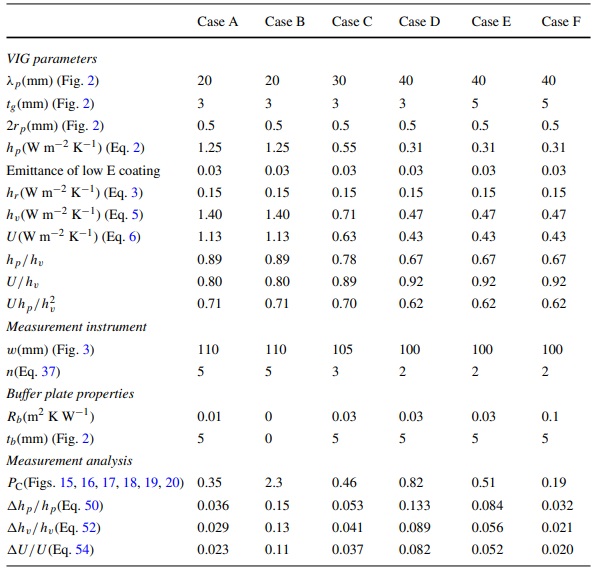
When measuring a VIG with 3 mm thick glass and 20 mm pillar separation using 5 mm thick buffer plates of resistance 0.01 m² K W⁻¹ (Case A), the largest proportional deviations from average ΔU/U are quite small (~ 2%). Reducing the buffer plate thickness to 1 mm increases PC to 0.065 (Fig. 16), resulting in a deviation ΔU/U of ~ 4%, which may be significant in some cases.
The deviations ΔU/U are significant (~ 4%) for VIGs with 3 mm thick glass and 30 mm pillar separation using 5 mm thick buffer plates of resistance 0.03 m² K W⁻¹ (Case C). For 40 mm separation and 3 mm thick glass (Case D), the deviations are unacceptably large (~ 8%) with these buffer plates. Even for 5 mm thick glass with 40 mm separation (Case E), the deviations for this buffer plate resistance are still significant (~ 5%). Increasing the buffer plate resistance to 0.1 m² K W⁻¹ reduces the deviation to ~ 2% (Case F) which is probably acceptable for most measurements. If a smaller maximum deviation is required a further increase in the resistance would lead to significant edge contributions to the measured heat flow. In such a situation, it would be necessary to use thicker buffer plates.
For VIGs with pillar separations > 40 mm, the data in Figs. 18, 19 and 20 show that the values of PC, and the associated maximum deviations from average ΔU/U in Fig. 14, are significantly larger. In such cases, higher resistance and thicker buffer plates are needed to reduce the deviations ΔU/U to acceptable levels. It may be necessary to locate the measurement area further than 90 mm from the edge seal in order that the edge contributions to the measured heat flow are tolerably small. This could necessitate the use of larger VIG specimens than discussed in Sect. 4.
If no buffer plate is used for a VIG with 20 mm pillar separation (Case B), the maximum error ΔU/U is unacceptably large (11%). This error would be approximately halved using a 210 mm square measuring area (n = 10 in Eq. 54). However, it is still significant. The maximum deviations are larger for VIGs with more widely spaced pillars. This result confirms the conclusion in Part 1 that, in general, measuring the heat flow through VIGs without using buffer plates will lead to unacceptably large maximum deviations from the average measured U-value for measurement areas of "worst case" size.
Obviously, these limitations on buffer plate parameters are less/more stringent for instruments with larger/smaller measuring areas, and for VIGs with higher/lower levels of thermal radiation, respectively.
In summary, for VIGs with pillars separated by 20 mm or less, the effect of non-uniformities in the heat flow associated with the pillar array is quite small for buffer plates with a resistance of 0.03 m² K W⁻¹ and thickness ≳ 5 mm. However, for glazings with pillars separated by 30 mm or more, buffer plates of resistance 0.1 m² K W⁻¹ and thickness > 5 mm should be used. In general, the use of buffer plates with resistance > 0.1 m² K W⁻¹ and thickness > 10 mm requires VIG specimens of dimension > 300 mm in order that edge effects are small.
Conclusions
The localised heat flow through the support pillars can cause errors to occur during the measurement of the thermal insulating properties of VIGs. The associated non-uniformities in the heat flux at the measurement apparatus can be significantly reduced with the use of buffer plates. The thermal resistance of the VIG is determined experimentally as the difference between measurements with and without the buffer plates. This paper analyses the errors that could occur in such measurements when using an instrument such as a guarded hot plate in which the measurement area is in direct thermal contact with the buffer plate.
Compared with a guarded hot plate, the heat flux transducer in a heat flow meter can reduce the non-uniformities in the measured heat flux. The maximum possible measurement errors that may occur with a heat flow meter can therefore be less than those given by the analysis in this paper.
The errors in the measured heat flow are affected by 5 parameters: the dimension of the square measurement area w, pillar separation λp, glass thickness tg, buffer plate resistance Rb, and buffer plate thickness tb. For all situations of practical importance, the maximum possible errors occur when the dimension of the measurement area is w=(n+1/2)λp, where nn is an integer.
Buffer plates with higher thermal resistance cause effects associated with heat flow through the edge seal to spread further across the surface of the VIG. The measurement area must be positioned far enough from the edge seal to reduce these edge effects to tolerably small levels. An analytic model is used to determine the extent to which these edge effects influence the measurement. For square measurement areas of dimension 100 mm and buffer plates with resistance up to 0.1 m2 K W−1, the errors are likely to be tolerably small for most practical VIG designs with the measurement area positioned at least 90 mm from the edge seal.
The maximum possible measurement errors associated with the heat flow through the pillars for any VIG in any measurement configuration can be characterised by a single parameter PC. Values of PC obtained by finite element modelling are given for all practically likely combinations of λp, tg, Rb and tb. An analytic expression involving PC is developed that gives the maximum possible errors for square measurement areas of dimension (n+1/2)λp, for all values of n.
Radiative heat flow between the internal surfaces of the VIG reduces the magnitude of the maximum possible errors in the measured thermal conductance of VIGs. A simple analytic expression is given for including the effect of radiation on the measurement errors.
For most VIGs with pillar separation up to about 30 mm and 100 mm square measurement areas, acceptably small errors are obtained with buffer plates of resistance up to 0.1 m² K W⁻¹. Achieving sufficiently small errors when measuring VIGs with more widely spaced pillars may require higher resistance buffer plates. In such cases, the measurement area should be positioned at distances > 90 mm from the edge seal. For very highly insulating specimens or when high accuracy measurements are needed, it may be necessary to use specimens of dimension > 350 mm.
Abbreviations
- A : Area [m²]
- D : Distance [m]
- d : Diameter [m]
- H : Height of pillar [m]
- h : Heat transfer coefficient [W m⁻² K⁻¹]
- k : Thermal conductivity [W m⁻¹ K⁻¹]
- n : Integer [-]
- Q : Heat flow [W]
- R : Thermal resistance [m² K W⁻¹]
- r : Pillar radius [m]
- s : Separation [m]
- T : Temperature [K or °C]
- t : Glass thickness [m]
- U: Unit cell
- U : U-Value [W m⁻² K⁻¹]
- w : Dimension of measuring area [m]
- x : Position coordinate [m]
- δ : Fraction [–]
- Δ : Change [–]
- ε : Emittance [–]
- λ: Separation of pillars [m]
- ζ : Specific resistance of one pillar [K W⁻¹]
- σ : Stefan Boltzmann constant [W m² K⁻⁴]
- C: Cold
- e : External
- g : Glass
- i : Internal
- H: Hot
- m: Mean
- p: Pillars
- r : Radiation
- v : Vacuum
- 1, 2, 3, 4: Identifying surfaces of glass sheets
Acknowledgements
The authors acknowledge the Sydney Informatics Hub and the University of Sydney’s high-performance computing cluster Artemis for providing the high-performance computing resources that have contributed to the research results reported within this paper.
Funding
Open Access funding enabled and organized by CAUL and its Member Institutions.
Author information
Authors and Affiliations
School of Physics, A28, University of Sydney, Sydney, NSW, 2006, Australia
Cenk Kocer, Antti Aronen & Richard Collins
Nippon Sheet Glass Co., Ltd., 6 Anesaki-Kaigan, Ichihara, Chiba, 299-0107, Japan
Osamu Asano & Yumi Ogiso
Corresponding author
Correspondence to Cenk Kocer.