
Authors: Aritra Ghosh, Senthilarasu Sundaram & Tapas K. Mallick
Source: Applied Energy, Volume 228, 2018 | https://doi.org/10.1016/j.apenergy.2018.07.040
(https://www.sciencedirect.com/science/article/pii/S0306261918310687)
Highlights
- Thermal and electrical performances were measured using indoor test cell for crystalline silicon based PV-vacuum glazing.
- Maximum PV cell temperature was achieved 97 °C under 1 sun exposure (1000 W/m2)
- Overall heat transfer coefficient was 0.8 W/m2 K for this glazing.
- Solar factor was calculated for this PV-vacuum glazing.
Abstract
Combined semi-transparent PV-vacuum glazing provides low overall heat transfer coefficient, reduces solar heat gain, generates clean electricity and admits comfortable daylight. In this work, thermal and electrical performances of a multicrystalline silicon based PV-vacuum glazing were characterised using indoor test cell. For this particular combined system, PV covered 32% of the glazing area. Two different combinations of PV-vacuum glazing systems were manufactured where for the first case vacuum glazing faced test cell external environment (VPS) and for the second case vacuum glazing faced test cell internal environment (SPV).
SPV type was found to have superior performance as PV cell achieved lower temperature than VPS type after 125 min exposure under 1000 W/m2 constant intensity from a simulator. For this type PV-vacuum glazing, overall heat transfer coefficient (U-value) was 0.8 W/m2 K and the solar factor was 0.42. U-value of this PV-vacuum glazing was 66% lower and the solar factor was 46% lower than PV double-glazing. Close power drop from PV due to elevated temperature was observed for both PV-double and PV-vacuum glazing.
1. Introduction
Consumption of world energy increased by 40% from 1990 to 2007. Until 2035, another 8–10% increment is expected due to rapid growth of urbanization [1]. Transport, industry and buildings are the major energy consuming sectors. Building sector alone accounts 40% of global energy. To mitigate this high building energy demand, zero energy or low energy buildings are potential [2]. To achieve efficient buildings, energy efficient windows are essential which can control incoming excessive solar heat gain (reduce building cooling load), limit heat loss (reduce building’s heating load), and maintain comfortable daylight (possess discomfort glare). However, windows are the most essential building envelope by allowing visual connection between indoor space and external environment.
Building-integrated photovoltaic (BIPV) glazings are innovative and emerging glazing technology which has capability to replace conventional low performance building facade materials. In urban cities and places where rooftop and ground areas are limited, semi-transparent BIPV glazing or glazed façades are alternative advanced technology [3]. In a photovoltaic (PV) glazing, PV device is sandwiched between two glass panes [4]. This glass –PV –glass structure is advantageous over traditional PV device as they allow daylight into the indoor space while they are installed as a BIPV. Thus, a semi-transparent BIPV glazing controls entering solar heat gain and discomfort glare, introduces comfortable daylight, and generates electricity.
PV device for BIPV glazing includes first generation silicon, second generation amorphous silicon (a-Si) [5], cadmium telluride (CdTe) [6], CIGS, third generation DSSC [7] and perovskite [8]. Second and third generation PV devices have advantages over silicon as tuning the thickness modulation of transparency is possible. However, DSSC [9], and perovskite [10], [11] both have stability issue which hindrance them to be applied as practical glazing under outdoor environmental condition. Second generation a-Si is the most investigated PV device for PV glazing application as their see through structure allow natural daylight [12]. Second generation a-Si, CdTe and CIGS have currently reached the best laboratory efficiency of 11.9%, 21.7% and 21.4% respectively [13]. Crystalline silicon is still preferable over all those aforementioned PV as it offers high efficiency and high stability under outdoor environment.
Semi-transparent type PV glazing introduces daylight illuminance into the indoor space, which is not possible to obtain from an opaque silicon based PV glazing. Thus spaced type PV structure using crystalline silicon based glazing is attractive. These regular distributions of small area PV cells block the incident incoming solar radiation and the gap between cells allow daylight and near infrared radiation (NIR) [14]. Depends on the PV coverage different transparency level is achievable [15]. To obtain best PV cell coverage, local climatic conditions, buildings orientation and consumptions details are essential [16].
PV glazing has potential to reduce cooling load but increase seasonal heating loads [17] as it blocks incoming solar heat gain. For cold climate building, comfortable daylighting, high solar gains and low heat loss are required. Thus, for large glazed façades, vacuum glazing type is the best choice to provide allowable daylight and allow solar heat gain for reduction of the space heating demand during day time [2]. Vacuum glazing is composed of two low – emissivity (e) coated glass panes, arrays of small pillars between the two glasses to sustain the outside atmospheric pressure and leak free edge sealing [18], [19].
Vacuum glazing offers low heat transfer as vacuum between two glasses reduce conductive and convective heat transfer and presence of low emission coating reduces the radiative heat transfer [20]. First vacuum glazing was fabricated using high temperature melting point solder glass edge sealing which degrades low emission coating [21]. Low temperature indium alloy edge sealing was employed later on to enable the low-e coating [22]. Cerasolzer type CS186 was also investigated for replacement of costly indium edge sealant [23]. Metal-based opaque small pillars array was replaced by transparent pillars to make this glazing more aesthetic [24].
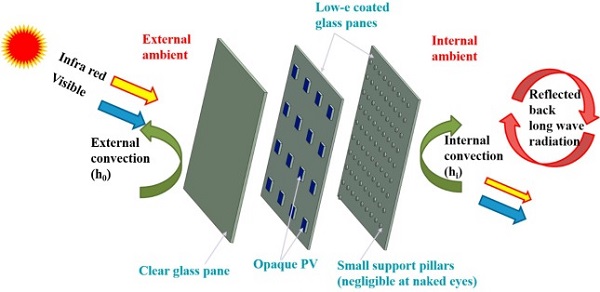
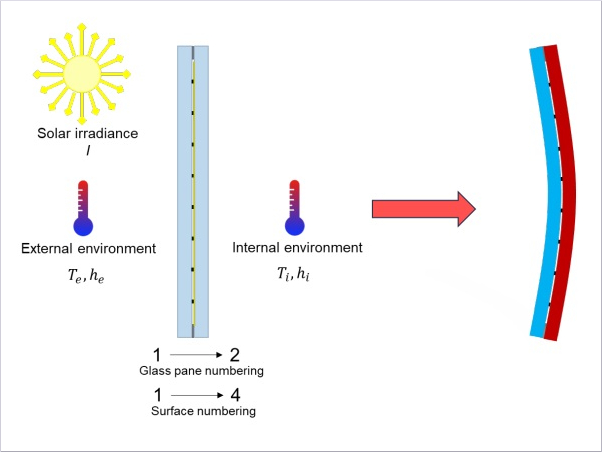
Vacuum glazing offers similar transmittance to a double glazing with 53% low heat loss compared to double glazing [18]. This higher transmittance often creates discomfort glare. Addition of solar heat gain-glare control PV material can control this excessive glare and possess suitable daylight. Addition of spaced type PV and vacuum glazing will form low heat loss clean power generating glazing as shown in Fig. 1. Spaced type semi-transparent PV-vacuum glazing is truly multifunctional by controlling solar heat gain, heat loss, glare and introduces allowable daylight. Interesting fact of this glazing is that no distortion of transmitted light through the non-PV covered part of the glazing. This indicates that daylight available outside will be very similar to inside after passing through this glazing as light passes through only three silica made glass pane and low emission coating.
a-Si PV based PV-vacuum glazing is the only reported combined PV-vacuum glazing work where total four glass panes were employed [25]. We report for the first time thermal performance of multicrystalline silicon based semi-transparent (32% PV cell coverage and 33% spectral solar transmittance through non-cover part) PV-vacuum glazing using indoor test cell characterisation. Total number of glass panes for this work was three. In this work,
- two different combinations were prepared. In the first case, vacuum glazing faced external laboratory ambient and for the second case, vacuum glazing faced internal test cell ambient; Results were compared with similar area semi-transparent PV-double glazing (32% PV cell coverage);
- electrical performance of PV device was evaluated for the presence of vacuum glazing;
- overall heat transfer coefficient of combined PV-vacuum glazing was investigated;
- solar factor was determined for this semi-transparent combined glazing.
Results of this work will be beneficial for retrofit or low energy building designer.
2. Experiments
2.1. System fabrication
To realize semi-transparent PV-vacuum glazing, vacuum glazing dimension of 0.35 m × 0.2 m from NSG SPACIA, multicrystalline solar cell dimension of 0.155 m × 0.155 m, and Pilkington k glass single glazing dimension of 0.35 m × 0.2 m were combined. Three different systems of which two PV-vacuum glazing and one PV double glazing for comparison were fabricated for the experiment. For type 1 PV vacuum glazing, PV cell was placed on the top of single glazing, and after pouring sylgard encapsulation vacuum glazing was placed on the top of it.
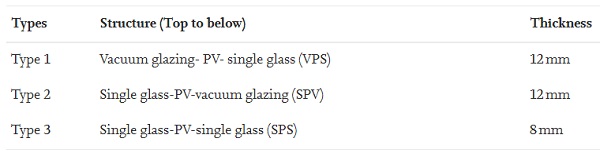
Type 1 PV glazing is referred in this work as VPS PV-Vacuum glazing as shown in Fig. 2. For type 2 PV-vacuum glazing, PV cell was placed on the top of vacuum glazing and after sylgard encapsulation, single glazing was placed. Type 2 is referred as SPV PV-vacuum glazing for this work. Type 3 was prepared by glass PV glass structure to compare with the aforementioned two types of PV vacuum glazing. This type of glazing is indicated as SPS or PV-double glazing. For all three types of glazings, PV cell covered 32% whereas 68% area was non-covered by PV. Details of these three systems are mentioned in Table 1.
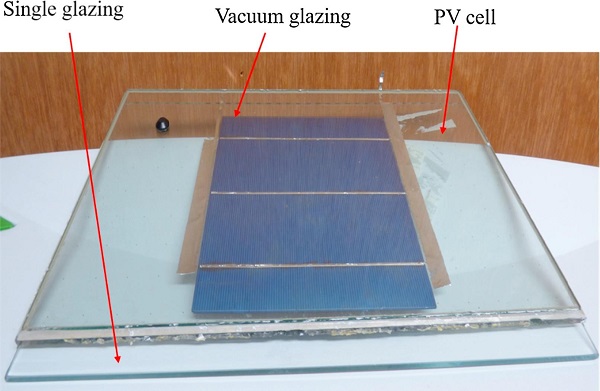
Table 1. Details of different types of systems.
A small-scale test cell dimension of 0.37 m × 0.22 m × 0.26 m was fabricated using 10 mm thick polystyrene to perform indoor characterisation. The ratio of test cell and glazing was 1:1. Outdoor characterisation using test cell offers several constraints and internal and external variables act simultaneously. Therefore it is difficult to differentiate a single responsible variable which influences the results [26]. Thus, in this work, indoor characterisation at laboratory environment was preferred. Glazing was attached on top of the test cell such that it faces the indoor simulator directly, which resembles similar to a vertical plane glazing facing south.
For VPS type PV-vacuum glazing, vacuum glazing faced laboratory room environment and single glazing faced test cell indoor environment. For SPV type PV-vacuum glazing single glazing faced laboratory room environment and vacuum glazing faced test cell indoor environment as shown in Fig. 3.

2.2. Indoor characterisation set up
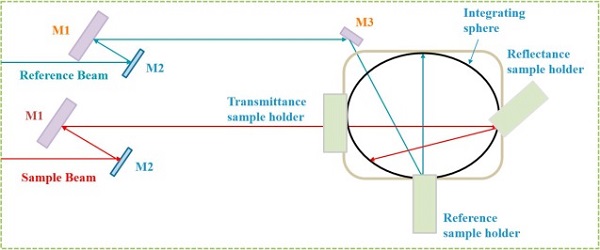
Transmittance and reflectance at solar spectrum (280 nm -2500 nm) of prepared glazing systems were measured using an ultraviolet–visible–near infrared (UV/VIS/NIR) spectrophotometer (PerkinElmer® Lambda 1050) equipped with an integrating sphere (150 mm diameter) with 2 nm interval as shown in Fig. 4.
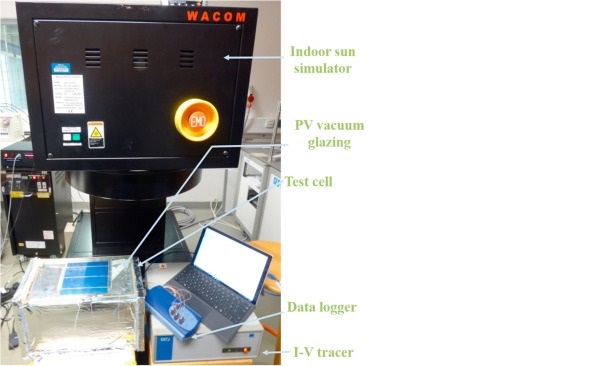
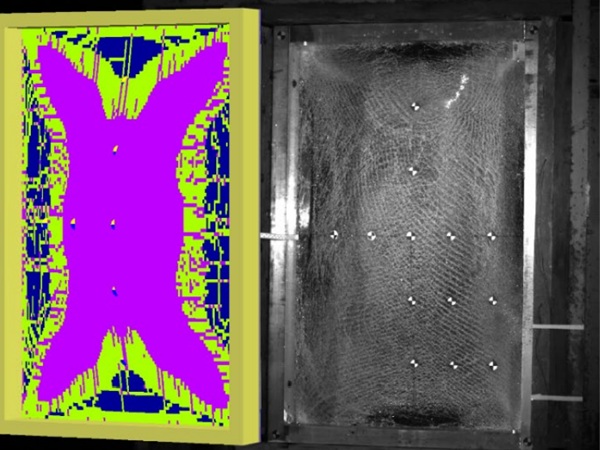
The indoor characterisation was performed using continuous indoor sun simulator exposure. This simulator is AAA type and its spectrum matches with solar spectrum between 250 nm and 3000 nm. Five thermocouples were employed to measure external and internal glass surface, test cell ambient and indoor laboratory ambient and PV cell temperature. Pico data logger recorded 5 min interval temperature data. Photograph of full experimental set up is shown in Fig. 5.
3. Methodology
Thermal transmission and solar heat gain are the two major modes of heat transfer through a glazing technology [27]. Overall heat transfer coefficient indicates how well a glazing is insulated by evaluating the amount of heat that passes, in steady state, through the central part of the glazing. Evaluation of overall heat transfer coefficient depends on external, internal, thermal conductivity and thickness of glazing. Solar heat gain coefficient (solar factor) shows the admittance of solar heat gain through the glazing into an indoor space [28].
Overall heat transfer coefficient for this PV vacuum glazing was calculated using below equation
![]()
where
Qin is the incident radiation on the glazing [29]
![]()
Total heat transfer through the glazing is given by [30]
![]()
The total heat inside the test cell is given by [31]
![]()
The total heat losses through the test cell can be represented by equation
![]()
Overall heat transfer coefficient of this glazing is given by
![]()
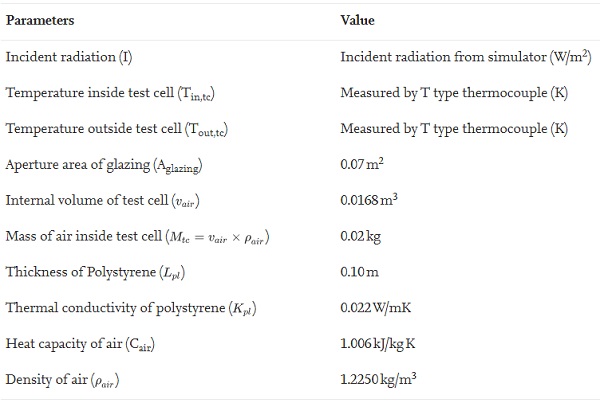
Required parameters to find out U-value for this combined vacuum glazing is listed below Table 2.
Table 2. Parameters details for U-value calculation.
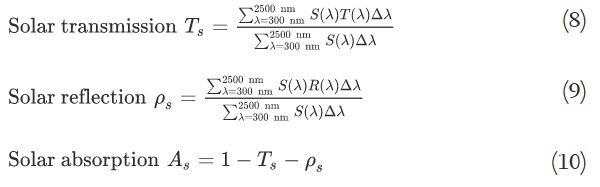
Solar factor (g) or solar heat gain coefficient indicates the transmitted solar energy through a glazing. Spaced type PV-vacuum glazing consists transparent and opaque portion. Thus g value for this system is given by Eq. (7) [32].
![]()
where solar transmission, reflection and absorption are given by Eqs. (8), (9), (10) respectively. In the Eq. (7), hout and hin are the external and internal heat transfer coefficient.
Net energy flows through a glazing in a building can be decided using Eq. (11) [33].
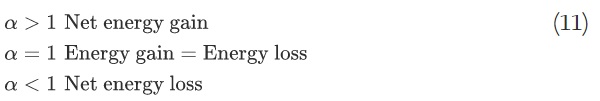
where α shown in Eq. (12) is the ratio of solar gains to thermal losses
![]()
4. Results and discussions
4.1. Spectral performance
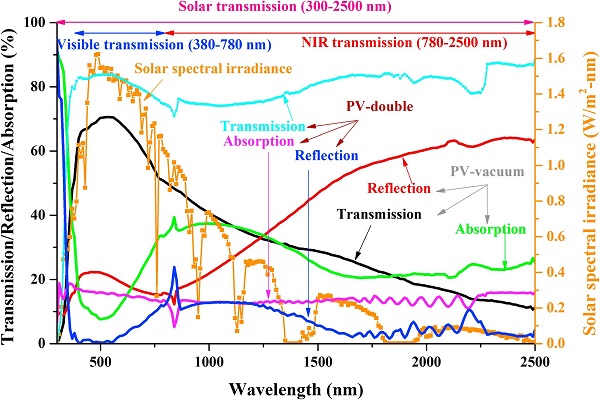
Spectral transmission, reflectance, absorption were measured for combined PV-vacuum and PV double glazing using UV–VIS-NIR spectrophotometer and calculated using Eqs. (8), (9), (10) respectively as shown in Fig. 6. Calculated solar transmission (Ts), reflection (ρs) and absorption (As) for non-covered part of PV-vacuum glazing were 33%, 40% and 27% respectively. These parameters qualitatively define the spectral behaviour of the entire PV-vacuum glazing. Higher transmission was around 550 nm. Obtained low transmission and higher reflection in near infrared (NIR) region were due to presence of low emission coating in the vacuum glazing. Average solar transmission was 77% whereas solar reflectance and absorption was 14% and 8% respectively for PV-double glazing.
4.2. Surface thermal performance
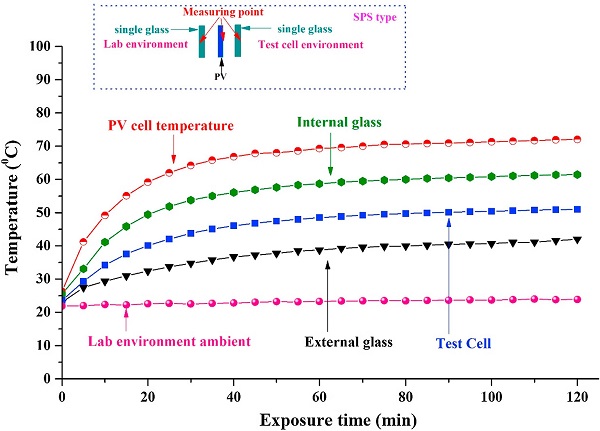
Fig. 7 shows the temperature variation of PV vacuum glazing under constant 1000 W/m2 solar radiation from an indoor simulator. This structure is SPV type PV-vacuum glazing where single glazing faced laboratory environment and vacuum glazing faced test cell internal environment. PV cell temperature increased from 32 °C to 86.4 °C after 125 min of exposure. First 40 min of exposure, cell temperature increased at 1.25 °C/min while laboratory room temperature increased at 0.025 °C/min.
During the same interval internal glass surface temperature increased at 0.625 °C/min. Next 80 min PV cell temperature increased from 80 °C to 86 °C. Temperature difference between PV cell and internal glass surface was due to the heat insulation properties of vacuum glazing. Vacuum glazing reduces conductive and convective heat flow whereas the presence of low-e coating restricts radiative heat flow. Thus, overall heat flow from the cell through the vacuum glazing is restricted.
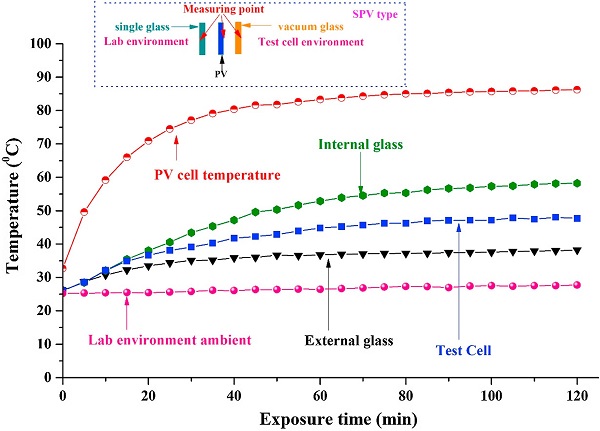
Fig. 8 shows different temperature of VPS type PV vacuum glazing after 125 min exposure under 1000 W/m2 using an indoor simulator. In this case, vacuum glazing faced indoor laboratory environment and single glazing faced test cell internal environment. PV cell temperature increased from 26 °C to 97 °C with an increased rate of 1.36° C/min at the first 40 min. Test cell internal temperature increased at 0.45 °C/min during the same interval. PV cell temperature and internal glass temperature both increased nearly same rate. This is due to the presence of single glazing which allowed higher heat flow from PV cell through the glass.
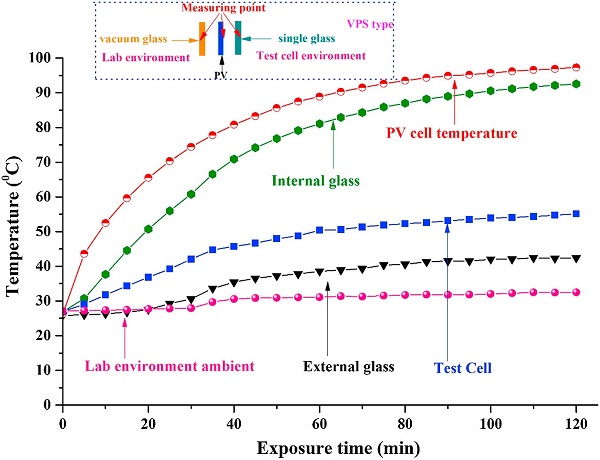
Fig. 9 shows the temperature changes for PV double-glazing. PV cell temperature increased at 1 °C/min at first 40 min of exposure. This increment is very close to the SPV type PV vacuum glazing. Spectral behaviour of PV-double glazing showed (Fig. 6) higher solar transmission compared to PV-vacuum glazing (Fig. 6). Moreover, PV-vacuum glazing’s solar transmission reduced due to the presence of low-e coating.
However, in Fig. 9 the test cell internal temperature was low compared to both combinations of PV-vacuum glazing. The reason for this lower test cell internal temperature was due to the low thermal insulation of this double glazing. This double glazing was prepared by attaching two 4 mm thick single glazing with minimal (1 mm) air gap between them. Thus this combined glazing behaved similar to an 8 mm thick single glazing under indoor simulator exposure. Due to the thermal bridge between two glass panes, heat loses where higher compared to PV-vacuum glazing.
4.3. PV performance
PV cell performance for two different type combined PV-vacuum glazing was measured using I-V tracer as shown in Fig. 10. PV double glazing measurement was also conducted for comparison. Measurements were carried out for 125 min continuous exposure under 1000 W/m2 indoor simulator radiation. PV cell temperature dependent open circuit voltage (Voc) has been shown for three different types of glazing systems in Fig. 10. Voc has dependency on the characteristics of PV material.
Thus, variation of Voc depends on the saturation current and light generated current. PV cell temperature dependent Voc is given by Eq. (13) [34]. At high cell temperature, energy band gap of PV cell decreases (semiconductor bandgaps decrease with temperature [35]) and consequently Voc is decreased. Reduction of Voc for VPS type glazing was 25% from its initial conditions while for SPV and SPS type it was 20% and 16% respectively.
![]()
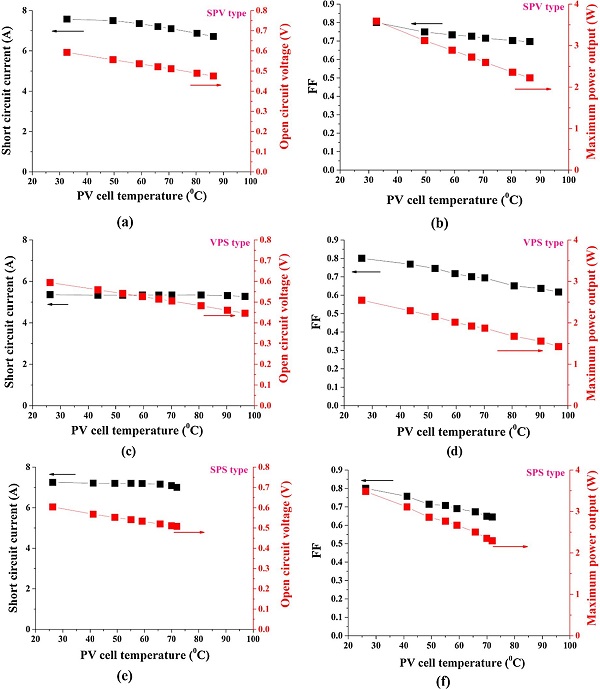
FF shows optimal current/voltage trade-off and the minimal extracting cost of photogenerated charges from the cell into the circuit [35]. At higher illumination due to increase of current flow resistive losses increase which can be seen from series resistance (Rs) dependent FF Eq. (14) [36]. In this work reduction of FF for SPV, VPS, SPS type were 13%, 23%, 19%. Decrease of FF was due to the increase in resistive losses for the higher continuous illumination.
![]()
Maximum power of PV cell can be expressed by Eq. (15). Thus, reduction of maximum power (Pm) is directly proportional to the reduction of open circuit voltage, and Fill factor (FF). Reduction of maximum power for SPV, VPS, and SPS type from initial conditions were 38%, 44%, 34% respectively. Maximum power drop of PV cell was not remarkably high for the presence of vacuum glazing compared to single glazing. Maximum power output reduced in higher order for VPS type glazing as PV cell temperature increased from 32.7 °C to 96 °C.
![]()
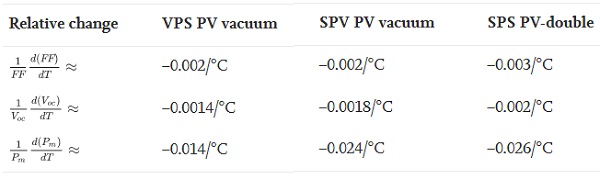
It is seen from Fig. 10 that the open circuit voltage (Voc) and fill factor (FF) and maximum power (Pm) decreased with higher PV cell temperature. These results are in agreement with the previously published literature [37], [38], [39], [40]. The relative change in FF, Voc and Pm for three different systems are listed in Table 3. Close power drop of PV for PV-vacuum and PV-double glazing enhances the possibility of using PV-vacuum for glazed façade application.
Table 3. Relative change of FF, Voc, Pm for VPS and SPS type PV vacuum glazing and PV double glazing.
4.4. Thermal transmission and solar factor (SHGC)
Thermal transmission of PV-vacuum glazing and PV double-glazing was calculated using Eq. (6). Calculation was performed after surface temperature reached close to steady state condition. Fig. 11 shows the overall heat transfer coefficient of PV-vacuum glazing. Calculated average U-value for this glazing was 0.8 W/m2 K. Previously, using outdoor test cell, thermal transmission of vacuum glazing and combined SPD-vacuum glazing were found to be 1.4 W/m2 K [18] and 1.0 W/m2 K [30] respectively.
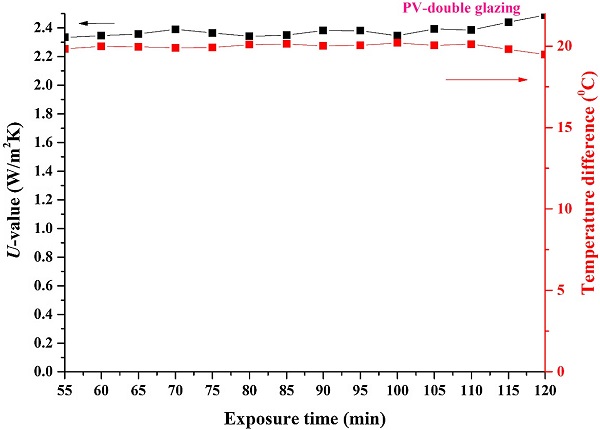
Higher external wind speed influenced those results. In this work wind speed was negligible and temperature difference between test cell internal and laboratory environment govern the result. Fig. 12 shows the overall heat transfer coefficient of PV double-glazing. Average U–value for this system was 2.37 W/m2 K. Previously evaluated double glazing U-value for outdoor condition was 2.98 W/m2 K [29]. Thus, thermal transmission results of both PV-vacuum and PV double glazing are in agreement with the previously published work.
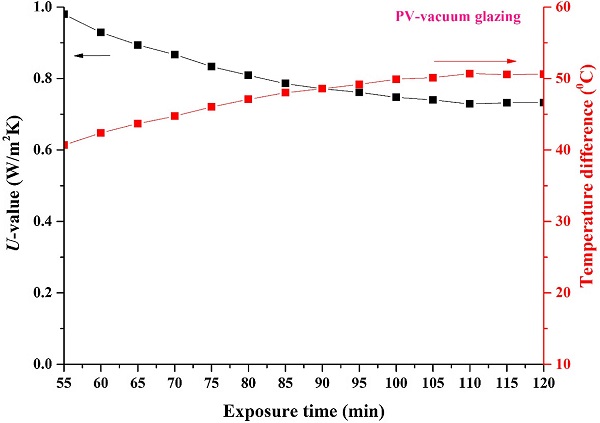
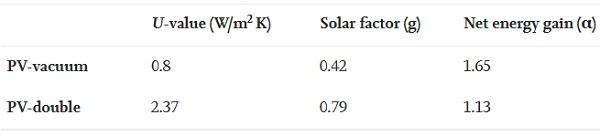
Higher temperature difference between test cell internal and external environment was found for PV-vacuum combined glazing due to lower U-value than PV double glazing. U-value reduction of 66% was possible using vacuum glazing integrated with PV glazing. Solar factor for these combined glazing was calculated using Eq. (7). For PV vacuum glazing the solar factor was 0.42 whereas for PV-double glazing solar factor was 0.79. Net energy through this PV vacuum glazing was evaluated using Eq. (12). Net energy higher than 1 indicates this glazing is suitable for cold climate and shows 46% higher energy gain compared to PV-double glazing. Table 4 listed the different thermal loss and solar gain of these two glazings.
Table 4. thermal loss, solar gain and ratio of solar gain thermal loss for PV-vacuum and PV-double glazing.
5. Conclusions
Experimentally thermal and electrical characteristics were performed for semi-transparent (32% area was covered by PV cell) combined PV- vacuum glazing and PV double glazing using indoor test cell. For PV-vacuum glazing, two different combinations SPV and VPS types were fabricated. Total three glass panes were employed to manufacture each type of PV-vacuum glazing system. Vacuum glazing was facing test cell indoor environment and single glazing was facing laboratory environment for SPV type whereas vacuum glazing was facing laboratory environment and single glazing was facing test cell environment for VPS type. Two glass panes PV double glazing was manufactured and employed to compare results with semi-transparent PV-vacuum glazing.
For all three types of glazing, PV cell temperatures were higher than glass surface and test cell indoor temperature. Maximum PV cell temperature was 97 °C for VPS type as presence of vacuum glazing on the external side works as a heat insulator. Rise of PV cell temperature was lower for SPV type due to presence of single glazing on the external side which allowed higher heat transfer from PV cells to environment. Semi-transparent SPV and VPS both offered equal U-value, solar factor (g-value) and transmission, however, PV cell performance was superior for SPV type.
PV cell performance for PV-vacuum glazing did not outperform in higher order compared to PV-double glazing. Moreover, 66% lower U-value and 42% lower solar factor make PV-vacuum glazing a suitable candidate for low energy building. For cold climatic condition, PV-vacuum glazing is potential due to low U-value. Net energy analysis also confirms that this PV-vacuum combination is useful for cold climate. Lower ambient temperature can alleviate or control the rise of PV cell temperature, which will enhance the power output. This is the first electrical performance investigation of PV cell using PV-vacuum combination.
Acknowledgement
This work has been conducted as part of the research project ‘Joint UK-India Clean Energy Centre (JUICE)’ which is funded by the RCUK's Energy Programme (contract no: EP/P003605/1). The projects funders were not directly involved in the writing of this article. In support of open access research, all underlying article materials (data, models) can be accessed upon request via email to the corresponding author.


