First presented at GPD 2017
On the one hand there is the ring-on-ring test for the determination of the strength of glass without and on the other hand there is the four-point-bending test for the determination of the strength of glass with the influence of the edge strength. All these tests are described having perfect conditions. For example, glass is homogeneous or test set-ups are without any imperfections. One interesting part is the distribution of the residual stress through the thickness and along the surface.
Residual stress is caused by thermal or chemical pre-stress of glass. In case of heat strengthened or fully tempered glass photo-elastic studies of the stress distribution showed that the distribution along the surface is not homogeneous.
This not constant distribution is shown in a grey pattern, which can be visualized with the principle of polarized light. This paper is a discussion about this grey pattern, imperfections and measured stress with the help of SCALP stress measurement device. This investigation helps to understand much better the reason of the location of the origin of fracture.
1. Introduction
Thermal treatment
Thermal treatment is a typical process of pre-stressing, according EN 12150 [1] or EN 1263 [2], of glass in which the glass is moved on rollers forwards into the heating zone and is heated up above the transition point. After this heating phase, the glass is blown off with air. During the phase of cooling to ambient temperature, glass is permanently moved forwards and back-wards on rollers up to the end of the furnace. The thinner the glass the bigger so-called roller waves can occur.
For this reason, the Austrian company LISEC has investigated a process in which the glass is transported on air cushion. This technique gives the possibility to pre-stress thinner glass by thermal treatment without roller waves.
Chemical treatment - Ionic Exchange
Another possibility to pre-stress the glass is chemical treatment according EN 12337 [3]. The glass is immerged into molten potassium nitrate. At a temperature of approx. 370 - 450°C the effect of ionic exchange takes place. The smaller sodium ions diffuse from the glass into the liquid potassium nitrate and the larger potassium ions penetrate into the glass matrix. Due to the larger ionic diameter of potassium ions, compressive stresses in the close up range of the surface result. The depth of penetration the so-called case depth is around 30 – 100 µm. [4]
2. Test scenarios for determination of ultimate bending strength
In case of thin glass with a thickness less than 2 mm the values for ultimate bending strength, which are the basis for a structural design, are still missing. Therefore, a couple of different test scenarios were investigated for their applicability for determination of ultimate bending strength of thin glass. Due to the application one has to differ between test scenarios with and without the influence of the edge strength (edge quality) – the socalled edge effect. In the following a couple of possible test scenarios were investigated.
Ring-on-ring test – EN ISO 1288
The test set-up is performed by placing the glass sample on a circular steel reaction-ring (supporting ring) and applying on its upper surface a load transmitted through a steel loading-ring, until the glass breaks. The purpose of this test is to achieve a uniform tensile stress field inside of the loading ring that is independent of edge effects. As described in NEUGEBAUER [5] these in EN 1288 described test scenarios fail for thin glass.
Silicon pad/ pressure pad
As a possible of improvement of the ring-onring test a silicon-pad or pressure-pad on ring test was investigated. The test set-up is performed by placing the glass sample on a circular steel reaction ring (supporting ring) and applying on its upper surface a load transmitted through a silicon or pressure pad instead of the loading ring, until the glass breaks. The advantage of such test setup is that in the centre of the glass a homogenous stress distribution arises. [5]
Four-point bending test
In case of thin glass large deflections result and the bearing forces are not longer vertical but inclined. The glass pane distributes its bearing force only by contact and eventually by friction be-tween glass and rubber (EPDM). Due to the thinness no breakage of these thin glass panels can eventually be reached, because of slip from bearing pins due to bowstring effect (distance of pins is constant but ends of panes move towards) or on some testing machines reach of maximum piston stroke. [5]
Bending with axial force
The value for the ultimate bending strength can for example be determined with a kind of a stability test. With a force F and eccentricity e the maximum stress can be determined according the theory of large deformations. Instead of inducing bending by loading perpendicular to test specimen an alternative concept applies the load in plane of the test specimen with bending due to deflection. [5]
Bending with constant radius
Instead of introducing the load in plane as described above it is also possible to apply the load with a rotation of the shorter opposite edges and a reduction of the distance between the supporting hinges, as described NEUGEBAUER [5]. With an accurate adjustment of the length of bowstring (distance between the supporting hinges) of the arched bent glass sample and the applied rotation a constant stress distribution on nearly the whole bent edges (excluding a small zone at the straight edges where the rotation is introduced) arises. [5]
3. Stress distribution on surface
Anisotropy
In general, the phenomenon of anisotropy can be defined as a characteristic of the material, that has directionally dependent behaviours of the material for example like tensile strength, conductivity or refractive index. In case of glass, the anisotropy effect results from the presence of polarized light in the natural environment, the birefringent property the anisotropy of the refractive index of glass (photoelasticity) and mechanical stresses in the glass due to the thermal pre-stressing process. [6].
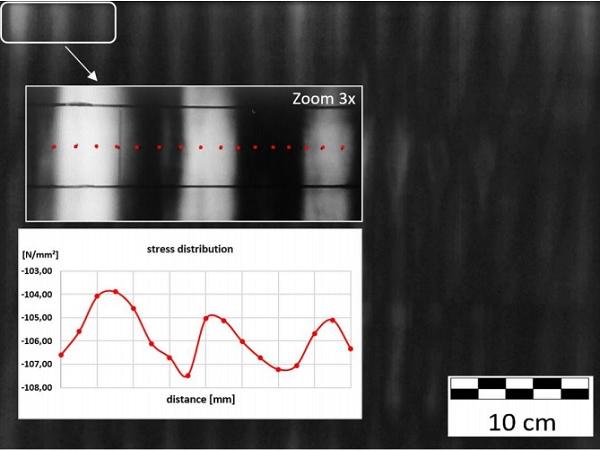
To understand this behaviour much better pre-stressed glass was investigated with the help of the physic principle of polarisation. In case of fully tempered glass a so-called “zebra pattern” arises, the picture is shown in figure 1 below. This 8 mm glass is pre-stressed in a conventional tempering furnace on rollers. In certain points the residual stress on the surface were measured with help of SCALP measurement device.
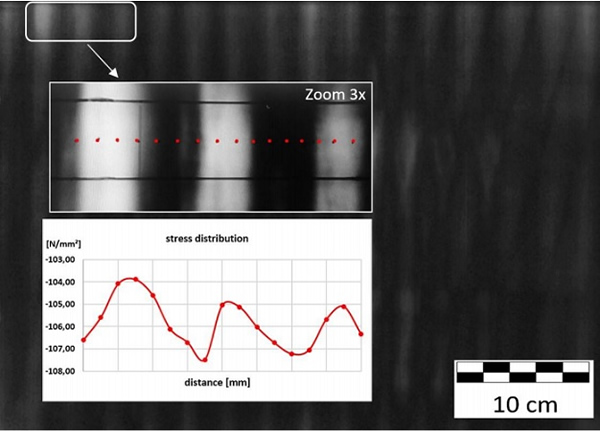
As shown in the diagram in figure 1 above the measured residual stress in not homogenous along the surface. The level of stress is varying in a range of maximum and minimum. In this case the compressive stress at the surface was measured between s = -102.8 and -107.5 MPa. For the discussion of the determination of the ultimate bending strength these distributions, caused by tempering processes, have to be taken into account.
Not only the distribution along the surface has an influence on the bending strength the distribution through the thickness has to be taken into account as well.
4. Stress distribution through thickness
The stress distribution through the thickness of glass is characterized with a zone of compression stress at the surface and a tension stress in the core of the glass pane. A comparison of a fully tempered and a chemically pre-stressed glass is shown in figure 2. In general, a chemically toughened soda lime glass has a surface compression stress with around σ = -300 MPa, but the compression zone is with 50 mm very thin.
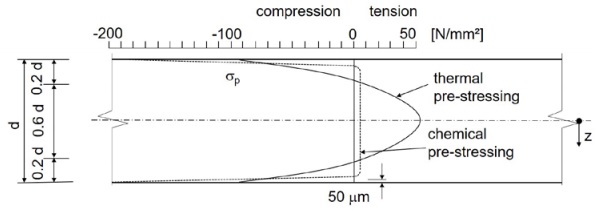
Special aluminium silicate glass can be pre-stressed up to σ = -1000 MPa. In comparison to the chemically treated glass a fully tempered glass has a residual stress of around σ = -120 MPa, but a thickness of the compression zone of around 0.2d (20% of the thickness). The tension stress in the core is much smaller than in case of thermally tempered glass.
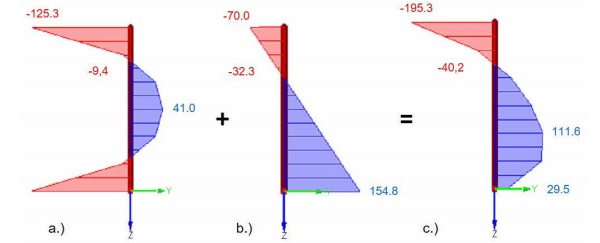
Such a stress distribution could be modelled with the help of finite element programs.
Figure 3 shows in (a.) the stress distribution of a fully tempered glass with a surface pressure of σ = -125.3 MPa and a tensile stress of σ = 41MPa in the core of the glass pane. In the same figure the illustration (b.) shows the stress distribution due to a loading according a test scenario with a pressure pad as described in chapter 2 before. This distribution results from pure bending with σ =± 112,4 MPa and a constant stress distribution due to membrane forces σ = + 42,4 MPa (tension). The residual stress and the stress due to the loading have to be added. The result of this superposition is shown in figure 3 (c.) beside.
5.Defects
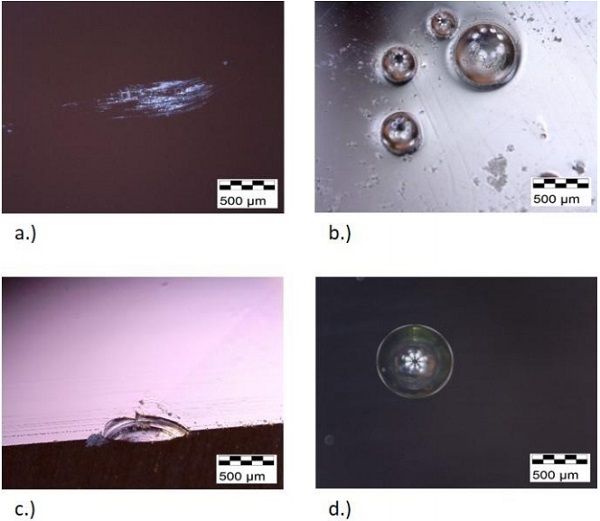
The theoretical strength of glass is given at around 10,000 MPa in different literatures. In contrast to the theoretical strength the measured bending strength of, for example, annealed glass is around 80 MPa. This enormous reduction of the strength of the glass results from imperfections on the surface (e.g. cracks, scratches) and in the glass matrix (e.g. NiS inclusions - as the origin of fracture due to volume change of NiS) itself. Figure 4 below shows some examples for defects on the surface (a. and b.), at the edge (c.) or in the glass matrix itself (d.). Such defects can arise from the very first beginning of the production of glass e.g. on the floatglas line, during the manufacturing of glass products due to handling or in the lifetime of glass e.g. cleaning.
Defect a.) in figure 4 below shows simply scratches due to wrong cleaning work and defect b.) shows bubbles on the surface which occurred during the glass production. Defect c.) is an edge defect which is being caused by wrong edge finishing and defect d.) shows a bubble (inclusion) in the glass matrix which occurred during the glass production.
In the following discussion in this paper a surface flaw before the pre-stressing process is assumed. For a better understanding a stress distribution in the close up area of the surface flaws were deeper investigated. As a result of this analysis the following stress distribution in the near field of the bottom of the flaws is shown in figure 5 below.
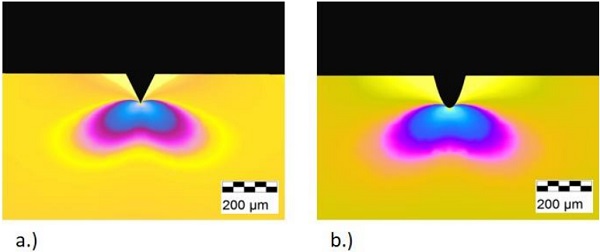
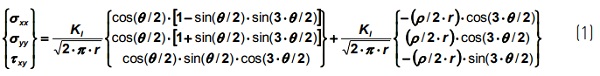
Figure 5 shows the stress concentration of the principle stress σ1 of two simplified types of surface flaws, a very sharp bottom of the flaw (a.) and a rounded out bottom of the flaw (b.). The depth of the flaws is assumed with 0.1 mm for further investigations. At the bottom of the flaws stress concentrations arise. This phenomenon is described in several publications like in SCHULA [7] or GROSS [8]. In these publications an analytic approach with the following equation1 for the determination of the stress distribution in the near field of the bottom of the surface flaw is given.
With the following assumptions, as assumed Research & Development for the finite element simulation, nearly the same stress distribution could be determined as with the finite element model. The distance from the location of interest to the midpoint M of the rounding is given with r = 0,03 mm and the angle q is perpendicular to the surface of the glass (θ = 0).
The following figure 6 supports the explanation of the input data for the equation 1 as described above.
![Figure 6 Sketch of a surface flaw for the explanation of equation 1[7]](/sites/default/files/inline-images/Fig6_38.jpg)
The diameter of the rounding of the bottom of the surface is assumed with ρ = 5 µm. This simplification with a tip radius of 5 µm is an assumption for the above described investigation, but microcracks can be also very "sharp" with a radius on an atomic scale. The stress field without a defect is assumed with σ = -125.3 MPa, as described in chapter 4. For the determination of the stress concentration factor KI the geometry factor Y is give with Y = 1,1215 for long surface flaws.
The stress σyy in the closed up area in direction parallel to the surface (as shown in figure 6 above) was calculated with σyy = -186.4 MPa, which coincide very well with the stress, which was determined with help of finite elements, with σ = -193.2 MPa, as described in the next chapter below.
6. Stress distribution with surface defects
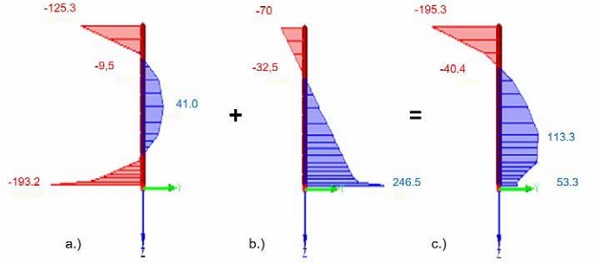
This additional influence of the surface flaws is furthermore investigated with a simulation with the help of a finite element program. At the bottom of the flaw a stress concentration due to the thermal pre-stressing arises with σ = -193.2 MPa in comparison to the upper surface without a defect (σ = -125.3 MPa), as shown in figure7 (a.).
The same effect of stress concentration arises due to the loading, as shown in figure 7 (b.). As described in previous chapter 4 both stress distributions were added and the result is shown in figure 7 c.).
7. Summary
For the determination and of the ultimate bending strength and a better understanding of the nature of the fracture mechanism it is crucial to combine the information about the stress distribution along the surface and through the thickness, the stress distribution due to loading and the influence of the defects on the surface and in the glass matrix. With the knowledge of all these components it is possible to predict the location of the origin of fracture.
8. Acknowledgements
The paper is a result of the research project “Josef Ressel Centre for thin glass technology for structural glass applications” funded by the Austrian Christian Doppler Research Association.
9. References
[1] EN 12150; Glass in buildings – Thermally toughened soda lime silicate safety glass
[2] EN 1863; Glass in building ― Heat strengthened soda lime silicate glass
[3] EN 12337; Glass in buildings – Chemically strengthened soda lime silicate glass
[4] Neugebauer J.; Movable Canopy, conference proceedings, Conference proceedings; Glass Performance Days, Tampere, Finland, 2015
[5] Neugebauer J.; Investigation of different test set scenarios for determination of ultimate bending stress of thin glass; Conference proceedings; Engineered Transparency; Düsseldorf; 2016
[6] Illguth M., Schulera C., Bucak Ö.;The effect of optical anisotropies on building glass façades and its measurement methods; Frontiers of Architectural Research 4; 119–126; Elsevier; 2015
[7] Schula S.; Charakterisierung der Kratzanfälligkeit von Gläsern im Bauwesen; Doctoral Thesis; Darmstadt; 2014
[8] Gross D., Seelig T.; Bruchmechanik; SpringerVerlag Berlin Heidelberg;2011