Authors: Marcin Kozłowski, Zbigniew Respondek, Maciej Wiśniowski, Dawid Cornik and Kinga Zemła
Source: Appl. Sci. 2023, 13(3), 1269; MDPI
DOI: https://doi.org/10.3390/app13031269
(This article belongs to the Section Civil Engineering)
Abstract
Insulating glass units (IGUs) are building components that show a particular structural behavior. Although such structures have many advantages from the point of view of thermal protection of buildings, they show particular structural behavior under climatic loads. The inability to equalize the pressure with the surrounding atmospheric air causes over- or under-pressure inside the gap. The phenomenon may result in the deformation of the panes under the influence of temporary or cyclical changes in weather conditions. This article presents the results of an experimental campaign with a representative IGU sample. The sample had dimensions of 500 mm × 500 mm and was composed of two 6 mm glass panes and a 16 mm wide spacer. The experiments were carried out using a rarely used methodology by inducing a controlled pressure change in the gap.
Subsequently, analytical and numerical models were developed, and the results were compared with the experimental findings. The study found that the rapid injection/withdrawal of gas into/from the gap causes a sudden change in the pressure inside the gap, which decreases in absolute value and stabilizes after a few seconds. The decrease, on average, of 7% is due to adiabatic effects resulting from the high rate of gas exchange. The results from the numerical and analytical studies underestimate the pressure difference values obtained in the tests by an average of 8%. In terms of deflections and stresses, the results overestimate the experiments by 16% and 32%, respectively. This finding indicates the presence of a partial rotational restrain of the panes’ edges, which some researchers have also reported. This effect is usually ignored in engineering practice.
1. Introduction
Insulating glass units (IGUs) are building components that show particular structural behavior. A typical IGU comprises two or more glass panes with a sealed gap filled with a low thermal conductivity gas (e.g., argon). Although such structures have many advantages from the point of view of the thermal protection of buildings, they show a particular structural behavior [1,2]. The inability to equalize the pressure with the surrounding atmospheric air causes over- or under-pressure inside the gap [3,4]. The phenomenon may result in the deformation of the panes under the influence of temporary or cyclical changes in weather conditions. In particular, an increase in atmospheric pressure or a decrease in gas temperature in the gap results in a concave or “bulging” form of deformation [5,6]. The volume change resulting from the panes’ deflection generates a pressure change in the gaps, whereby the external climatic load is partly reduced [3,4,7]. Thus, each IGU component pane is affected by the accompanying load resulting from the state of temporary equilibrium between the external climatic conditions and the gas pressure in the gap [8,9].
Determining the operational load of the component panes was the primary goal of the analytical and numerical models described in the literature.
In 1974, Solvason [10] proposed a method to determine the state of equilibrium in the IGU-environment system using the ideal gas equation and then to estimate the deflection and stress in the panes assuming a simply supported linear Kirchhoff plate. Milestones for analytical solutions were Feldmeier’s works, e.g., [3,4], in which he defined the factors describing the reduction of the climatic load and gave the method of estimating the characteristic length of the IGU. The characteristic length is the IGU dimension at which the stress from climatic loads is largest. Curcija and Vidanovic [11] proposed a model for calculating deflection in multi-glazed IGUs based on numerical solutions of systems of equations. A numerically validated model for calculating static values in rectangular and circular IGUs was proposed by Respondek et al. [8,9]. Stratiy [6] presented an analytical and numerical model for estimating the deflection in a double-glazed IGU, also in the range of large deflections. Galuppi and Royer-Carfagni also proposed analytical load sharing models: in double-glass units, also triangular, based on Betti’s method [1,12], and in multiple units based on Green’s functions [2]. Bedon and Amalio analyzed the strength aspects of IGUs in the context of the duration of the load [13]. The same authors also investigated the effects of buckling on the behavior of double-glazed units [14].
In engineering terms, estimating the response of an IGU due to climatic loads is the subject of standard recommendations. The method of estimating climatic loads according to the European standard EN 16612:2020 [7] is primarily compatible with Feldmeier’s methodology [3,4]. In addition, it includes guidelines on taking into account second-order effects (i.e., large deflections) and a simplified method of estimating equivalent thickness for laminated glass. According to the American standard ASTM E1300-16 [15], IGUs are designed assuming simply supported continuous conditions along four sides. To determine the proportion of the specified design load carried by each pane in the IGU, a method that maintains the ideal gas law equilibrium for the gap between IGU assembly and loaded conditions should be used.
This problem was also analyzed numerically using the Finite Element Method (FEM). Velchev and Ivanov [16] used plate theory and pseudo-elastic fluid elements to describe the complex interaction between the glass plates and the gas entrapped in the gap. Bedon and Amadio [17,18] developed complex full 3D numerical models of an IGU, focusing on the actual mechanical properties and load-bearing mechanism for the involved components. Special attention was paid to the critical role of both primary and secondary sealant. Sielicki et al. [19] numerically investigated triple glass units to assess their performance under explosive loading. Circular and elliptical IGUs were investigated numerically in [9]. In the article [20], the influence of large deflections on the load distribution and the possible reduction of the thickness of glass used in IGUs on cruise ships was investigated numerically. In engineering practice, software for the structural design of IGUs has been developed [21,22]. However, their functionality is limited, particularly regarding the number of gaps and geometrical features.
The increased interest in the issues mentioned above occurred after the popularization of the use of triple-glazed units. Currently, due to the need to save energy, the use of even 6-pane IGUs [23] is being considered. In article [24], based on detailed calculations, it was shown that increasing the total thickness of the gas gaps increases, approximately linearly, the maximum stress and deflection in the IGU loaded with a change in atmospheric pressure. Increased stress should also be expected in the case of curved IGUs, which is related to the low susceptibility of such glass to deflection. This issue is important because in certain conditions, in particular together with mechanical loads, it may lead to glass cracking [25,26]. Therefore, there is a demand for introducing pressure-equalizing mechanisms to the IGU structure [27,28,29]. However, this solution is limited due to technical issues and limitations introduced by product standards [30].
Experimental studies are necessary to validate analytical and numerical models. Hart et al. [31] investigated the deflection in IGUs under operating conditions in various locations in the USA using laser devices. Penkova et al. [32] measured a window model’s heat flow and deflection in a climatic chamber. McMahon et al. [33] investigated the load sharing in IGUs triple glazing by controlled pressure change on both sides of the sample. Buddenberg et al. [5] measured pressure changes in gaps by subjecting IGU samples to cyclic temperature changes in a climatic chamber. His main conclusion related to the changes in the connection stiffness of the glass pane with the spacer that depends on the temperature and the number of load cycles. Buddenberg’s work used a numerical model based on FEM for the analysis. Bedon and Amadio carried out laboratory tests and numerical modeling of the edge connection efficiency investigating different types of spacers for IGUs [17,18]. The studies on curved IGUs using the cold-bending technique are reported in [34].
In the article [6], Striatiy used artificially induced over-pressure in the gap to simulate the climatic load, and measured the deflection in the IGU mounted in a window frame. The article [35] describes a similar concept in more detail. It has been proposed that natural changes in atmospheric pressure or temperature can be simulated with an equivalent load resulting from a defined change in gas pressure in the gap. This way, the pressure difference in the gap can be achieved by introducing or removing a certain gas mass into/from the gap. The research methodology used in the current study is based on these ideas, but the structure of the test stand is improved compared to [35]. Instead of a massive metal frame, the tested model was placed between OSB boards, which simplified the test even more. Moreover, during the tests, the response of the glass panes, in terms of the stress in the glass, deflection, and pressure inside the gap, was continuously monitored.
This article aims to experimentally determine the resulting pressure difference in the IGU gap, the deflection of the panes, and stress in the glass in an IGU model subjected to loading. The study simulates climatic loads that involve controlled injection/extraction of a certain volume of air into/from the gap. In this way, this method eliminates the need to use a climatic chamber.
The article compares the results of experimental research with the analytical and numerical models. The analyses allowed for the validation of these models, investigations of the mechanical behavior of the IGU in real conditions, and the definition of directions of further research. The introduction explains the paper’s main topic, and an extensive literature review is provided. Section 2 provides details of performed experiments and presents the assumptions of analytical and numerical models. In the Results and Discussion section, the main observations are presented and discussed. The main findings are highlighted in the Conclusions section.
2. Materials and Methods
As already mentioned, the essence of the research was to generate over- or under-pressure in the IGU gap to simulate climatic loads. The scope of the work included experimental research, developing analytical and numerical models, and comparing the obtained results.
2.1. Experiments
Taking into account the sensitivity of deformation and the pressure difference in the gap to the linear dimensions of IGUs described in [8,9], it was found that the use of too large a sample was not justified. This was because as the linear dimensions increase there is a significant gas interaction, which requires a large amount of injected gas to cause a significant deflection of the panes and induce stress in the glass. Preliminary analyses have shown that using models with widths of 400 ÷ 600 mm is advisable in this context [8,9]. The calculations by Feldmeier [3] showed that the critical length for a square IGU 6-16-6 is 500 mm.
Considering the above findings, a double-glazed IGU with a size of 500 mm × 500 mm was used. It was composed of two toughened glass panes with a nominal thickness of 6 mm and a 16 mm wide gap. A standard aluminum spacer and a structural silicone outer seal were used. The panes were made of regular soda-lime silica glass.
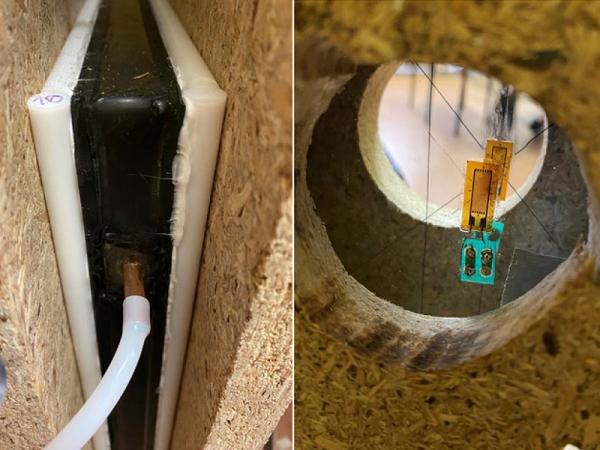
Before conducting experiments, the model was prepared by drilling two holes in the spacer, inserting short copper pipes into the holes, and sealing the connections (Figure 1a). In this way, an unsealed IGU filled with air was obtained. Flexible (silicone) conduits with an internal diameter of 4 mm were mounted on the ends of the pipes, to which the following devices were attached: a precise syringe (with a specific volume) and a pressure sensor. To measure the pressure difference, the TESTO 400 device [36] with the ability to record in time the absolute pressure in the gap and the pressure difference between the gap and the surroundings with a frequency of 1 Hz was used.
On the perimeter of the glass panes, solid rods with a diameter of 10 mm were glued on both sides of the IGU. Near the center of the model, strain gauges with a base of 10 mm were attached to both component glass panes and wires were guided through holes made in the boards (Figure 1b).
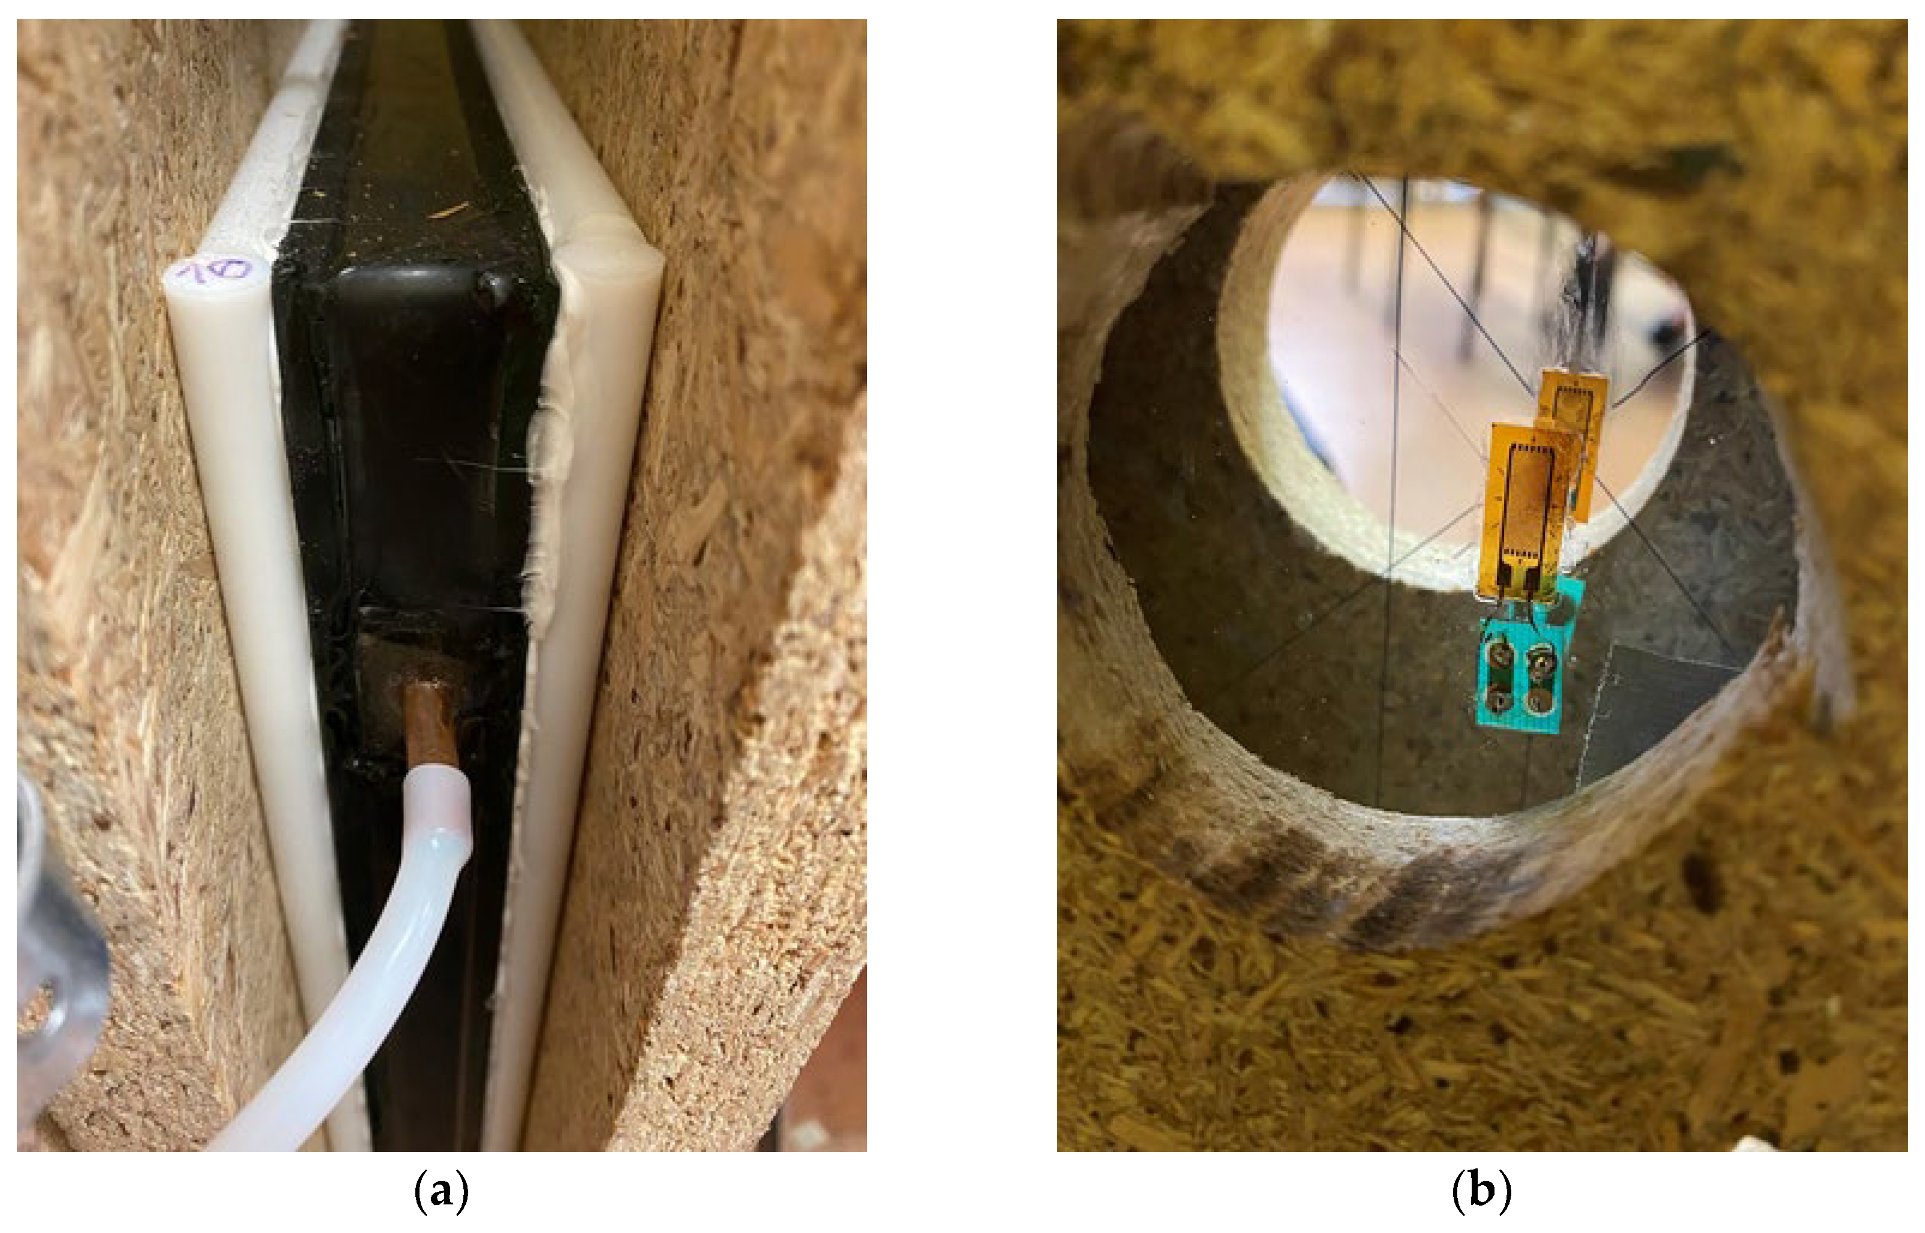
The scheme of the test stand is shown in Figure 2. The IGU model was placed between two 22 mm OSB boards and stabilized by screwing them with four bolts outside the sample outline. The deflection was measured on both sides of the IGU in the middle of the model through holes in the boards. Linear Variable Differential Transformer (LVDT) sensors were placed on magnetic bases attached to boards with metal connectors, preventing the uncontrolled displacement of the IGU model in relation to the measurement system. During the test, the deflection and stress in the center of the component panes were measured using the TMX-0208SE device with a measurement frequency of 10 Hz [37]. The IGU model was placed in a vertical position to avoid pane deflection due to its self-weight.
A single test series consisted of injecting or withdrawing a defined air volume into/from the IGU gap. During the test, the following quantities were measured: over- or under-pressure in the gap, out-of-plane deflection of the panes, and stress in the glass in the center of the model. After the gas was injected/withdrawn into/from the gap, the measurements were carried out for 5 min. The test campaign consisted of eight test series, including injecting and withdrawing the air from the gap ranging from 50 mL to 200 mL with a 50 mL interval. Five repetitions were performed for each test series.
2.2. Analytical Model
The analytical model describing the performed experiments was based on the analytical model for determining the static quantities in an IGU, as described in [8,9], hereinafter referred to as the base model. This model assumes that the gas in the gap satisfies the ideal gas law:
![]()
where:
p₀, T₀, v₀—initial parameters of the gas in the gap: pressure [kPa], temperature [K], volume [m³]; it is assumed that, under these conditions, the component panes are not deformed,
pop, Top, vop—operating parameters of gas in the gap—analogously; they change to the rhythm of the temporary weather conditions,
n—number of moles of gas confined in the gap [-],
R—universal gas constant, i.e., 0.00831446 kJ·m/(mol·K).
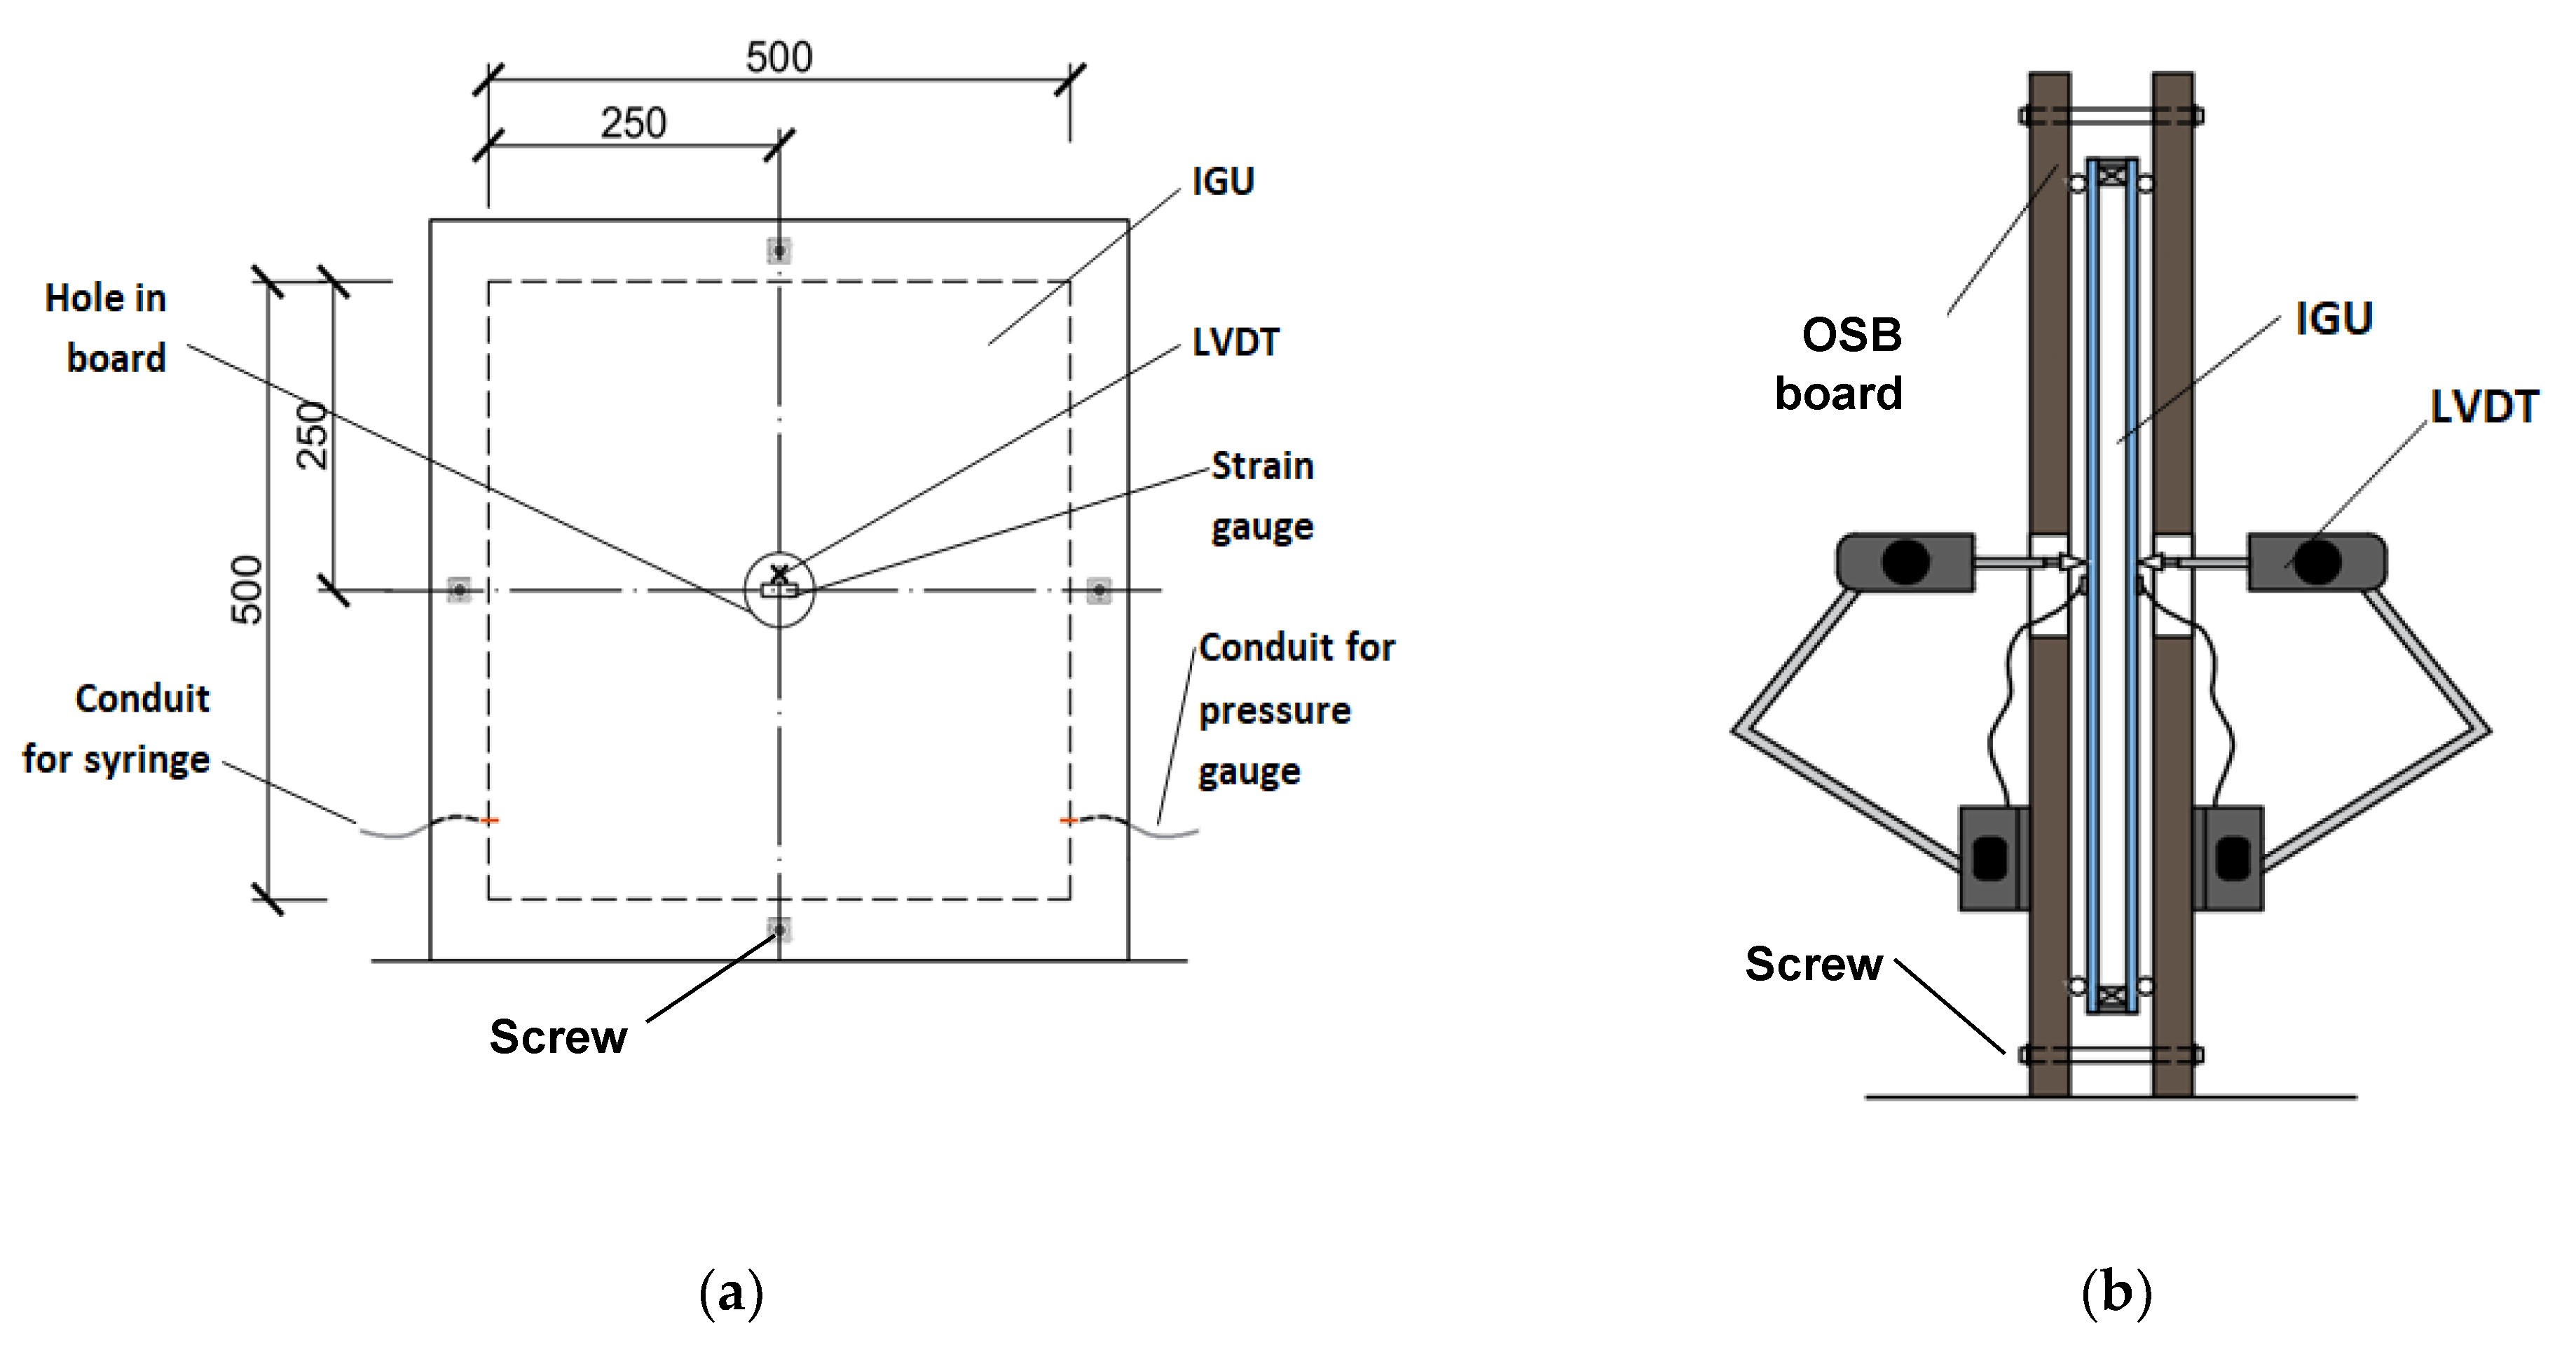
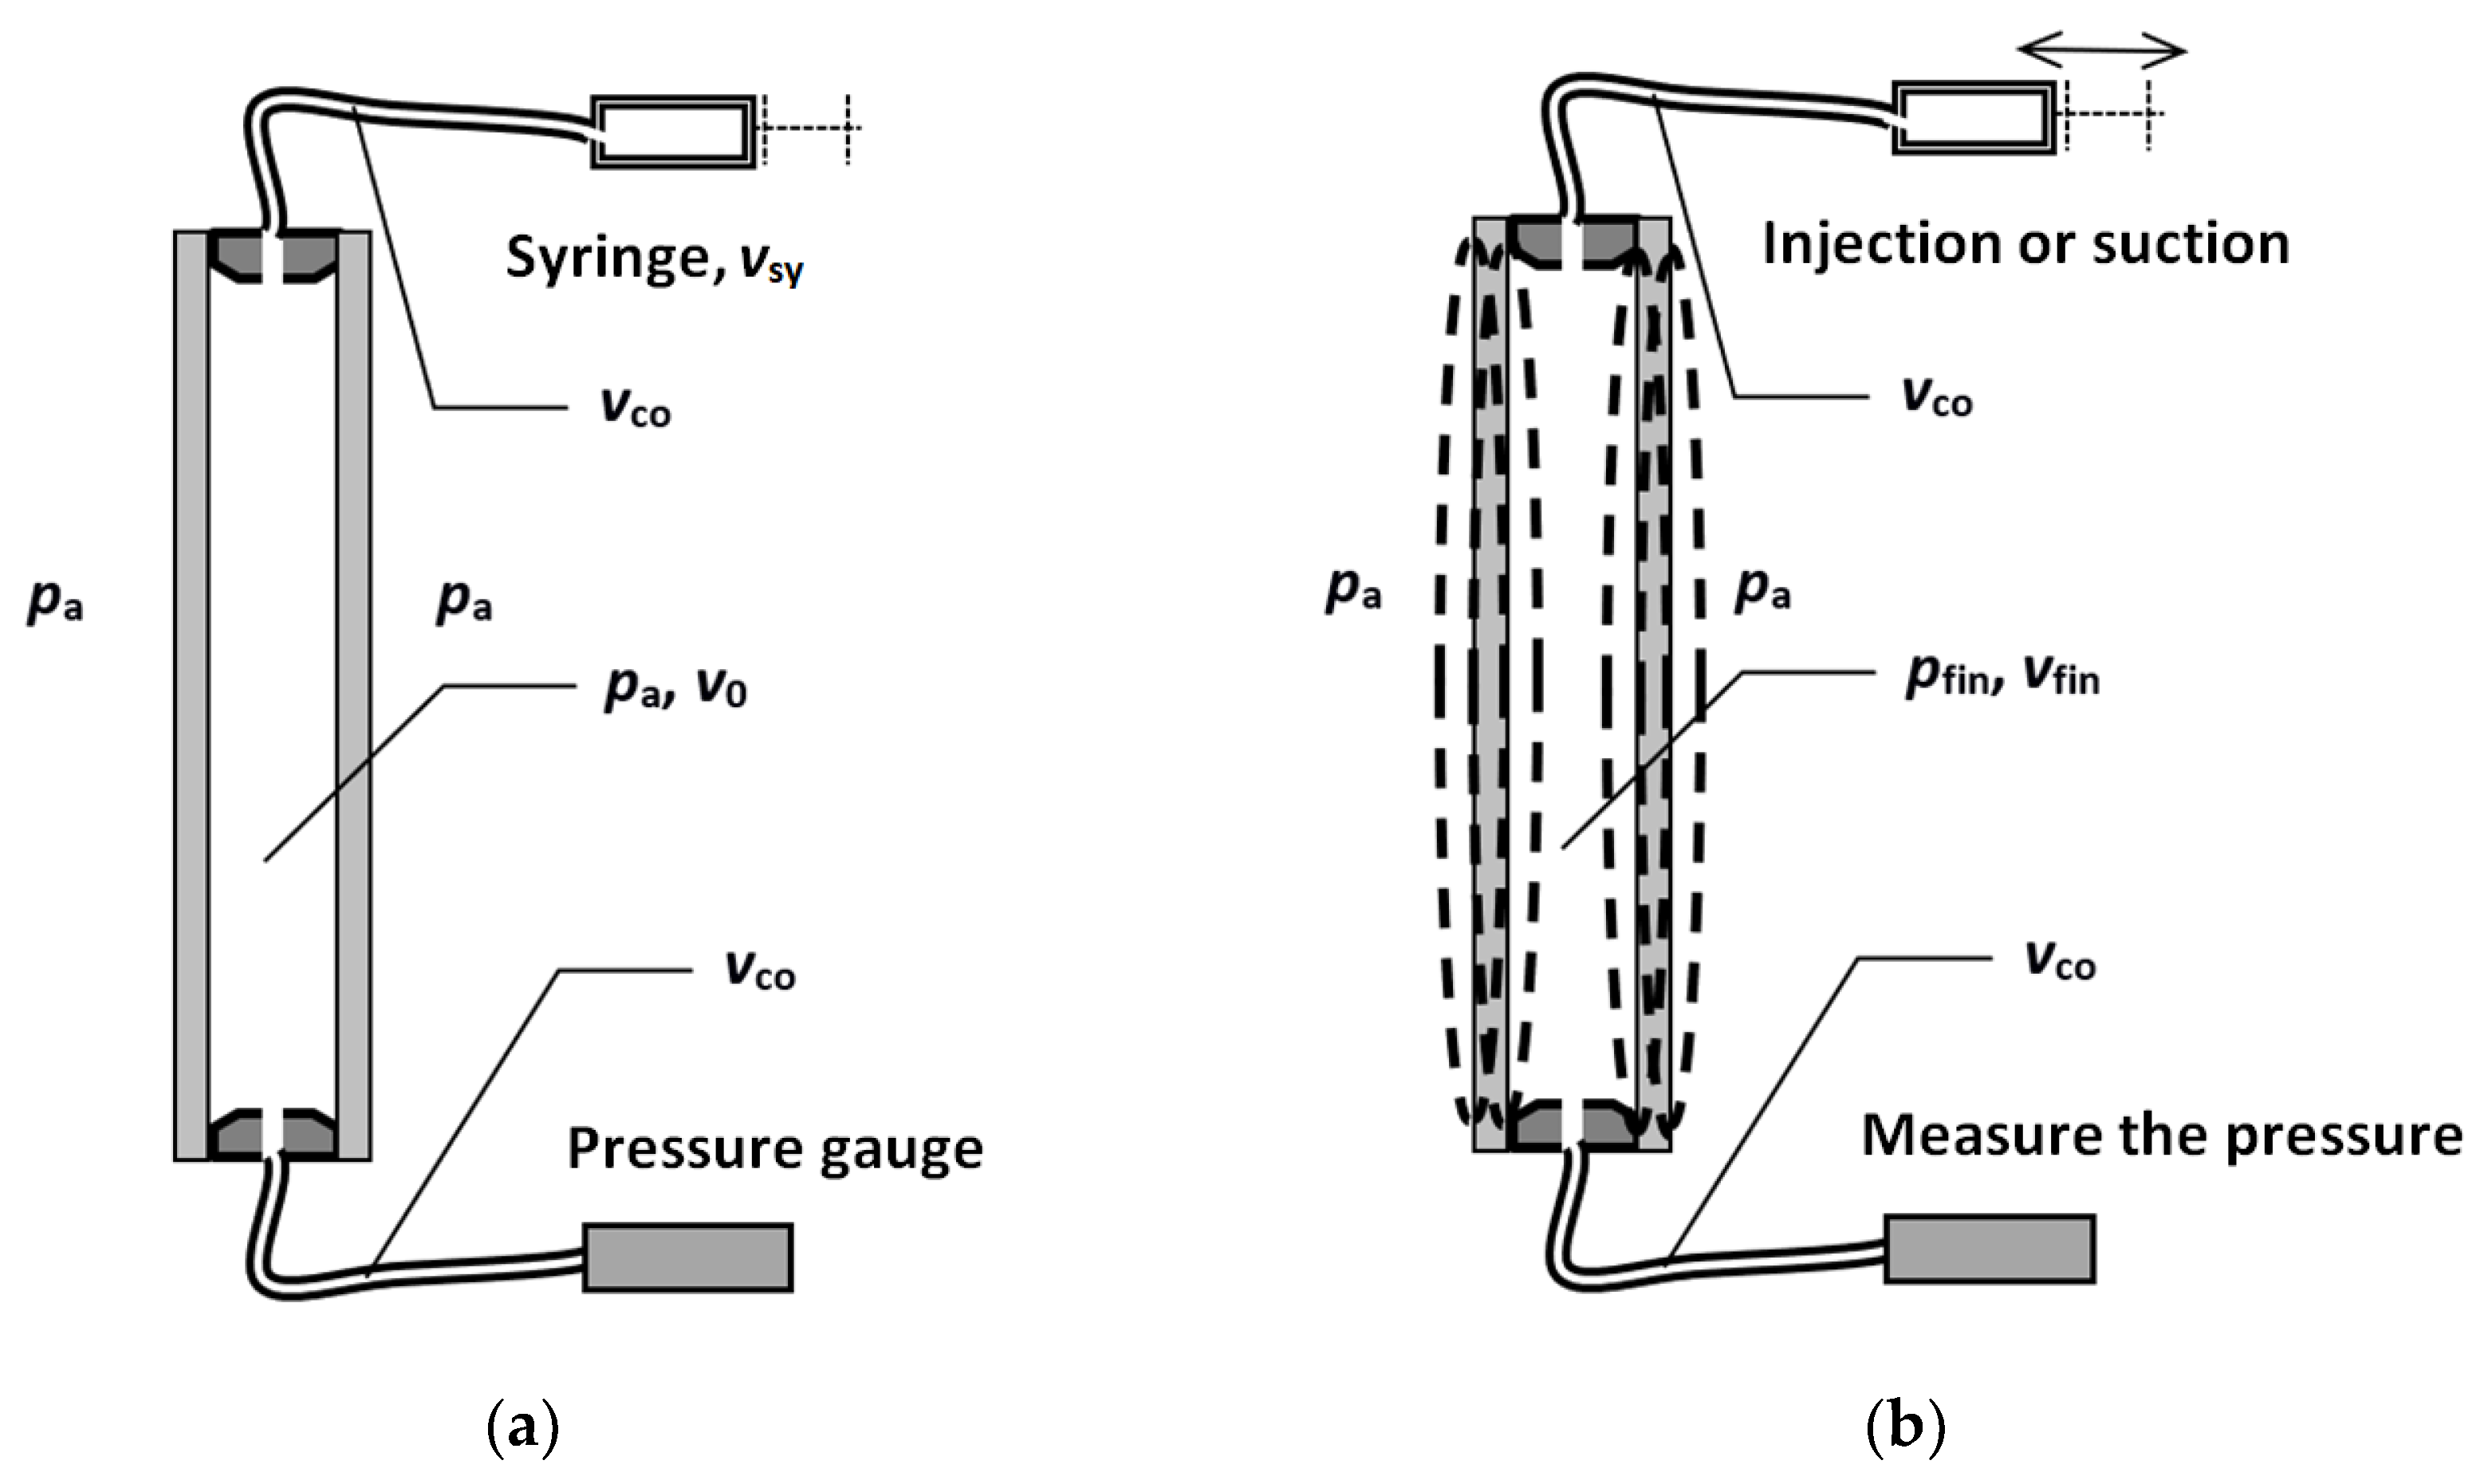
In the case of the test, as shown in Figure 3, the initial pressure is equal to the atmospheric pressure during the test pₐ [kPa] and the temperature during the test Tₐ [K] is assumed to be constant; therefore:
![]()
where:
pfin—final pressure in the gap [kPa],
vst, vfin—initial and final volumes of the gap-conduits-syringe system [m³].
As the base model assumes a linear dependence of the deflection w [m] of a component glass pane under the resultant load q [kN/m²], the change in the gap volume Δv [m³] (resulting from the deflection of one of the panes limiting it) can be determined from the formula:
![]()
where αᵥ—proportionality factor calculated from the base model [m⁵/kN].
For the injection test, the equation of state (2) can be written as:
![]()
where:
vₛₜ*—the sum of the initial volume of the gap v₀ and volume of the connecting conduits vco [m³],
vsy—volume of syringe [m³],
vin—volume of air injected into the gap [m³]; if vsy = vin, Equations (4) and (5) can be simplified, αᵥ₁, αᵥ₂—proportionality factors of component panes [m⁵/kN]; furthermore, the symbol Σαᵥ = αᵥ₁ + αᵥ₂ is used.
The final pressure can be determined from Equation (4):

For the suction test, Equations (4) and (5) take the form:
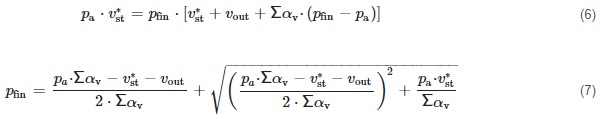
where vₒᵤₜ—volume of air sucked out of the gap [m³].
From the resulting pfin values, the resultant load q can be calculated, and subsequently the deflection and stress of the component panes can be derived using the base model. For this test, the resultant load is the symmetrically acting pressure difference p [kPa] between the gap and the environment.
The IGU dimensions should be understood as the distance between the supports (measured “in situ”); in this test, it is 488 mm × 488 mm. The following glass parameters are assumed: Young’s modulus E = 70 GPa, Poisson’s ratio μ = 0.23, and glass thickness d = 6 mm. For the above data and assuming the simple connection of the component panes with the spacer, the dimensionless factors are: αᵥ₁ = αᵥ₂ = 1.75189 × 10⁻⁵ m⁵/kN. The gap volume and conduit volume are also determined based on “in situ” measurements (the width of the edge, i.e., the spacer and the seal, are taken into account); in this case, vₛₜ* = 3.68993 × 10⁻³ m³. Based on the base model, considering the actual conditions during the measurement of pₐ and Tₐ, the values Δpₛᵢₘ and ΔTₛᵢₘ were calculated, which define the value of the pressure or temperature change simulated by a specific series.
Table 1 shows the equivalent values of change in the atmospheric pressure and gas temperature inside the gap, which correspond to the amount of air injected or withdrawn into/from the gap during the experiments. These values were obtained based on the analytical model presented in [8,9]. In order to understand the meaning of these values, it should be noted that in real IGUs the baseline is the initial conditions in the gap, which are not always known. For example, if one takes the reference levels T₀ = 20 °C and ΔTₛᵢₘ = 15.908 °C, the temperature in the gap increased to almost 36 °C (test series 4). This effect may result from sun exposure, see [38]. The fluctuations in the atmospheric pressure of ±5 kPa may also result from natural weather variations or the difference in altitude above sea level between the place of production and the place of operation of the IGU [3,7]. Thus, the values presented in Table 1 provide possible loads under certain weather conditions that correspond to the amount of air injected or withdrawn into/from the gap during the experiments.
Table 1. Overview of experiments.
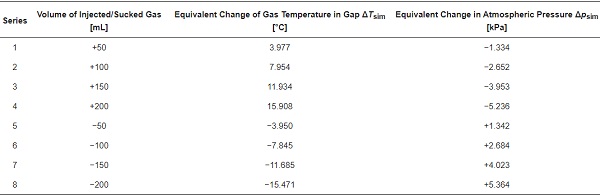
It should be noted that the base model [8,9] is compatible with similar models described in the literature in terms of determining the resultant load from climatic influences. The additional analysis carried out showed that, in terms of data from Table 1, the results do not differ by more than 2.39% from the results according to [1] and [3].
2.3. Numerical Simulations
To simulate the behavior of the IGU tested in the experimental campaign, an FE reference model was developed in the ABAQUS CEA software [39]. It consists of two parallel planar shells representing glass panes, and one extruded rectangular shell referring to an aluminum spacer and secondary sealing (Figure 4). The components are connected by hinged tie constraint elements and create a closed volume representing the air gap. The glass plates are rectangular 500 mm × 500 mm with a thickness of 6 mm. For the spacer, a 10 mm shell was applied. For all shells, five integration points across the cross-section of the shell were applied. The axial gap between the glass plates equals 16 mm, resulting in the same gas volume entrapped between the panes. Figure 4b displays the mechanical boundary conditions. The model was supported at the bottom edge to simulate the simply supported setup. The panes were supported laterally along the edges to represent the real boundary conditions in the experiments.
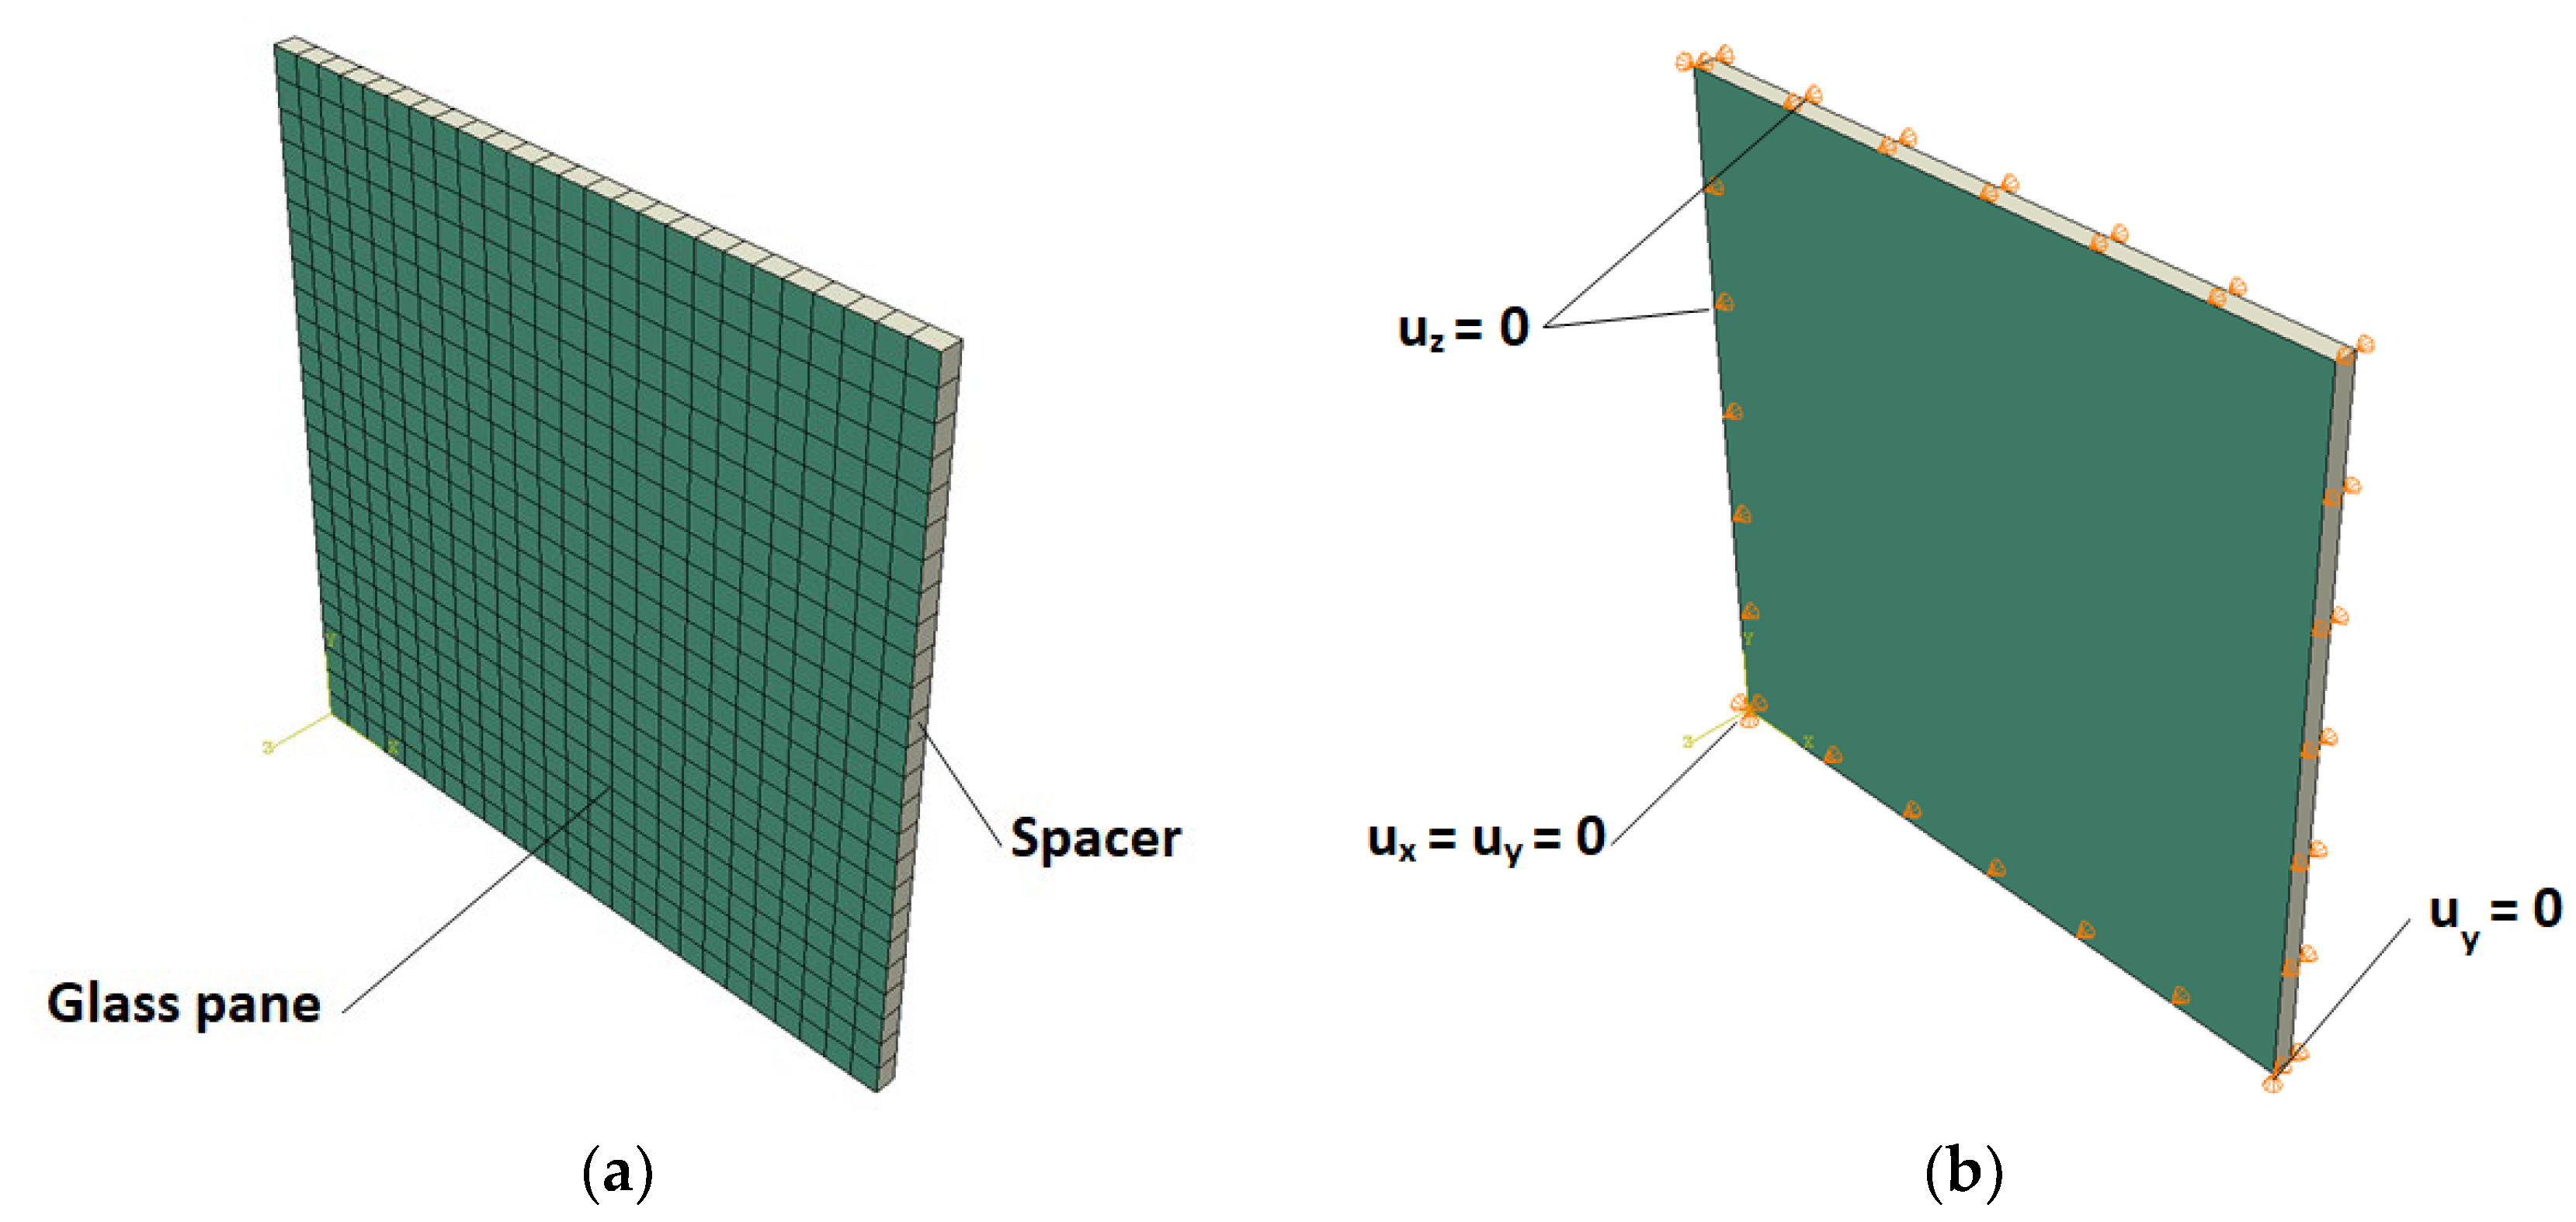
The analyses used 20 mm square finite elements (4-node elements, known as S4R from ABAQUS library [39]), which divided the glass plate into 25 elements in each direction. The authors provided the mesh convergence tests in the previous study [9].
The air inside the IGU is represented by the ‘fluid cavity’ interaction component from the ABAQUS library [39]. The initial temperature of the panes and the air entrapped in the gap was assumed to be 20 °C, and ambient pressure before loading was set to 100 kPa. In the analyses, the following constants were used: the universal gas constant Ru = 8.314 J/(K∙mol) [40] and the molecular weight of dry air: Mair = 28.97 × 10⁻³ kg/mol [41]. The initial volume of the cavity is constant and equal to 4 × 10⁻³ m³, which corresponds to a cubic volume of 500 mm × 500 mm × 16 mm.
To simulate the behavior of the air entrapped inside the IGU, a fluid cavity component was applied inside the closed space of the model [18,39]. The Gas Flux internal property feature was used to simulate the additional gas exchange volume in the experiments. The analyses used the Explicit solver, a dynamic method with a constant load increment.
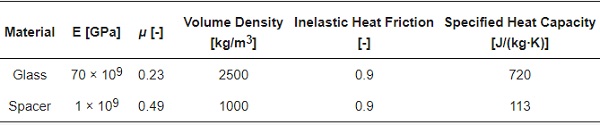
The mechanical properties of the materials assumed for the analyses are shown in Table 2. The properties of glass are based on [42]. Because the main aim of the spacer was to create the closed volume between the panes, a relatively high Young’s modulus was arbitrarily used.
Table 2. Material properties used in FE analyses.
3. Results and Discussion
This section presents the results of the numerical and analytical studies and compares them with the results of experiments.
Figure 5 and Figure 6 show typical out-of-plane deformations of the analyzed IGU in the case of series 2 and 6 (Table 1), respectively. For clarity, a “view cut” was used in the figures with a vertical plane passing through the model’s center, so the figures show only half of the models. It can be seen that the deformations are symmetrical due to the dimensions of the model. Both glass panes of the IGU deform as a plate simply supported on four edges. The deformation of the spacer between the glass panels is negligible for the change of the gas volume inside. Figure 5 and Figure 6 show only deformation in Z (U3) direction Z (U3) to better show the concept of deformation.
![Figure 5. Deformations UZ [m] of the model in the case of injection of 100 mL of air (test series 2) to the gap.](/sites/default/files/inline-images/Fig5_259.jpg)
![Figure 6. Deformations UZ [m] of the model in the case of withdrawal of 100 mL of air (test series 6) from the gap.](/sites/default/files/inline-images/Fig6_233.jpg)
The maximum value of displacement reaches approx. 0.240 mm, which is 0.83% different from the analytical model. For the presented case, the difference between deflection obtained in the numerical calculation and experiment is 0.02 mm, which equals 17%. The difference in results was also observed in measured and estimated pressure values in the gap. Considering the law of mass conservation, the quantity of mass of fluid inside the gap is only a constant parameter of the gas. The initial and additional air mass was obtained using Equation (1), assuming the atmospheric pressure of 100 kPa. In the numerical model, the parameter “MCAV”, which refers to the mass of the fluid in the gap, was controlled for the first and last load steps.
Figure 7 shows a qualitative comparison of the experimental and numerical results in terms of the pressure difference (difference in gap pressure and atmospheric pressure), deflection, and stress in the glass in the middle of the sample. Although the measurements were carried out for 5 min, the results are presented only up to 3 s of the test for clarity. The difference in the stabilized measured values for 3 s and 300 s was not more than 2%. Since the pane always deformed in opposite directions, the results for each series were averaged from two measurement points (LVDTs and strain gauges) located on opposite sides of the gap. Additionally, the figures show the average values of five repetitions for each test series.
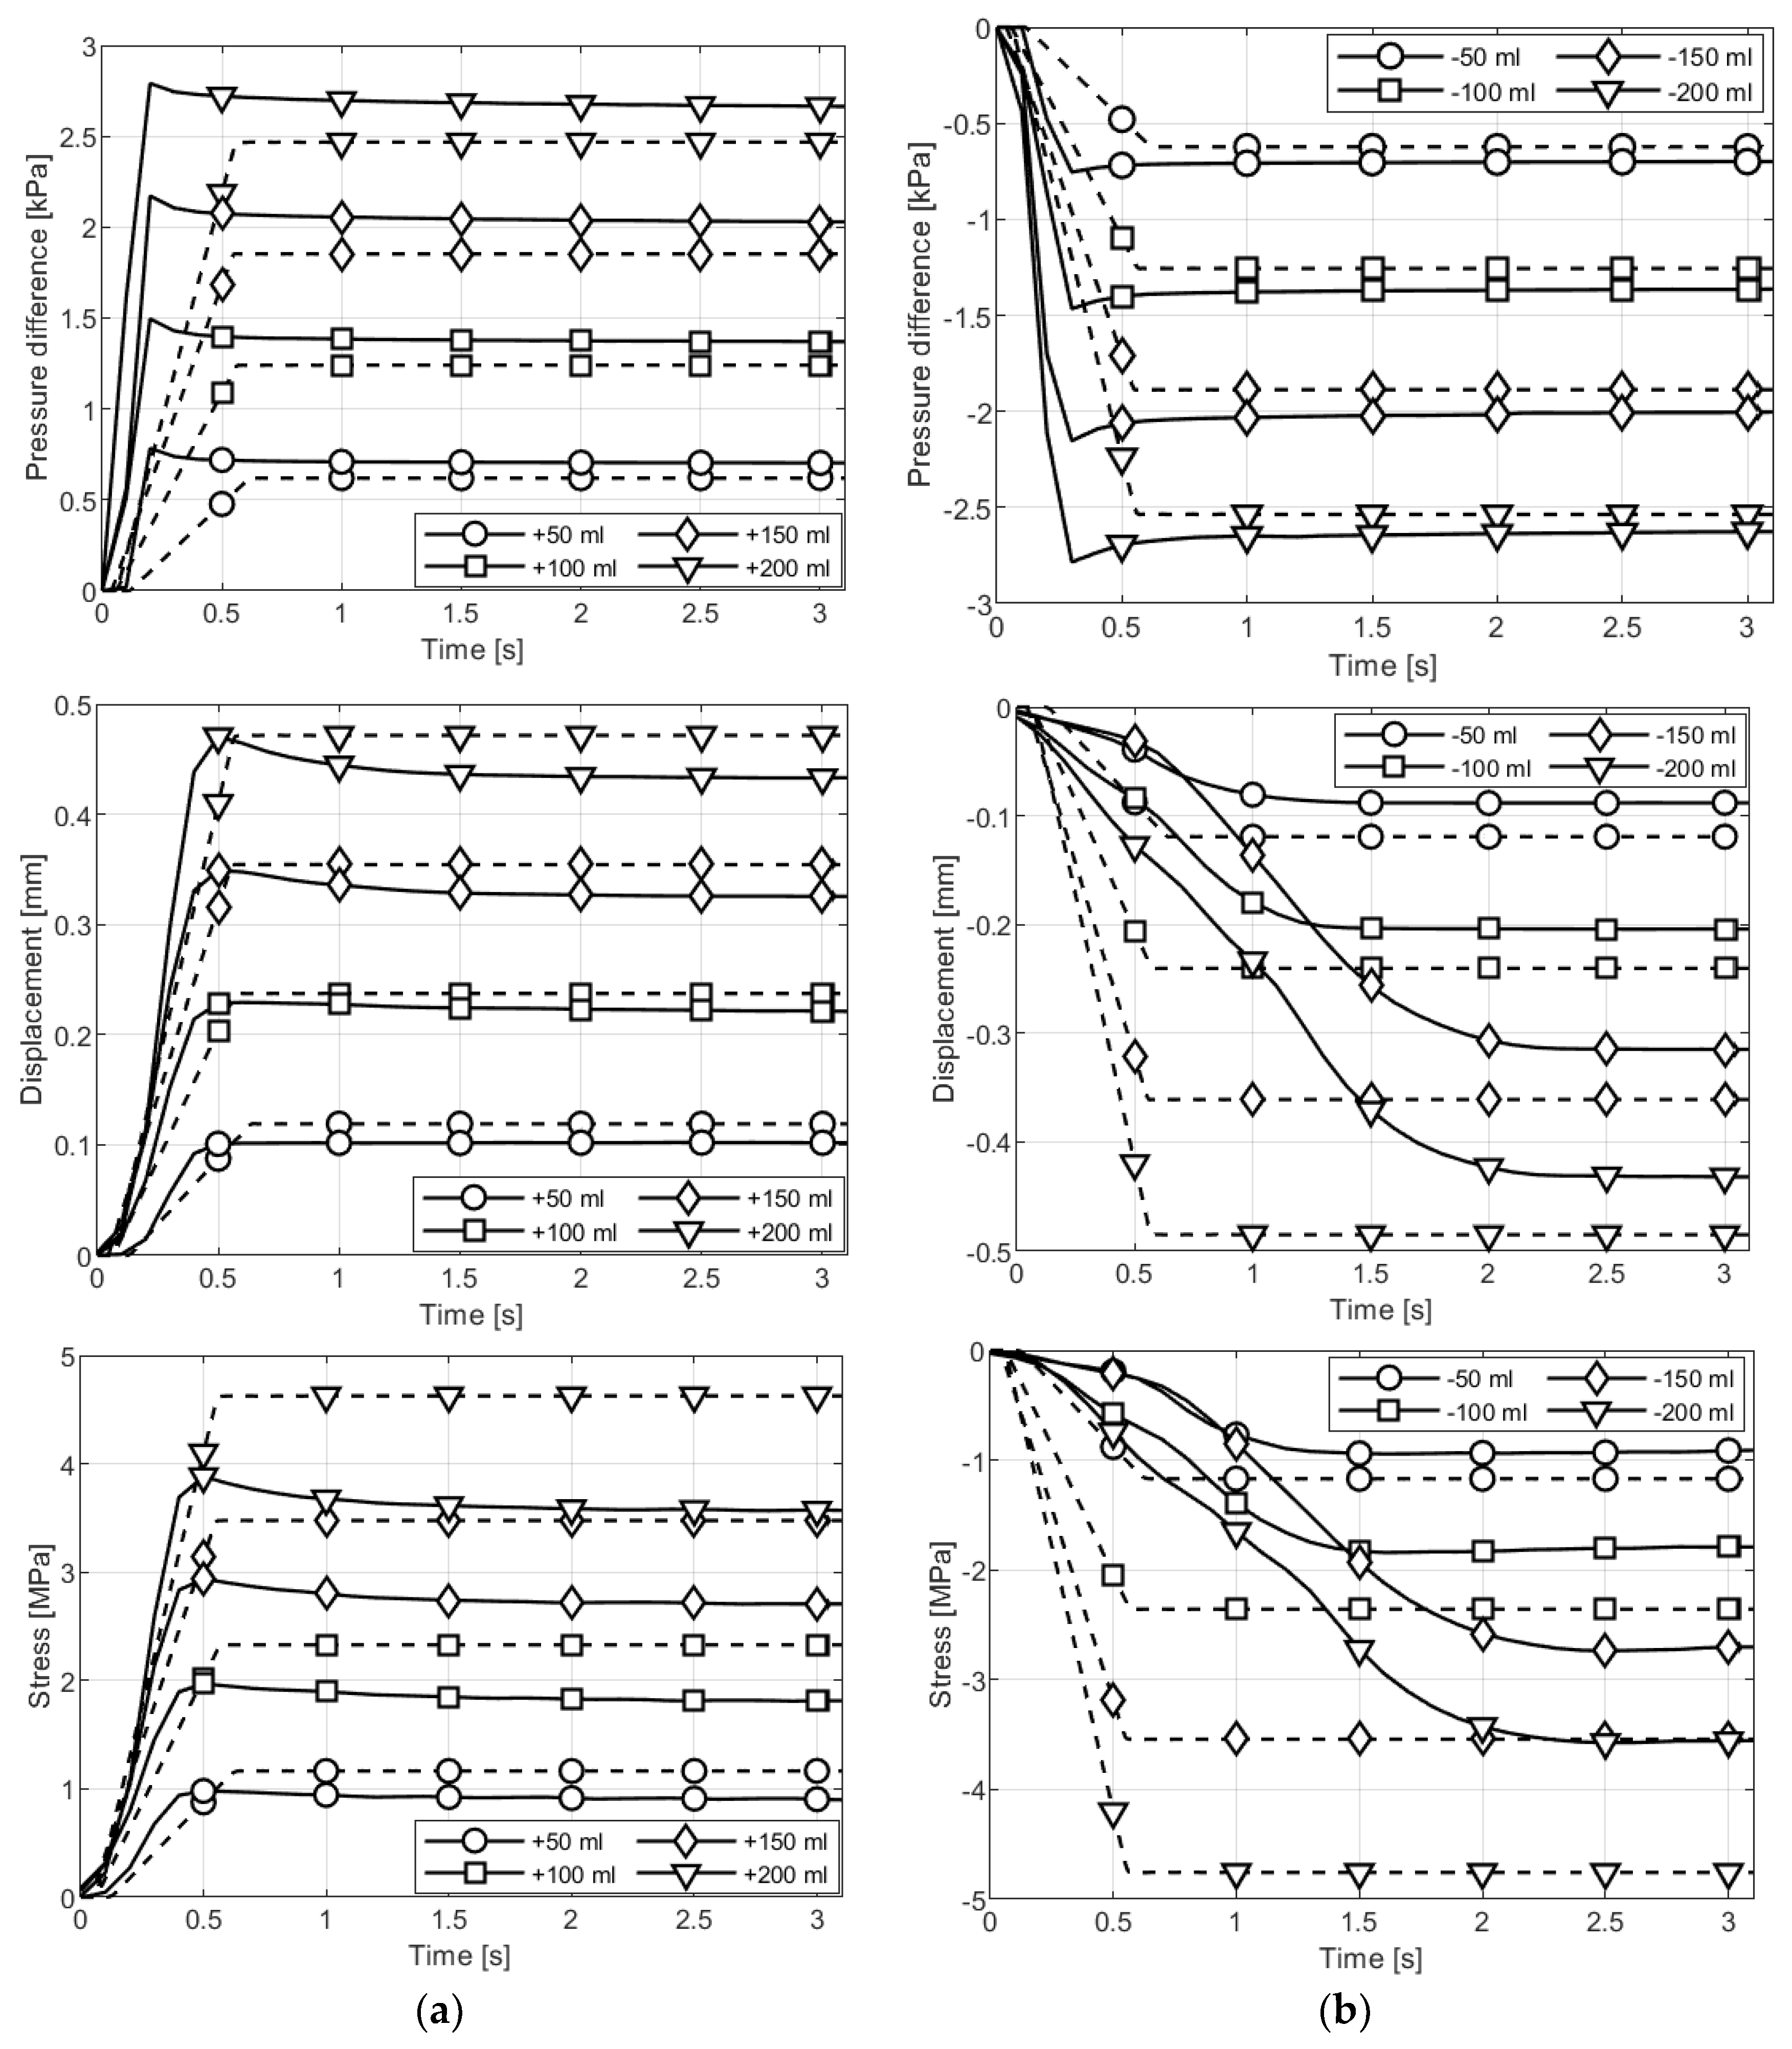
As mentioned, a slight decrease in all measured values was observed after reaching the maximum value. This is due to the adiabatic transformation [43] of gas in the gap. A sudden injecting or withdrawal of gas into/from the gap causes an increase or decrease in the pressure difference, respectively, and thus a change in the gas temperature. After a while, heat is exchanged between the gas inside the gap and the glass panes. This causes the temperature to equilibrate, the pressure in the gap to stabilize, and consequently the measured values to decrease slightly. The adiabatic transformation happens very quickly. In the numerical and analytical models, this phenomenon was not considered because, in real conditions, the loads never change so quickly to such an extent.
The best compliance of the results in terms of the history and the characteristic values was obtained for the pressure difference in the gap (see Figure 7). This confirms the correctness of the assumptions while building the numerical model.
A difference can be noticed in the case of the history of displacements and stresses (Figure 7). The experimental tests showed a slower increase in these values for the case of withdrawing the gas from the gap compared to glass injection. This is because there is, in fact, a difference in the rotational rigidity of the panes’ edges depending on the direction of rotation of the panes’ edges. This phenomenon is related to the different positions (with the center of the pane) of the rigid aluminum frame and the secondary silicone sealant. In the numerical model, different rotational restraints were not considered; therefore, the values’ history for gas injection and withdrawal are the same. It should also be noted that intersections between the laboratory test results for −100 and −150 mL can be observed. This is probably related to the different gas exchange rates executed with a manual syringe or temporary temperature, or atmospheric pressure changes during testing. The intersections, however, do not affect the stabilized values that are considered reliable.
Table 3 provides a quantitative comparison of the results obtained from laboratory tests (EXP), numerical simulations (FEM), and the analytical model (AN). The table contains average, characteristic values of the pressure difference in the gap (p), displacement (w), and stress (σ) at selected points on the sample (Figure 2). In terms of the experiments, the table shows the maximum values (‘max’ index) and stabilized values (‘stab’ index). In contrast, only the stabilized values are given for the numerical and analytical results, which do not consider the adiabatic transformation of the gas. The percentage change in the absolute value of a given parameter after stabilization in relation to the immediate value is given in parentheses. As can be seen from the laboratory tests, the stabilized values of the pressure difference, displacements, and stresses are lower, in absolute terms, than the peak value by an average of 7.3%, 0.9%, and 4.6%, respectively. It should also be noted that the greater the amount of injected or withdrawn gas, the lower the percentage difference between the measured values.
Table 3. Results of experimental research, numerical and analytical calculations.
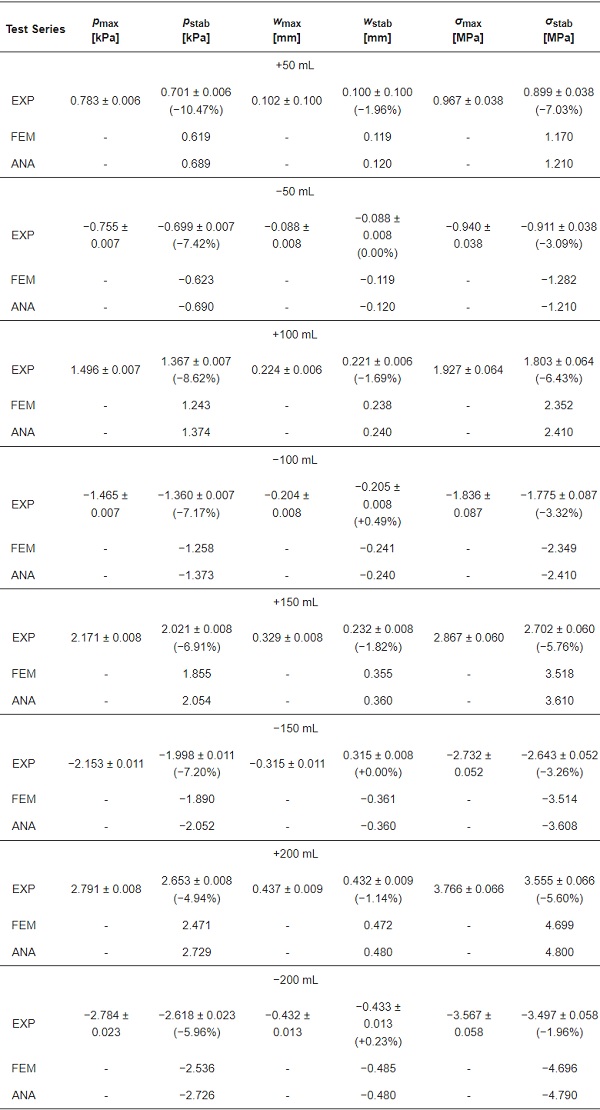
Table 4 compares the results obtained with the applied methods in percentage terms. Summarizing all the results, it can be concluded that a good agreement between the numerical and analytical results was obtained; the results do not differ by more than 12% for the pressure difference and not more than 5.6% for the deflection and stress. In terms of small deformations and the level of analyzed loads, the analytical and numerical methods give practically the same results.
Table 4. Comparison of results from experimental research, numerical and analytical calculations.
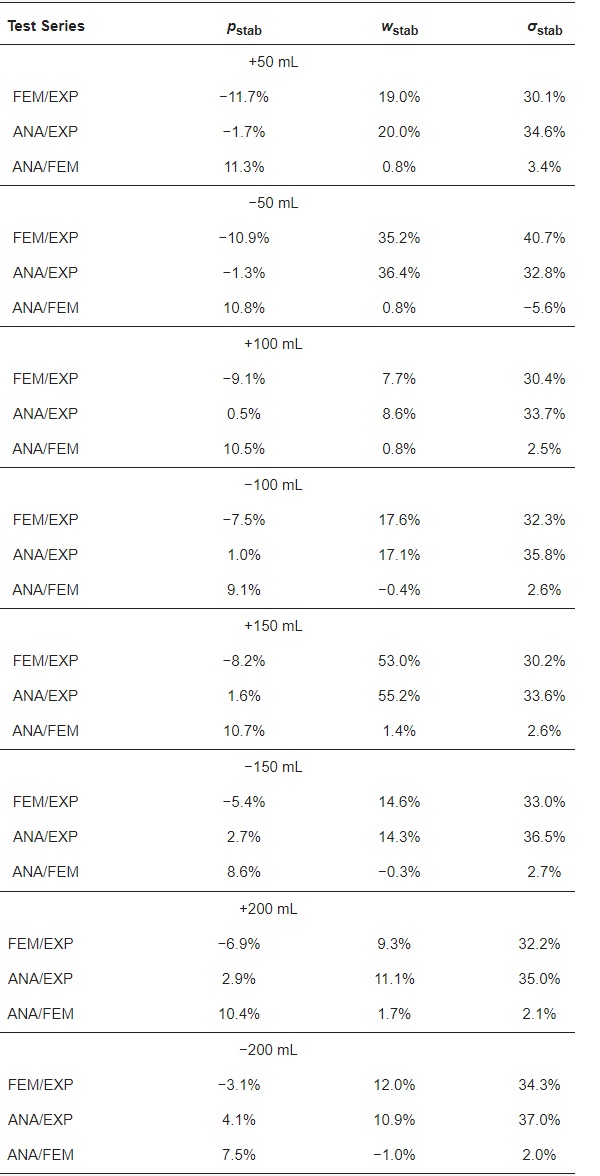
In general, the methods of approximating the analyzed values (numerical and analytical) underestimate the values obtained from the tests by an average of 8% in terms of the pressure difference. In contrast, in terms of deflections and stresses, they overestimate them by an average of 16% and 32%, respectively. This observation indicates a certain rotational rigidity of the panes’ edges, which limits their deformation and thus generates higher pressure inside the gap and lower stresses in glass. This phenomenon has also been reported in [5,6]. However, it should be emphasized that most calculation models and standard recommendations do not consider the possibility of flexible support of panes in IGUs.
4. Conclusions and Further Work
The article presents the results of experimental, numerical and analytical simulations of an IGU with dimensions of 500 mm × 500 mm built with two 6 mm toughened glass panes and a 16 mm wide spacer. The analysis aimed to experimentally determine the values of the pressure difference in the gap, deflection of the panes, and stress in the glass in the IGU model. This was carried out using a rarely used method of simulating climatic loads, allowing research to be conducted without a climatic chamber. Subsequently, analytical and numerical models of the tested IGU were developed, and the results were compared with the results of the experimental studies. The following conclusions were drawn from the conducted research:
- The results obtained from the analytical and numerical models are in good agreement; they do not differ by more than 12% (mostly much less), which proves the correctness of the assumptions for the analyses. The differences result from different ways of defining the gas input parameters in the gap;
- During the tests, it was found that the rapid injection/withdrawal of gas causes a sudden increase (in absolute value) of the pressure difference, which decreases and stabilizes almost instantly. The difference is, on average 7%. This is due to adiabatic effects resulting from the high rate of gas transformation. We plan to analyze it in more detail in future work;
- The results from the numerical and analytical models, in terms of the pressure difference, underestimate the values obtained in the tests by an average of 8%, while for deflections and stresses, they overestimate them by 16% and 32%, respectively. This indicates a rotational stiffness at the edges of the panes resulting from the properties of the connection of the glass pane with the spacer, seal and support rod. As part of the research in the near future, we plan to improve these models, considering the rotational stiffness of the panes’ edges.
- Simulating climatic loads in IGUs by the controlled change of pressure in the gap is inexpensive and can be used by other researchers or company laboratories. IGUs with different types of spacers and different methods of their installation in window frames or façade systems can be tested. It is also possible to define a specific amount of injected/extracted air to model specific climatic loading for assumed locations and operating conditions.
- The experience gained from this research will be used in planned tests with curved IGUs in the near future. This particularly applies to the use of the methodology of experimental research that proved its applicability in the case of the tested flat glass. Experimental tests with curved IGUs are expensive to carry out for a large number of samples; therefore, a validated numerical model is actually the only way to analyze their mechanical behavior under climatic loads.
Author Contributions
Conceptualization, M.K. and Z.R.; methodology M.K. and Z.R.; software, M.K., M.W. and K.Z.; validation, M.K., Z.R. and K.Z.; formal analysis, M.K., Z.R. and K.Z.; investigation, M.K., Z.R., M.W., D.C. and K.Z.; data curation, M.K., Z.R., D.C. and K.Z.; writing—original draft preparation, M.K., Z.R. and K.Z.; writing—review and editing, M.K., Z.R., M.W., D.C. and K.Z.; visualization, M.K., Z.R., M.W., D.C. and K.Z.; supervision, M.K. and Z.R.; project administration, M.K.; funding acquisition, M.K. All authors have read and agreed to the published version of the manuscript.
Funding
This research was funded by the ongoing research project “Analysis of internal pressure in 3D bent insulated glass units” (grant number 2021/05/X/ST8/00168) financed by The National Science Centre (NCN), Poland within the MINIATURA 5 program.
Institutional Review Board Statement
Not applicable.
Informed Consent Statement
Not applicable.
Data Availability Statement
Data will be available upon request.
Acknowledgments
We thank the PRESS GLASS company for providing the sample for experiments.
Conflicts of Interest
The authors declare no conflict of interest.


")