Furnaces are currently inspected on a regular basis with thermal imaging sensors and other techniques that heavily rely on experience of the plant personnel. However, despite these inspections, the industry still experiences major glass leaks and premature shut-down of furnaces. This results in inefficient asset utilization and major production disruption.
Therefore, advanced inspection of furnaces that provides deterministic erosion profile of the refractories and also detects an early stage glass penetration within the insulation layer will result in safer and longer furnace operation through preventive and proactive maintenance.
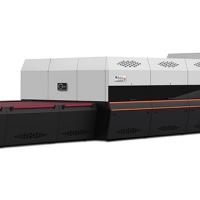
To address this major industry need, we have been developing radar based Refractory Thickness Sensor and Furnace Tomography Sensors for the last several years. The former measures residual AZS thickness on operational furnace. The latter identifies and 3-D images early stage glass penetration into insulation for preventive and proactive maintenance.
In this paper, we discuss the operational feasibility, case studies and trials for these two sensors, the refractory thickness sensor (RTS) and furnace tomography sensors (FTS). Both sensors fall under PaneraTech’s Smart Melter Solution, which combines data from these sensors, the gadgets, with other sensors into a single platform for continuous asset life management and enables preventive and proactive maintenance that are based on deterministic inspection and auditing results.
SMART MELTER SOLUTION
PaneraTech has been developing radar based Refractory Thickness Sensor (RTS) and Furnace Tomography Sensors (FTS) for the last several years. The former measures residual AZS thickness on operational furnace. The latter identifies and 3-D images early stage glass penetration into insulation for preventive and proactive maintenance.
These tools have been developed with the user and environment in mind: they survive the harsh glass factory environment and temperatures, are light weight and easy to use to enable quick inspections. These tools are integrated together into PaneraTech’s Smart Melter Solution.
This solution, represented below in Figure 1, is a combination of these gadgets, with furnace asset management software and a mapping and tracking system, enabling efficient and repeatable inspection for these gadgets.
The combination of the data acquired from inspections using these sensors and brings actionable information to the furnace operators’ fingertips. Such data from the sensors can be represented in reports and real-time furnace views.
For example, notional drawings of a furnace that has had several inspections completed with the RTS tool is shown in Figure 2. With such visualization, an operator can know very quickly the health of the AZS lining, high risk areas, and the historical progression erosion of the AZS that can be strongly dependent on furnace operations.
<
Figure 1. Smart Melter Solution components
Figure 2. Example refractory thickness risk views of a furnace as would be integrated into the Smart Melter Solution
FURNACE TOMOGRAPHIC SENSOR FOR EARLY STAGE GLASS PENETRATION DETECTION
The furnace tomographic sensor (FTS) maps and identifies early stage glass penetration into the insulation layers backing the refractory lining of glass furnaces. This sensor is based on radar imaging of the insulation layers. PaneraTech has shown the operational feasibility of several different implementations of this sensor: in-situ scanning, portable scanning, and hand-held quickscans.
All implementations of the sensor is designed to fit between structural, cooling, and other elements around the furnace. Tomographic images of the internal structure of the wall are constructed, glass penetrations are automatically identified and mapped. The sensors are designed to work with any sidewall configurations in the glass manufacturing industry.
FTS Feasibility Testing
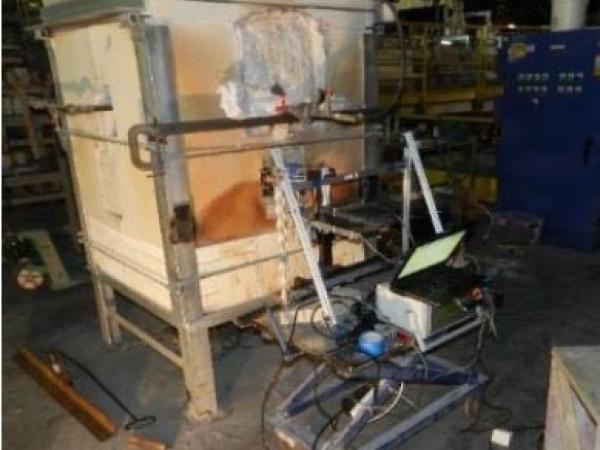
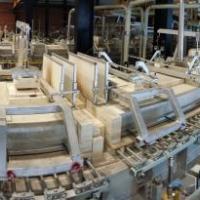
To demonstrate the fundamental feasibility of the furnace tomography sensor, we tested the system on a specially constructed developmental furnace at Libbey, Inc. in Toledo, OH. The furnace had four sidewalls consisting of AZS. On one sidewall, a bonded AZS block, super-duty firebrick block and fiber board were placed against the glass-contact fused-cast AZS.
The furnace contained molten glass at 2500 oF. The bonded AZS and super-duty block had pre-cut channels to allow glass to flow from a hole drilled in the fused-cast AZS to the outer layers. These bricks where surrounded by the same type of brick, but without channels. The test furnace at Libbey is shown in Figure 4, with the scanning FTS system used for the feasibility tests.
A drawing of the channels cut into the layers are also shown. A vertical and horizontal channel guide the molten glass into the horizontal groove cut into the super-duty brick. Mortar was used to seal these blocks to make sure the glass was contained in this small area. The installation of the bricks against the fused-cast AZS are also shown in Figure 3.
Figure 3. Photographs of the cut-outs into the super duty and bonded AZS bricks and drilling the fused-cast AZS.
We performed the radar tomographic mapping over the area with these cut-outs in addition to the surrounding area which does not contain glass penetrations. This area is shown in Figure 5. A thermal image of the outside of the wall is also shown.
There is no indication of glass penetration in this image: the outer surface of the panel is relatively uniform in temperature. After several hours, the sidewall was imaged using the FTS. During this time, the internal furnace temperature was held at 2500 °F.
Figure 4. Libbey Test Furnace and diagram of the channels created inside the insulation wall to create glass penetration.
Figure 5. Thermal image of the area with glass penetration and the furnace tomographic system imaging area on the test furnace.
Tomographic images were then created of the internal wall structure and our automatic glass detection process was used to identify glass penetration at different levels inside the insulation. This glass identification (red) is shown at the fused-cast/bonded AZS interface in Figure 6. As we see, glass is only identified in the 10” wide panel and is shown to cover this interface. The glass filling the groove in the super-duty block is also detected.
Figure 6. Glass identification at the fused cast/bonded AZS interface joint and into the groove in the super-duty firebrick.
The test furnace was shut-down and after cooling, the sidewall was opened to confirm glass penetration into the channels and interfaces. Figure 7 are photographs showing that the glass penetrated to the super-duty groove. It was found that glass had filled the interface between the bonded AZS and fused-cast AZS, as was detected by the FTS. These results prove the feasibility of the sensor technology for glass penetration detection.
Figure 7. Glass penetration into channels after furnace shutdown.
A second operational development furnace was constructed in place of the original at Libbey to further assist in the FTS probe development and is shown in Figure 8. Glass penetrations at different levels in the insulation were pre-built into the sidewalls. On one sidewall, glass penetration into the super-duty level was built into the walls.
The tomographic mapping at this area with molten glass and in internal furnace temperature of 2600 oF is shown in Figure 8, next to a photograph of the block with the cut-out before construction and drawing of the inner wall construction. It is very clear that the FTS can readily capture this structure.
Figure 8. Second Libbey development furnace and tomographic imaging of the cut-out in the second layer (super-duty firebrick) with molten glass inside.
During the tomographic mapping at this sidewall, we also discovered an area of glass penetration at the insulation board-super duty interface. No leaks were pre-built into the furnace at this level. A thermal image of this sidewall is shown in Figure 9(a). The temperature at the surface is very uniform. The glass penetration map generated by the FTS is shown in Figure 9(b).
Figure 9. (a) Thermal image of sidewall with suspected glass penetration. (b) Glass penetration map obtained FTS. (c) Glass penetration map marked on sidewall. (d) After the insulation board was removed, revealing the detected glass penetration.
After the glass was mapped using the FTS, the areas of glass penetration was marked on the surface of the insulation board, as shown in in Figure 9(c). A small and specific area was marked for removal of the insulation board which was subsequently and carefully removed.
Glass, as predicted by the FTS, was found exactly at the marked location and is shown below in in Figure 9(d). It is very important to note that this area was monitored over time to determine if it was an active glass leak into the insulation board. After monitoring the areas, this glass did not change in area or shape, showing that this was not an active leak.
With these tests at the Libbey development furnaces, we have clearly shown the feasibility of glass penetration detection at deep and shallow levels inside the insulation package. Additionally, the latest glass detection at the insulation board shown in Figure 9 was truly a blind test. This glass penetration was unexpected and yet the FTS system easily detected this glass.
FTS Blind Test at Container Glass Furnace
Following these tests, we demonstrated the FTS sensor at an operational container-glass furnace that was ten years into the furnace campaign. In this blind test, we utilized two versions of the FTS: a hand-held quick-sense FTS used for fast mapping of the whole furnace and a portable scanning FTS used for precision area-mapping of glass penetrations.
We first surveyed the furnace with our hand-held FTS, where we walked around the furnace and probed every accessible sidewall area. This entire process took about 2 hours. This tool fits around cooling structures and buckstays and probes small areas.
During this initial FTS survey, we identified a location that was of high risk for glass penetration. We next used our portable scanning FTS to perform imaging of the area. This probe is meant to be set-up very quickly and performs scans between the horizontal binding steel members on the wall. These scans can range from very small to over 4’ in length and completely cover the area between the binding steel members.
The portable FTS is designed to be very flexible. It mounts to existing steelwork on the furnace. It also collapses to a very small package so that long, narrow scans are large, wide and tall scans can be performed. The tomographic mapping and glass detection using the portable sensor showed an area of several small glass penetrations at the front, insulation board layer. A photograph of the suspected risk area is shown in Figure 10(a). The portable FTS mounted near the area is shown in Figure 10(b).
Figure 10 (a) Suspect area before insulation board removal. (b) Portable furnace tomographic sensor on sidewall.
We reported the findings to the furnace operators, allowing them to access the situation. Temperature measurements on the surface were taken and did not show abnormal readings. Subsequently, the insulation board in this area was removed. This is shown in Figure 11.
Glass was found in this level, as predicted by the FTS. The glass detection along with a photograph of the opened area is shown in Figure 12. A large portion of the glass was found along a joint between internal bricks and was also predicted by the FTS. Again, this further proves the FTS as a glass penetration detection system.
In summary, we quickly pin-pointed a high risk area after surveying a glass-container furnace using a hand-held version of the FTS, then performed detailed mapping and finally confirmed the glass detection by opening the area and finding glass as indicated in the glass penetration detection.
Figure 11. Removal of insulation board at glass penetration area
Figure 12. Glass penetration radar mapping of suspect area and photographs of the exposed glass penetration after insulation board was removed.
In-Situ Scanning FTS
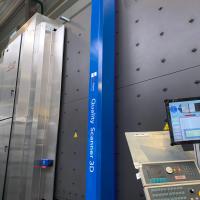
The FTS sensor can also be used in an in-situ implementation. This method enables longterm lifetime scanning of the sidewalls. It utilizes the existing binding steel for attachment of the guiding mechanisms along the entire length of the furnace. Operationally, the in-situ system consists of a mounted rail system and a portable sensor box.
The mounted guide-rail system is very low profile and it does not block the view of the furnace sidewalls. The portable sensor box contains the electronics and hardware to obtain the measurements needed for the glass penetration mapping. This portable sensor box is not permanently mounted on the sidewall and only one is required for a full furnace system with multiple rails. It is simply moved from rail to rail after each scan is done.
We constructed the rail system from low-cost rails where the sensor box was driven by a chain system. The system was mounted on a Libbey furnace, shown in Figure 13. The area marked in red shows the scanning area. There is an abundance of steelwork, buckstays, cooling pipes, hoses and other impediments around the furnace.
However, the in-situ FTS utilizes the fact that there is a clear area that extends several inches away from the furnace sidewall and spans the entire furnace length to perform very long scans and monitoring of the furnace.
The sensor box mounted on the sidewall guide-rails is shown in Figure 14. It was designed to fit between the sidewall and outer impediments and does not physically touch the sidewall itself. The tomographic mapping of a single depth-cut into the sidewall is shown in Figure 15. This shows the interfaces between each layer in red and is not the glass penetration mapping. No glass penetrations were found in the scan area.
Figure 13. Photograph of furnace with marked scan area, also showing the clearance at the sidewall along the length of the furnace.
Figure 14. The sensor box on the furnace wall at different locations.
Figure 15. Tomographic results showing the interfaces between the fiberboard and bonded AZS and the bonded AZS and fused-cast AZS near the center of the scan.
In summary, we have shown the operational feasibility of several different implementations of this sensor: in-situ scanning on a real furnace, and portable scanning and handheld FTS on an operational glass-container producing furnace. These case studies and trials were successful in showing the overall functionality of the FTS for glass penetration detection.
AZS REFRACTORY THICKNESS SENSOR (RTS)
PaneraTech has already developed technology for measuring the AZS refractory lining thickness to the glass, also based on radar imaging through the refractory lining. This has been implemented in a hand-held solution and an installed, in-situ solution.
The hand-held version allows the user to walk around the furnace and probe as many spots as possible. Currently, the hand-held version is ultra-portable. This small size and light weight enables the user to access critical and hard-to-access locations. Additionally, the probe can be used on any type of fusedcast AZS at different Zirconia percentages.
Photographs of its use on operational furnaces are shown below in Figure 16. This version of the tool is weighs less than 2 pounds (0.9 kg) and so is easily mounted on long handles that allow easy access to the exposed metal line on many different furnaces.
Figure 16. The hand-held refractory thickness sensor in operation at tableware and glass container furnaces.
RTS Sensor Blind Trial at Vidrala Furnace
In this section, we discuss the successful blind trials that we performed at the Gallo-Vidro Vidrala glass factory in Portugal. Measurements at the glass level were performed several days before the furnace drain and shutdown and were reported to Vidrala before the blocks were recovered after the drain. Thus PaneraTech had no knowledge of the thicknesses before reporting the RTS thickness results to Vidrala personnel.
Measurements were performed through fused-cast AZS overcoat blocks (32% AZS) at the metal line. The configuration of the blocks and the measurement process is shown in Figure 17. We measured through the overcoat blocks at locations where it was suspected that the original block had been completely eroded.
Gratings that were holding the overcoat blocks in place were cut prior to measurements to allow for access to the exposed AZS. We performed vertical profile measurements as the figure below shows in order to capture the erosion profile as might be expected at the glass level. Eleven areas were measured on many different parts of the furnace.
After the shutdown, five blocks were successfully recovered. The other blocks could not be recovered due to the construction schedule at the factory. All of the measurements were taken with the furnace in full operation with the glass at nominal, operational level.
Figure 17. Sidewall configuration and areas at Gallo Vidro that were measured using the refractory thickness sensor
Figure 18 to Figure 20 show the RTS measurement results for spots numbered 5-7, which were located near the furnace throat. In each figure, we show the actual locations of the measurements on the cold face of the block, the thickness measured at these locations using the RTS probe, and the final confirmation of the recovered block near the RTS thickness measurement locations.
The RTS sensor thickness profile is a vertical scan, starting about 45 mm (1.7 in) from the very top of the overcoat block to 100 mm (4 in) and taking several measurements between.
After the blocks were recovered shortly after the furnace drain, it was indeed found that glass was in direct contact with the overcoat block in these areas: the original block had completely eroded away near the glass level. This was also very evident in the erosion profile observed after the recovery.
Note that the thickness measurements obtained from the RTS probe correspond well with the profile seen in the recovered blocks. In these three cases, it is clear we have successfully measured the thickness of the residual AZS using the RTS sensor.
Figure 18. Spot 5 RTS results and measurements after block removal.
Figure 19. Spot 6 RTS results and measurements after block removal.
Figure 20. Spot 7 RTS results and measurements after block removal.
A table of the overall results from the trial is shown in Table 1. We record the thinnest area obtained from the RTS measurements and the actual thickness at that area measured after the block recovery. In all five cases, we show an accuracy of 95% or better, when comparing the RTS thickness measurement and actual thickness. These actual thickness measurements were confirmed with Vidrala after the block recovery.
Table 1. Overall Vidrala Spot Measurement Summary
Second RTS Thickness Trial
PaneraTech performed an RTS trial at a different glass-container manufacturer in 2015. As with the Vidrala trial, we performed measurements on several areas at the glass level on a furnace to be shortly drained and shutdown. In this case, measurements were through the original glass-contact AZS, which was 34% AZS.
In this case, we were able to enter the furnace after the drain and recover some of the measured blocks. As in the Vidrala trial, PaneraTech did not know the thicknesses of the measurement spots during the measurements. Several measurements were again taken over a small vertical area in order to capture the erosion wear profile at the glass level.
We show one area, seen from inside the furnace in Figure 21. As observed in the photograph, this area shows the deep glass-level erosion cut. These sidewall blocks had significant and elaborate erosion profiles. We performed two vertical-scan measurements near this area, the results of which are shown in Figure 22. These two scan measurements were within 6 inches of each other and we found that the RTS predicted some variation in the profile.
The RTS measurement showed a thickness near the glass level of 1.5 inches, where the thickness of the block near the same area was measured to be 1.6 inches. This trial has shown that the RTS sensor can accurately measure the thickness for thinner blocks (less than 2 inch) with complicated geometries, also with glass contact on the hot-face of the block.
Figure 21. Test area from inside furnace after drain.
Figure 22. Measured RTS thickness and recovered block thicknesses.
In-Situ Measurements at Libbey Furnace
An in-situ implementation of the RTS probe is installed on the furnace itself to continuously and automatically monitor refractory thickness at particular areas. Two in-situ probes have already been installed at Libbey’s Toledo, OH plant on an operational furnace in 2014 and have been in continuous operation. The control box installed near the furnace is shown in Figure 23.
The probes are only in contact with the wall during a measurement (which can be less than a second) and automatically retract when not performing measurements. Any number of insitu probes can be installed in hard-to-reach areas such as throat and in areas where constant monitoring is required. These can be used to monitor critical locations such as the furnace throat and electrode blocks.
This in-situ implementation is important for probing critical yet hard-to-reach areas of the glass melting furnace. Currently, we are in progress of installing sensors to continuously monitor the throat refractory thickness at another Libbey furnace, where the throat is very hard to reach.
Figure 23. Control box for in-situ probes installed at Libbey, Toledo, OH.
CONCLUSIONS AND FUTURE WORK
In this paper, we have detailed the RTS and FTS sensors which comprise part of the overall Smart Melter Solution. We have proven both sensors through fundamental feasibility studies as well as operational blind trials at multiple glass-producing furnaces.
Given the compact and flexible nature of these different tools described in this paper, the full sidewall area of a furnace can be monitored over a scheduled or ad-hoc basis allowing for glass penetration and refractory lining weak spots to be detected and monitored over time. Integrating the data obtained from these sensors into PaneraTech’s Smart Melter Solution, we have enabled deterministic inspection and auditing results for continuous asset life management for preventive and proactive maintenance.
AUTHORS:
Yakup Bayram1, Alexander C. Ruege1, Peter Hagan1, Elmer Sperry2, Dan Cetnar2
1PaneraTech, Inc., Chantilly, VA
2Libbey Glass, Toledo, OH
Learn more about SmartMelter at www.smartmelter.com.