Article Information
- Digital Object Identifier (DOI): 10.47982/cgc.10.733
- Published by Challenging Glass, on behalf of the author(s), at Stichting OpenAccess.
- Published as part of the peer-reviewed Challenging Glass Conference Proceedings, Volume 10, June 2026, 10.47982/cgc.10
- Editors: Christian Louter, Freek Bos & Jan Belis
- This work is licensed under a Creative Commons Attribution 4.0 International (CC BY 4.0) license.
- Copyright © 2026 with the author(s)
Authors: Michael Engelmann a, Johannes Giese-Hinz a, Alexandra Herpich a, Philipp Kießlich b, formerly a
a TUD Dresden University of Technology, Institute of Building Construction, Germany
b ETH Zurich, Institute of Structural Engineering, Switzerland

Abstract
The reuse of architectural glass is a key pathway towards circular construction, yet the absence of standardised procedures for disassembly, specimen preparation, and mechanical characterisation of post-consumer glass limits comparability across studies. We investigated current testing and evaluation procedures and reproduced the full process chain – from deconstruction of insulating glass units and structured specimen preparation, to comparative mechanical testing using coaxial double-ring (CDR) test rig. We provide contributions to developing a harmonised approach by comparing existing methods and investigating a statistical evaluation that allows for uniform comparable strength values over different populations and procedures. Therefore, failure stresses are evaluated following ASTM C1499 and EN 1288 and transformed via time-equivalent and effective-area corrections employing normal, lognormal- and Weibull distributions. This study explicitly investigates the suitability of CDR testing for naturally aged glass. Accordingly, effects of parameter choice on derived stresses and goodness-of-fit metrics are quantified. Specimens were extracted from two façades in Munich, Germany. Results reveal systematic differences attributable to choices of geometry, load rates, and calculation methods. They show that loading configuration and calculation approaches strongly modulate derivable bending strengths. The resulting workflow—from deconstruction to probabilistic evaluation—supports the discussion on harmonised strength assessment of naturally aged glass and provides an evidential basis for ongoing standardisation to enable circular use of architectural glass.
1. Introduction
Architectural flat glass is increasingly considered a high-potential candidate for circular construction (Reshamvala et al., 2024), because it combines long service life with high embodied energy in primary production. In the European policy context, circularity is promoted as a key lever to reduce emissions and resource demand in the built environment as buildings account for around 40 % of energy consumption and 36 % of greenhouse gas emissions in the EU (European Commission, 2020). At the same time, the European Green Deal frames the transition towards climate neutrality by 2050, intensifying the need for reliable strategies that reduce both operational and embodied impacts (European Commission, 2019). Supporting this approach, utilising embodied carbon by retaining the value of energy-intensive flat glass, instead of downcycling it at the end of life, appears attractive.
By properties and ageing behaviour, float glass seems predestined for circular pathways, because it does not undergo (chemical) degradation in the same way as many polymers, composites, metals or concrete. Nevertheless, decades in the building stock do leave traces. Façade glazing is continuously exposed to environmental effects such as temperature cycles, moisture, particles, and contact with animals, as well as to human-induced impacts such as cleaning methods and (improper) handling by owners and users. These influences can alter surface conditions, introduce new defects, supports crack healing, and alters the local strength of individual panes. For glass, this is crucial because fracture is governed by surface flaws and subcritical crack growth. Strength is therefore not a single intrinsic constant, but an outcome of the flaw population and the loading history. For reclaimed glass, flaw populations are likely non-uniform and specific to an individual unit, making the reliable estimation of actual strength and relevant safety margins particularly challenging.
At the same time, mechanical test methods vary in stress state and effectively stressed area, thereby directly influencing the distribution of failure stress between samples which may lead to an unknown variation in batch reliability. Two test methods are particularly relevant in this context: Coaxial double-ring (CDR) testing as standardised in ASTM C1499 (2024) and its European equivalent (i.e.: EN 1288-5, (2000)). While both aim to quantify failure stress of the same basic population, differences in boundary conditions, stress rate, and permissible choices in experimental setup and post-processing make direct comparison non-trivial—especially when flaw populations are heterogeneous and critical defects cannot be reliably detected visually. Likewise, variations in specimen geometry and ring configurations affect the induced stress field and the size of the evaluation area. These factors can influence the proportion of valid samples, bias statistical fits, and ultimately compromise conclusions about reuse viability in terms of mechanical strength.
Reproducible protocols beyond test standard are crucial to increase comparability and to prevent selection effects, particularly because procedures prior to testing (selection from stock due to limited viability, initial qualification by visual assessment, dismantling, transport, and cleaning, specimen preparation) can systematically alter the initial condition and bias the tested population.
This study addresses these challenges by investigating potential influences caused by different test configurations and statistical interpretations using specimen cut from 1996’s windows to support harmonisation of testing procedures and configurations across standards. In detail, standard-based stress calculation, stress rate considerations, and effective-area correction influence the resulting failure stresses, and the validity of test series. Statistical evaluation using normal, lognormal- and two-parameter Weibull distributions is applied to provide comparable results and insights on differences in test methods and specimen series.
2. Current Research on the Strength of Naturally Aged Glass
While first investigations into the capabilities of glass date back as far as 1827, fundamental understanding has immensely advanced ever since. Yet, a stronger trend to deliberately investigate naturally or even artificially aged glass in the context of flaw manipulation and reuse cases is much more recent and has developed alongside increasing interest in sustainability (Mauro and Zanotto, 2014). Naturally, testing procedures differ in detail although they share principal approaches to testing brittle materials such as ceramics.
Overend and Louter (2015) investigated glass that had aged for 20 years in a low-rise building in Norfolk, UK. Specimen were tested according to ASTM C1499 with diameters of 48 mm for the support ring and 15 mm for the loading ring. A displacement rate of 0.05 mm/s (approximately 2.3 N/(mm²·s)) was utilised. A two-parameter Weibull distribution, representing the best fit, resulted in 101.2 N/mm² (P f = 0.50), and 18.7 N/mm² (P f = 0.008).
Comprehensive investigations of damaged surfaces were conducted by (Datsiou and Overend, 2017a; Datsiou and Overend, 2017b), which used naturally and artificially aged glasses. For the CDR diameters of 51 mm, respectively, 127 mm were used with stress rates of 20 N/(mm² · s) and 70 N/(mm² · s) to minimise the effect of sub-critical crack growth. The diameters were chosen based on numerical investigations. Data processing followed normalisation to time equivalent strength according to Browns integral (Brown, 1972). The fracture stress data was fitted using two-parameter Weibull distribution with weighted least squares regression method evaluated by Anderson Darling criteria (Datsiou and Overend, 2018). The results for annealed glass that had aged naturally for 20 years range from 10.0 N/mm² to 18.4 N/mm² (P f = 0.008) and 37.4 N/mm² to 52.8 N/mm² (P f = 0.50).
More recently, Rota et al. (2023) designed and proposed a workflow addressing reclaimed naturally aged glass, its disassembly, visual qualification and mechanical testing alongside first criteria-based decision structures. They correlate surface flaw populations with potential strength to form a classification method. Surfaces were scanned and categorised based on EN 572-8 + A1 (2016) qualification criteria as quality levels (QL) 1, 2, 3 and “unqualified”. The study comprises 43 insulating glass units (IGU) with 28 to 41 years of service life. All panes obtained from disassembly had a nominal thickness of 4 mm. Specimen were tested at 2 N/(mm² · s) according to ASTM C1499-03 (2003) with a selection of loading ring/support-ring diameter combinations, namely 20/80 mm, 40/80 mm and 80/150 mm. Square specimen sizes varied as well with side lengths of 100 mm, 120 mm and 180 mm. The statistical interpretation was carried out with weighted least squared regression and two-parameter Weibull distribution using the method of moments. Overall, the strengths results showed that glasses of QL 1 (fewest flaws) aligned very well with requirements of product standards with characteristic strengths close to and far over 45 N/mm². Glass panes from other QL were only partially sufficient in strength, with inadequate specimens primarily contributing to higher result variance within the series. The main conclusion was that glass age did not significantly affect the measured strengths, whereas surface flaws did. Moreover, ring combinations of 40/80 mm and 80/150 mm were more likely to produce series containing a high number of valid specimens, although the results do not indicate a clear preference between the two.
In addition to disassembly and mechanical testing, Teich et al. (2024) added measurements of average surface roughness, and dew point measurements in reclaimed IGUs from 1979 to 2001 before disassembly. Tests were conducted utilising a loading rate of 2 N/(mm² · s) with specimen of 4 mm in thickness. The ratio of valid samples within the tested series ranges from 56 % to 97 %, and did not exhibit a clear advantage or disadvantage of using the support and load ring sizes of 120 mm and 80 mm, respectively. A two-parameter Weibull distribution, fitted using linear regression, was employed for interpretation. Fracture stresses (5%-quantiles with 95% confidence according to DIN EN 1990 (2002), range from 48.1 N/mm² to 67.9 N/mm². High values for the average roughness of specimen does not correlate with low fracture strength.
Cupać et al. (2024) investigated IGUs that served 30 years in Utrecht, Netherlands. The reclaimed monolithic glass panes of 4 mm and 5 mm in nominal thickness were uncoated. The surface condition of the effective-area within the inner loading ring were investigated using digital microscopy to provide general impressions and draw hypotheses of mechanical strength. The experimental determination of fracture strength was executed with specimen sizes of 100 mm by 100 mm, ring sizes of 18 mm and 90 mm, and a stress rate of 2 N/(mm² · s). For the post-processing of experimental data, more sophisticated methods were applied to estimate fracture stresses, in particular, Faucher and Tyson's weight function and Hazen's probability estimator. Applying these methods adapts post-processing to accommodate small sample sizes and to provide conservative estimates of failure strengths. With the aim of enabling safe reuse of monolithic glass panes, the Anderson Darling goodness of fit was employed; emphasising variance at lower and upper regions of the cumulative distribution function. For one series, a stress rate of 20 N/(mm² · s) was deliberately applied to investigate potential divergences in experimental results. Useful comparison of fracture stresses was achieved by time-equivalent transformation as defined by Brown (1972) for a referenced time of teq = 60 s. Equivalent fracture stresses (EFS) were presented for P f = 0.008 and P f = 0.50, based on recommendations in ASTM E13600-16 (2016). The series tested at higher speed blended well into the equivalent fracture stresses at 50% probability of failure, ranging from 53.6 N/mm² to 86.7 N/mm².
Although not specifically focused on testing naturally aged glass, Datsiou et al. (2025) investigated the effect of flaw-healing methods for artificial damage. ASTM C1499-08 (2009) testing procedure was used for performance evaluation, which included 60 s-time-equivalent fracture stresses, Hazen's estimator, and representation by probabilities according to ASTM E1300-16, while employing a stress rate of 25 N/(mm² · s). Results range between 36.9 N/mm² (P f = 0.008) and 81.8 N/mm² (P f = 0.50).
A clear commonality across the reviewed studies is the use of the coaxial double-ring (CDR) test configuration, predominantly following ASTM C1499. Fracture data is consistently evaluated using a two-parameter Weibull distribution. However, I should be noted that some statistical tests, like groupwise t-tests, require normal distribution of data as a pre-requisite. Typically, distribution is weighted via least-squares regression, and reported as fracture stresses at defined probabilities of failure (commonly P f = 0.008 and P f = 0.50) in accordance with ASTM E1300. When EN 1288-5 procedures were applied, statistical interpretation was instead conducted following either DIN EN 1990 or ASTM E1300.
Despite this shared methodological foundation, experimental setups differ considerably in specimen geometry and ring configurations. Loading and support ring combinations ranged widely, with some dimensions derived from numerical simulations or following the standards. No clear preference for a specific configuration emerges, although certain combinations can produce higher ratios of valid specimens in series.
Specimen sizes typically ranged from 100 mm to 180 mm, and several studies complemented mechanical testing with surface characterisation techniques such as digital microscopy, roughness measurements, or visual quality classifications according to EN 572-8. These approaches aimed to relate flaw populations to fracture strength and to support classification strategies for reuse applications.
Stress rates also varied substantially. While 2 N/(mm² · s) is commonly used in accordance with EN 1288-5, several studies applied higher rates (20–70 N/(mm² · s)) to minimise sub-critical crack growth. More recent investigations increasingly apply time-equivalent transformation following Brown’s integral to enable comparison between different loading rates, and adopt more advanced statistical estimators (e.g., Faucher and Tyson, Hazen) together with goodness of fit-tests such as the Anderson Darling criterion. Across studies, fracture stress is rather governed by surface flaw populations than duration of service life.
Overall, the literature reveals no universally standardised protocol for testing reclaimed glass. Instead, a methodological core — CDR-testing, Weibull statistics, time-equivalent transformation, and defined failure probabilities — is adapted through variations in ring geometries, loading rates, and statistical evaluation depending on research objectives. Future research should therefore systematically compare these parameters to identify testing configurations that maximise reliability, comparability, and the proportion of valid specimens. Even so differences in test and data handling methodology is justified, it is desirable to harmonize results to strengthen conclusions on the same basic population.
3. Case Study - Methodology
3.1. Scope
To investigate the influence of test configuration and statistical evaluation on the assessed failure stress of aged window glass, experimental tests were conducted on glass panes extracted from reclaimed IGUs used for 28 years, between 1996 and 2023, that had been in a residential building (ground floor and oriented to the south) located in Munich, Germany. CDR bending tests were performed in accordance with two relevant standards (DIN EN 1288-5 and ASTM C1499-19). Overall, the environmental conditions are considered typical for a Central European urban location and thus represent a realistic, practical exposure for assessing the mechanical properties of reclaimed glass.
3.2. Dismantling and specimen preparation
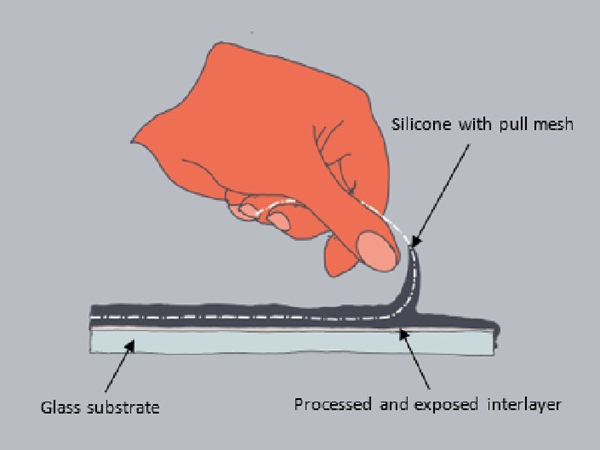
The insulating glass unit included a thin metallic frame surrounding the glass edges, a feature occasionally used in earlier glazing systems to protect the edge seal and provide additional mechanical stability. For dismantling, the metallic edge cover was first removed. Subsequently, the primary and secondary seals were cut along the pane edges using a utility knife. During this process, wedges were inserted between the primary sealant and the glass to maintain separation, facilitating complete cutting of the sealant and preventing re-adhesion of already separated sections.
In total, six original panes with dimensions of 1120 by 815 mm² and a nominal thickness of 4 mm were processed. They were cut using a manual glass cutter. To exclude edge-related pre-damage and adhesive residues from prior service conditions, a minimum of 30 mm along all edges was removed. Subsequently, square specimens of 100 by 100 mm² were produced. In addition, 45 reference specimens made from new glass with identical nominal dimensions were prepared.
An adhesive film was applied to the compression side (facing the loading ring) to retain fragments after fracture, enabling identification of fracture origin. Afterwards, the area within the loading ring was marked in order to clearly locate the position of the origins of the fracture.
3.4. Testing Procedure
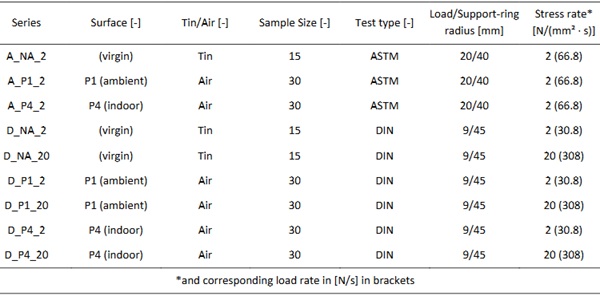
CDR bending tests were performed according to DIN EN 1288-5 and ASTM C1499-19 configurations. Depending on the respective test series, two different support and load ring radii as well as different stress rates were applied. The DIN configuration was tested at stress rates of 2 N/(mm² · s) and 20 N/(mm² · s), while the ASTM specimen were investigated at 2 N/(mm² · s) only as is summarized in Table 1.
Table 1: Test Matrix
All experiments were conducted using a universal testing machine (Instron 5881). Initially, a 5 kN load cell was employed. As fracture loads approached the upper measurement range during the first test runs, it was replaced by a 50 kN load cell to ensure sufficient measurement capacity. The 50 kN load cell provides an accuracy of 0.25 % of the measured value, ensuring comparability of the recorded results.
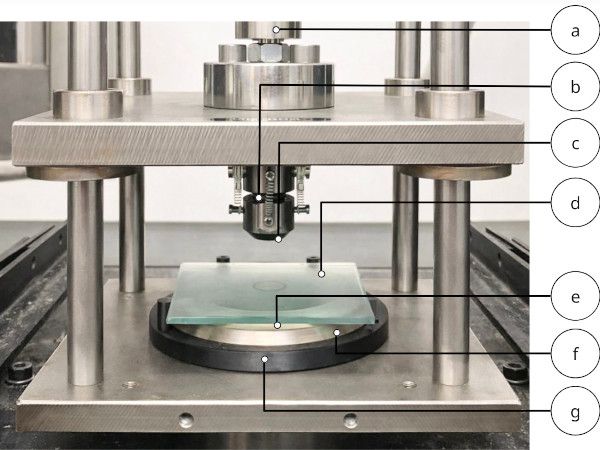
A custom-designed CDR bending fixture (see Fig. 1), consisting of a support ring (f) and a load ring (c), was mounted in the testing machine. A spherical seat (b) was integrated between the load rod (a) and the load ring (c) to compensate for minor misalignments and ensure uniform axial loading. For testing, the specimens (d) were positioned on a silicone interlayer (e) placed on the support ring in order to minimise local stress concentrations. Alignment jaws (g) ensured centric positioning of the specimen and controlled load introduction.
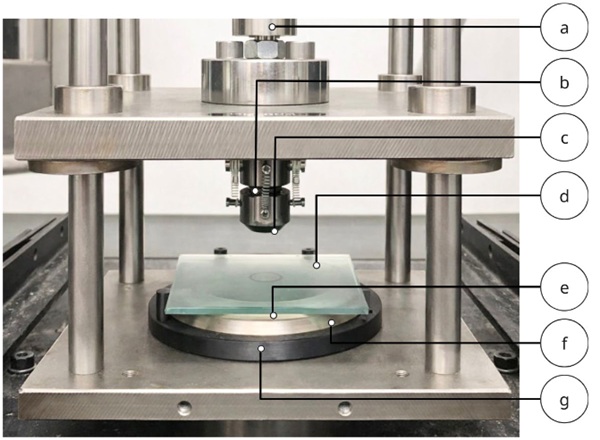
First, the loading ring was lowered and manually aligned until stable, uniform contact was achieved, applying a preload of approximately 30–40 N. The tests were then initiated via the machine control software and continued until specimen failure. After fracture, the origin of failure was determined.
During testing, the relative humidity ranged between 36.6 % and 38.2 % at temperatures between 22.7 °C and 23.0 °C. While the temperature complied with the standard tolerances, the humidity was slightly below the recommended range which is considered an insignificant deviation.
3.5. Calculation and Statistics
Failures stresses σbB were calculated from maximum force according to provisions in the standard.
After removing invalid results as defined in the test standards, outliers per series were flagged and removed from the data base as well. Outliers were defined as values below the first quartile minus 1.5 x interquartile range (IQR) and above the third quartile plus 1.5 x IQR.
Results in all groups are fitted to typical distribution functions, namely normal distribution, lognormal distribution and two-parameter Weibull distribution, using maximum likelihood estimation. As a result, distribution parameters are derived as well as Anderson-Darling goodness-of-fit statistics as defined by Stephens (1986) and used in (Delignette-Muller and Dutang, 2015).
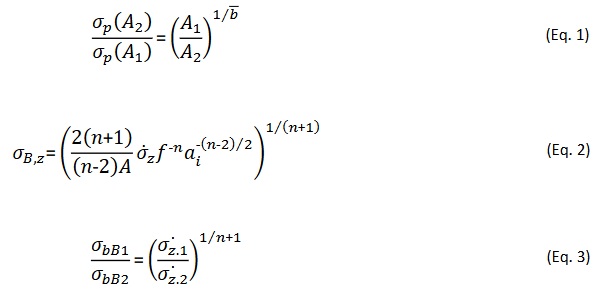
As a reference we used the strength of annealed glass according to EN 572-2. Therefore, results were transformed to fit the reference stress rate of 2 N/(mm² · s) and reference loaded surface of 360 by 200 mm² = 72,000 mm². We use the method by Blank (1993) to transform surface area based on Weibull statistics (Eq. 1). Furthermore, we use findings by Kerkhoff et al. (1981) regarding the effect of stress rate on fracture stress (Eq. 2) to derive the ratio of fracture stresses using two different strain rates, but based on the same geometry of glass cracks (f) and ambient conditions the glass is exposed to (using n = 18.1 for 50%RH according to (Kerkhoff et al. 1981)) expressed by Eq. 3.
Finally, we tested for significant differences between series by conducting analysis of variance (Student’s t-test) that result in p-values for comparison with a threshold of α = 0.05. Assuming different variance in series, we use Games-Howell test to test hypothesis and Bonferroni method to adjust p-values.
Finally, we give failure stresses by fitting two-parameter Weibull distribution and calculate 5%-quantiles (95% CI) and describe the goodness of Weibull-fit by plotting the relevant coefficient of determination (R²).
4. Results and Discussion
4.1. Geometry and Size of Series
In total, 222 observations were recorded including 12 outliers and 54 invalid tests, resulting in a success rate of 76 %. This is comparable to the ratio of valid versus tested specimen of 56 % to 90 % in (Rota et. al 2023) as well as 50 % to 100 % in (Teich et al. 2024) but larger than a total of 50 % (ranging from 36 % to 86 %) in (Cupać et al. 2024).
A mean thickness of 3.88 mm ranging from 3.81 mm (min) to 3.91 mm (max) leads to the conclusion that all samples comply with tolerance demands in EN 572-2 of 4 mm ± 0.2 mm.
4.2. Failure Stresses by Series
Figure 2 shows all failure stress by series excluding outliers and invalid tests. Apparently, there is no significant differences between groups. We checked for differences between groups of specimens tested in the ASTM and DIN method (p < 0.001), specimen with different stressed surface area (p < 0.001) and different stress rate (p < 0.001).
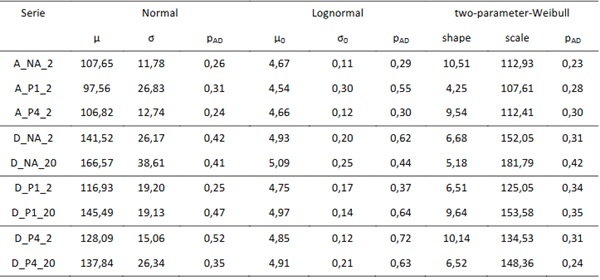
Furthermore, it seems reasonable to assume normal, lognormal and Weibull distribution. Therefore, Table 2 gives the distribution parameters as well as goodness of fit evaluation for each group. In all cases, the goodness of fit p-value is larger than 0.05, so we failed to reject the null hypothesis of data following the assigned distribution. So, there is no indication the data is solely distributed according to one single, specific distribution. Nevertheless, earlier studies that focused on Weibull-distribution to describe their results can be considered confirmed in the aspect. It is reasonable to describe the data using the parameters of Weibull to transform each observation in terms of loaded surface area and stress rate. Yet, assumption of normal distribution forms the base for several statistical tests.
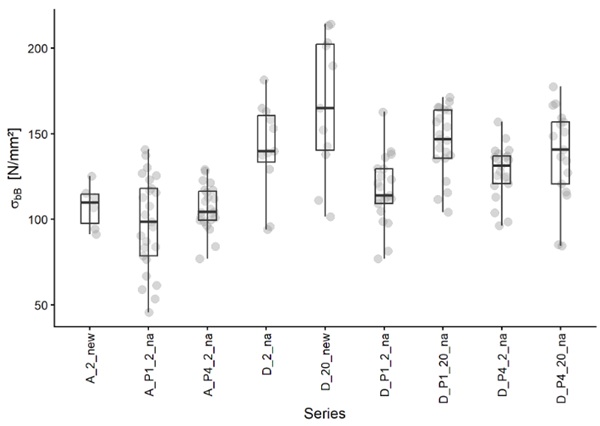
Table 2: Parameters of fits, goodness of fit.
4.3. Transformed Failure Stresses by Series
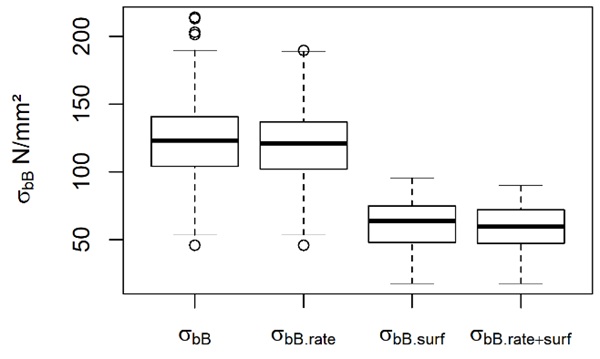
The failure stress after the test (σbB ) is transformed to reference stress rate (σbB.rate) as well as to loaded surface (σbB.surf ) independently. The latter gives a larger reduction as CDR is performed at a considerably smaller surface. The final transformation is represented in the boxplot of σbB.rate+surf which is close to the expected annealed glass strength of 45 N/mm2. However, these transformed results require further split according to specimen conditions and properties. The results also point to the need to define a mutual reference when comparing results.
4.4. Transformed Failure Stress by Surface
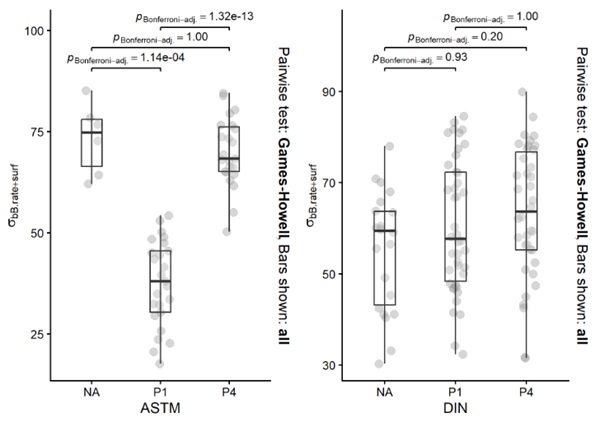
Fig. 4 (left) shows the transformed results of after ASTM testing. Although there is no significant difference between virgin glass (“NA”) and specimen tested at P4 surface, it is obvious that P1 surfaces resulted in significantly smaller results, even below characteristic annealed glass strength, indicating that exposure plays a role in naturally aged glass strength. Nevertheless, this result cannot be expected as a general rule as Fig. 4 (right) illustrates for specimen tested according to DIN method. We did not find significant differences between failure stress DIN-testing different surfaces. Also, the magnitude of results is considerably larger and rarely falls below characteristic annealed glass strength.
Additionally, no significant difference was found between virgin glass samples (pvirgin.DIN_vs_ASTM < 0.002), P1-surface samples (p P1.DIN_vs_ASTM < 0.001) and P4-surface samples (p P4.DIN_vs_ASTM = 0.036 < 0.05). Therefore, we cannot exclude the possibility that samples describe the same population statistically.
Difference in groups is more likely to be explained by surface condition and exposure of individual samples rather than test method (stress rate and stressed surface area). Hence, we merge transformed results from sample groups from ASTM- and DIN-testing and we use the knowledge to create a “worst-case scenario” (A_P1_2 only) and a “best-case scenario” (excluding A_P1_2) for comparison including all valid samples (“all scenario”) for assessment of quantile values that will be compared with characteristic strength of virgin glass.
To further confirm or reject findings in other publications, a transformation to the same basis is necessary.
4.5. Quantile Ranges in Merged Sample
Fig. 5 shows the Weibull-plot including confidence bands (95 % CI) for the best-case, worst-case and all-scenario. It is obvious that the linear Weibull-fit explains the data well with slight offsets in the lower and upper end. This is underlined by goodness-of-fit coefficient of determination close to 1.0 (Table 3).
The worst-case in Fig. 5 is furthest to the left as expected with a wide confidence band as the number of specimens is comparatively small. Therefore, the smallest 5 %-quantile of 13.2 N/mm² is the outcome. In contrast, the best-case slope is steeper and shifted to the right on the stress-axis while the “all” scenario falls between the two extremes. It should be noted that the confidence bands using a considerably larger number of data points is smaller.
Even so the numbers of outliers found (12 in 222) is considered small, we studied the effect of their exclusion on the 5 %-quantiles in the all-scenario. While the exclusion of all outliers results in 25.2 N/mm2, the inclusion of all outliers gives 23.4 N/mm2 (93 %) and the exclusion of upper outliers results by chance in the same value. The effect of sparse values at the ends of the distribution is noteworthy. Therefore, we further need to discuss handling of outliers and their statistical as well as their physical meaning in this context.
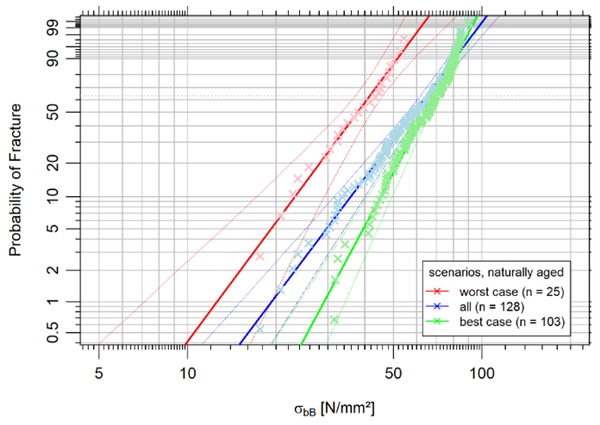
Table 3 summarizes relevant data points for comparison with existing studies.
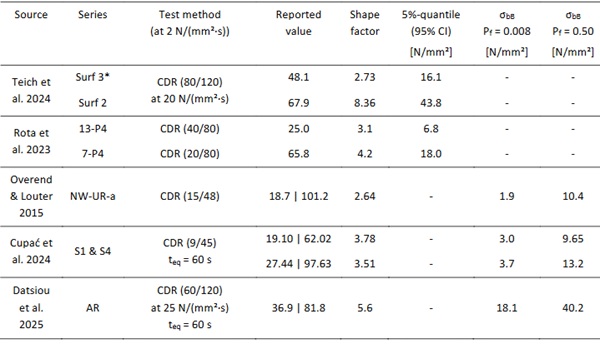
Teich et al. (2024) reports 5 %-quantile values between 48.1 N/mm² and 67.9 N/mm² using CDR from EN 1288-5 at load ring sizes of 80 mm and 120 mm and stressed at 20 N/(mm²·s). Transforming stressed area from 5,026 mm² to the reference of 72,000 mm² using (Eq. 1) calls for a reduction to 16.1 N/mm² (shape = 2.73) and 43.8 N/mm² (shape = 8.36) respectively. In the same manner, results by Others were also transformed and printed in Table 3. Thus, the results by Teich et. al (2024) are close to the “all” scenario in this study on the one hand. But on the other hand, they considerably exceed even the “best-case” values.
Rota et. al 2023 also reports 5 %-quantile values which are close to the “all” and “worst-case” scenario in the presented study.
Overend & Louter (2015) report smaller values compared with the scenario values in Table 3. It should be noted that this coincidences with a remarkably small shape factor in their Weibull analysis. This caused a tremendous reduction after transformation.
Finally, Cupać et. al (2024) and Datsiou et. al (2025) report 60-s-equivalent results. So, a direct comparison with results of this study remains limited. Nevertheless, while results by Cupac et. al (2024) fall below the range of this study, Datsiou et. al (2025) results yield between “all” and “worst-case” at a probability of failure of 50 % and fall close to the “all” scenario at Pf = 0.8 %.
It should be noted that results by Others were transformed based on the results per series while results in this study were transformed before applying a statistical evaluation making a direct comparison difficult and challenging. Also, transformation according to stress rate was performed on different assumptions which need further investigation. Therefore, it is recommended to merge all raw data in a joint evaluation on the very same basis during future endeavours.
Table 3: Results of Weibull-fit and quantile values.
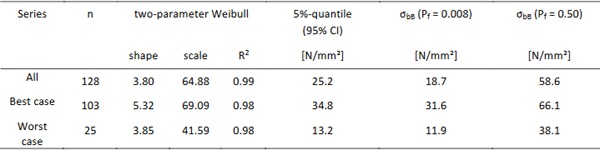
Table 4: Transformed results (min and max) by Others, Aref = 72,000 mm and reference stress rate of 2 N/(mm²·s).
5. Summary, Conclusion and Outlook
We conducted a study on the surface strength of virgin glass versus naturally aged glass cut from 28 years old IGUs from a building in Munich, Germany. CDR tests according to DIN 1288-5 and ASTM C1499 at a choice of stress rates and loaded surface area showed to be transformable to a mutual base, which was underlined by non-significant differences between means in subsets of data. However, single surfaces might show significant differences underlining the need for proper sampling in a building when targeting for reuse of glass while destructively testing a relevant number of materials only. The results of the presented case study are in most cases similar to the expected values as presented by Others. It should be noted that direct comparison remains challenging.
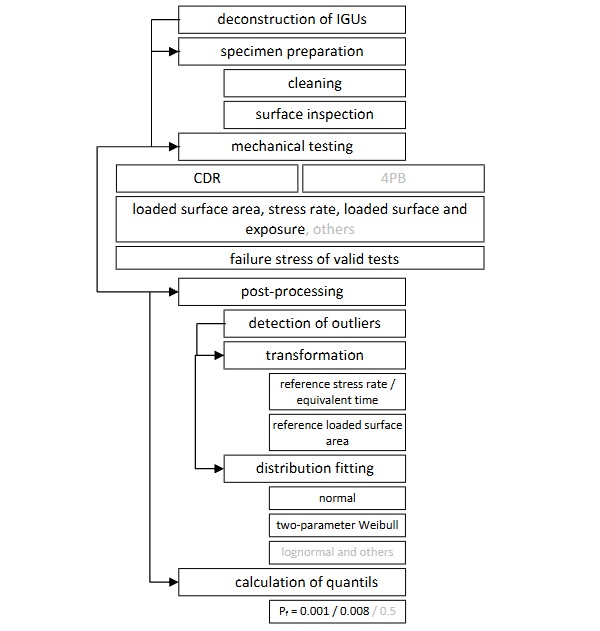
Therefore, we conclude to propose the following process (Fig. 6) which (still) includes several options to be harmonized in future works. One key aspect will be surface characterization to identify parameters that allow finding correlations to and causations of failure stress non-destructively.
Most pressing further questions concern:
- The methods for post-processing such as definition, handling and interpretation of outliers (e.g. by IQR-distance or statistical tests such as Grubbs, Dixon, Rosner).
- Methods to transform to reference stressed area (e.g. effective stress used by Blank (1993) or others) and stress rate (e.g. equivalent time via Browns integral, Kerkhoff’s method or others).
- Finally, the limited studies presented so far do not allow for final proposal of distribution function of data (e.g. normal, lognormal or 2/3-parameter Weibull distribution). Methods to find the best fit (e.g. maximum likelihood estimation, moment matching estimation, maximum goodness-of-fit estimation) and explain goodness of fit (e.g. Kolmogorov-Smirnov, Cramer-von Mises, Anderson-Darling) as well as statistical approach to group comparisons (e.g. ANOVA, Student's or Welch's t-test as well as effect size estimation) including p-value adjustment.
Those are necessary requirements to find significant effects that determine the surface (and edge) strength of naturally aged glass. Therefore, we propose a joint study using existing data, flagging and closing potential gaps in data and harmonizing the process to set a base for reusing reclaimed flat glass in the future.
References
ASTM C1499-19: "Test Method for Monotonic Equibiaxial Flexural Strength of Advanced Ceramics at Ambient Temperature". West Conshohocken, PA: ASTM International (2024).
ASTM E13600-16: "Practice for Determining Load Resistance of Glass in Buildings". West Conshohocken, PA: ASTM International (2016).
Brown, W. G.: A load duration theory for glass design (1972) https://doi.org/10.4224/20374822
Cupać, J., Datsiou, K. C., & Louter, C.: Reuse potential of architectural glass: experimental study on the strength of used window glazing. Glass Structures & Engineering, 9(3-4), 321–337 (2024) https://doi.org/10.1007/s40940-024-00267-y.
Datsiou, K. C. et al.: Influence of thermal and water treatment on strength recovery for soda lime silica glass. Glass Structures & Engineering, 10(3) (2025) https://doi.org/10.1007/s40940-025-00298-z.
Datsiou, K. C. and Overend, M.: Artificial ageing of glass with sand abrasion. Construction and Building Materials, 142, 536–551 (2017a). https://doi.org/10.1016/j.conbuildmat.2017.03.094
Datsiou, K. C. and Overend, M.: The strength of aged glass. Glass Structures & Engineering, 2(2), 105–120 (2017b). https://doi.org/10.1007/s40940-017-0045-6
Datsiou, K. C. and Overend, M.: Weibull parameter estimation and goodness-of-fit for glass strength data. Structural Safety, 73, 29–41 (2018) https://doi.org/10.1016/j.strusafe.2018.02.002.
Delignette-Muller. ML and Dutang, C.: “fitdistrplus: An R Package for Fitting Distributions.” Journal of Statistical Software, 64(4), 1–34 (2015). doi:10.18637/jss.v064.i04
European Commission. The European Green Deal (2019).
European Commission. A Renovation Wave for Europe - greening our buildings, creating jobs, improving lives (2020).
DIN EN 572-2:2012-11 “Glas im Bauwesen - Basiserzeugnisse aus Kalk-Natronsilicatglas - Teil 2: Floatglas”; German Version EN 572-2:2012
DIN EN 1288-5:2000-09: “Glas im Bauwesen - Bestimmung der Biegefestigkeit von Glas - Teil 5: Doppelring-Biegeversuch an plattenförmigen Proben mit kleinen Prüfflächen”; German Version EN 1288-5:2000.
Kerkhoff, F., Richter, H. and Stahn, D.:Festigkeit von Glas Zur Abhängigkeit von Belastungsdauer und -verlauf. Glastechnische Berichte 54 (8), 265-277 (1981). https://doi.org/10.34657/17422
Mauro, J. C. and Zanotto, E. D.: Two Centuries of Glass Research: Historical Trends, Current Status, and Grand Challenges for the Future. International Journal of Applied Glass Science, 5(3), 313–327 (2014). https://doi.org/10.1111/ijag.12087
Overend, M. and Louter, C.: The effectiveness of resin-based repairs on the inert strength recovery of glass. Construction and Building Materials, 85, 165–174 (2015) http://dx.doi.org/10.1016/j.conbuildmat.2015.03.072.
Reshamvala, M. et al.: Case Study on the Re-use Potential of Insulated Glass Units. Challenging Glass Conference Proceedings, 9 (2024). https://doi.org/10.47982/cgc.9.638
Rota, A., Zaccaria, M., & Fiorito, F.: Towards a quality protocol for enabling the reuse of post-consumer flat glass. Glass Structures & Engineering, 8(2), 235–254 (2023). https://doi.org/10.1007/s40940-023-00233-0
Stephens, MA.: Tests based on edf statistics. In Goodness-of-fit techniques (D'Agostino RB and Stephens MA, eds), Marcel Dekker, New York, pp. 97-194 (1986).
Teich, M. et al.: Reuse and remanufacturing of insulated glass units. Glass Structures & Engineering, 9(3-4), 339–356 (2024) https://doi.org/10.1007/s40940-024-00276-x.