First presented at GPD 2017
And, how can designers achieve enhanced occupant experience with passive measures, minimizing the use of HVAC systems in such spaces?
In this study variables, such as air and radiant temperatures, air velocity, relative humidity and direct solar component were identified as the “working tools” in order to create different indoor environments that fulfil expectations and serve the building’s function. Parameters such as adaptability, occupants’ expectation and duration of stay within each space are also affecting the acceptance levels of thermal comfort.
The study includes the existing standards and comfort models and synthesizes this knowledge to develop a “hands on” method that will help designers meet the comfort expectations of diverse spaces with respect to the vision and the functionality of the building.
As a result, an excel based tool was developed that can help designers in understanding thermal comfort and the important affecting variables, leading to appropriate measures for avoiding thermal discomfort and fulfilling the set performance requirements. The tool was used on a case study, where thermal comfort limits were examined for different types of spaces.
Introduction
The lack of methodology for assessing thermal comfort in non-standard spaces can often be recognized when dealing with non-conventional buildings. The lack of appropriate methods that feed comfort assessments is even more evident when it comes to highly glazed spaces, as the effect of the direct solar component is a significant factor in those space, but is neglected by standard methods for assessing thermal comfort.
This generates a question as to whether comfort is appropriately assessed when using Dynamic Thermal Modelling tools. Furthermore, this generated one more question: are there any tools that can assist the designer size potential discomfort in early design stages?
Often, the design process is based on the principle of try and error, where the design is tested through a simulation program and if it doesn’t fulfill the specified comfort requirements the process needs to start again. But how can we bring the knowledge of thermal comfort into the early design process so that it can help designers find an appropriate design solution?
Problem formulation - case study
The initiation of this project idea came when examining microclimates for a fully glazed tropical park in south of Sweden. Within this project, it was essential to provide enhanced occupant comfort in various types of spaces such as entrance areas, cafeteria, cinema and most importantly the exhibition areas. In the latter spaces, specific plants and animals would need to co-exist, while the environment needs to simultaneously be pleasant for the visitors.
Although this project is somewhat extreme, the questions that arose can easily be applicable to any building with spaces with different function and design. Some of those questions are: Which is the appropriate comfort model for the different types of spaces? Can the same model be used for accessing thermal comfort in diverse spaces with different occupant use e.g.in an entrance space and in a cinema hall or in an atrium and in an office space?
Background theory
It has been demonstrated that the main environmental parameters that influence perception of thermal comfort are air temperature, mean radiant temperature (MRT), relative humidity (RH) and air velocity (va ) [10]. Furthermore, the activity level and clothing level can also significantly affect comfort [10]. Those parameters are used in a model called PMV [5] that has been widely used to evaluate thermal comfort in buildings and has also been included in European and International Standards ( [3], [4], [1]). The model uses the theory of human thermal regulation and is calibrated according to results of experiments from climate chambers [5].
However, the approach used to develop the PMV model have been criticized, because it considers human beings to be passive recipients of the thermal conditions [7]. Adaptive comfort model was developed, that considers the” human factor” or in other words the ability of people to adapt to their environments, thus being able to function in wider range of environmental conditions [9]. The model is derived from statistical data, comparing the outdoor temperature to the comfortable indoor operative temperature and differentiating between conditioned and non-conditioned buildings [9].
Another model, called Universal Climate Index (UTCI), was developed in recent years, that uses computer model for human response to thermal environment [2]and [6]. The index is an equivalent of the air temperature in Celsius of a reference environment that is providing the same thermal sensation as the actual environment [2]. It is mostly used to describe outdoor thermal comfort.
International and European standards that address thermal comfort in buildings have adopted the PMV model for assessment of thermal comfort in standard buildings. The adaptive model is recommended only for non-conditioned buildings or parts of the year when the building is not conditioned. The standards do not deal with outdoor or semi external spaces.
Several studies have led to conclusions that the standard recommendations cannot be used, when thermal comfort is assessed in not standard spaces such as entrance areas or highly glazed atria ([11] and [12]). It is suggested that in such spaces adaptive model is appropriate regardless if the space is conditioned or not. Wider comfort limits are also considered acceptable compared to the ones stated in the standards [8].
Method
In this project a methodology was developed and formed into an excel based tool, that can help designers to improve their understanding of thermal comfort and the implication of different parameters to it [13]. Different comfort models were used to predict the thermal expectations in various types of spaces, the focus was set to transitory and highly glazed ones, as they are not well covered in the standard recommendations for thermal comfort.
The tool through an iterative process can potentially help designers to set the right performance requirements of the building envelope and find appropriate set points for control mechanisms used in the building. The tool developed within this work uses thermal comfort models – predicted mean vote (PMV), adaptive model (AM), an extended AM for transitory spaces and UTSI, to set the limitations for the environmental parameters that affect the human perception of thermal comfort namely - air temperature, MRT, RH and air velocity. Variables as activity and clothing level are also considered.
Algorithm for finding appropriate comfort model was developed, based on the existing literature, that considers also factors as space type, adaptation possibilities, duration of occupation and connection to exterior. The algorithm suggests two options: 1) appropriate comfort model according to the literature; and 2) the standard recommended model, see Figure 1.
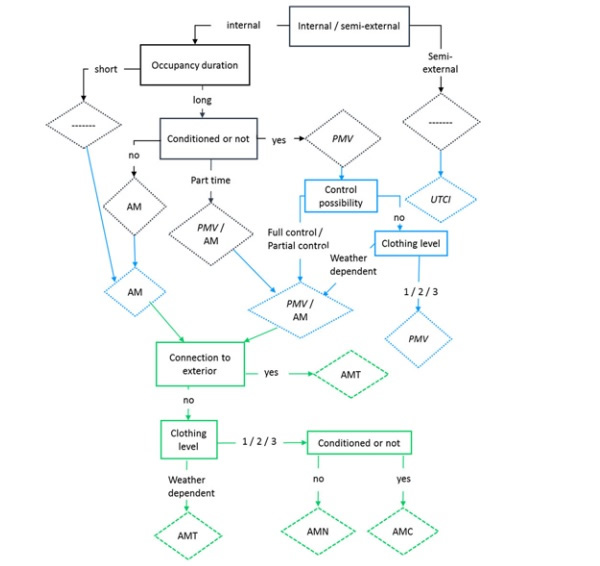
In the figure with black outline are presented the steps taken to identify the comfort model that is recommended by the standards. In case the standards do not cover the type of space in question the value “---“ is given. In the figures with blue outline are the steps necessary to determine a suitable comfort model based on the background literature review. In green outline are the steps taken to define the type of AM to be used, when it is suitable or standard recommended, where AMT is adaptive model for transitory space, AMN is adaptive model for non-conditioned spaces and AMC is adaptive model for conditioned spaces.
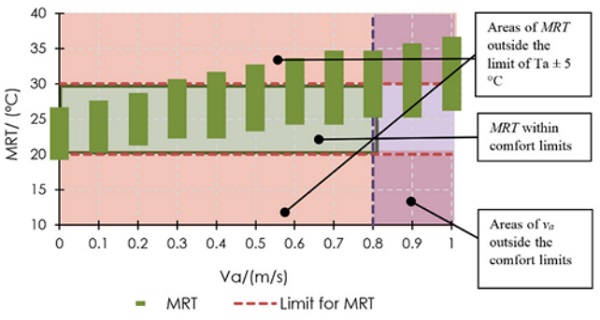
Further the excel tool gives the users possibility for varying each of the environmental parameters and examine their effect to the thermal comfort, according to the different models. With changing one environmental parameter, visual graphs are automatically created to inform the user about the comfort limits of each parameter. The first informative graph, see Figure 2, presents MRT and va for given Ta and in the case of PMV and UTCI also given RH.
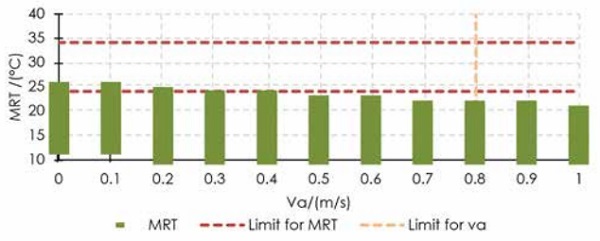
In this case the MRT and va for Ta = 25 °C and RH = 50 % are presented. The green bars of the graph represent the MRT values for different va that result in comfortable conditions. The area highlighted in green is the area where MRT is within the limit of Ta ±5 °C. The areas highlighted in light red include values of MRT that are within the comfort limits according to the models, but are outside the limit of Ta ± 5 °C. The purple area of the graph indicates that the air velocity is higher than the limit for comfort of 0.8 m/s. From the graph, it can be read for the given Ta what the limits are for MRT at which for example natural ventilation can be sufficient and when it is necessary to add solar control in order to reduce the MRT.
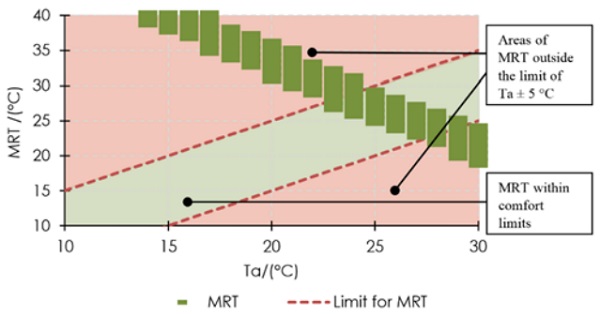
The second informative graph, Figure 3, presents MRT and Ta for given va and in the case of PMV and UTCI also given RH. In this case combinations of MRT and Ta are presented, for va = 0.1 m/s and RH = 50 %. In this graph the limits for MRT of Ta ± 5 °C are shown with red lines. The green area shows values of MRT within this limit. The light red areas show MRT values that would still result in comfort conditions, but are outside the limit of Ta ± 5 °C. This can inform the designer of the possibility to use passive measures as shading devises or solar gains, and when active heating or cooling needs to be applied. The comfort limits are set according to EN 15251 and ISO 7730.
Within this study different areas were chosen from the case study, described above. In this paper, only the entrance space will be presented to demonstrate the value of the developed tool. The characteristics of the space were as follows: space type – internal; part time conditioned; limited adaptation possibility; short duration of occupation and connected to exterior.
Results
The comfort models, recommended by standards for this space, are PMV for the part of the year when the space is conditioned and AM when it is not. However, based on the literature review the algorithm created has suggested that an extended AM for transitory spaces can be used to describe the comfort limits throughout the whole year. When examining different combinations of environmental parameters using the developed method, it was observed that for air velocity of 0.1 m/s the minimum value of the air temperature that falls within the comfort limits is 18ºC and the maximum is 29ºC, demonstrated in Figure 4.
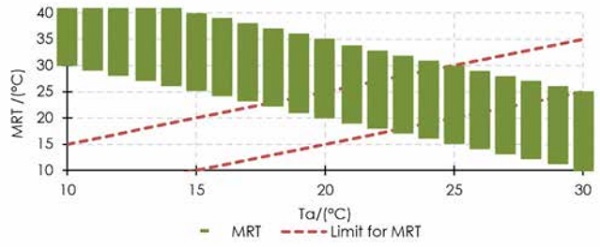
For these values of air temperature, the MRT can be 23ºC and 24ºC respectively. The largest spans for MRT are form 18 °C to 28 °C and from 19 °C to 29 °C, indicated in Figure 4 by the green bars, corresponding to air temperature of 23 °C and 24 °C respectively. These results show that air temperature as low as 18 °C can be compensated by higher MRT.
To consider the risk of overheating and possible measures to prevent it, air temperature of 29 °C was considered. The combinations of MRT and air velocity, that would result in comfort conditions, were examined, see Figure 5. The span of permissible air velocity for this air temperature is from 0 to 0.2 m/s, with MRT of 24 °C to 25 °C. Since the air temperature is rather high, lower MRT values are needed to achieve comfort, which would result in bigger difference between MRT and the air temperature than it is considered appropriate by the standards.
Thus, lower air temperature is required to have a better chance to avoid overheating only with varying the air velocity or the MRT. In practice this means that the air temperature should be lower than 29 °C so that natural ventilation and shading will be able to have positive effect on the thermal comfort. If the air temperature exceeds this level a cooling system needs to be considered with lower set point to achieve acceptable thermal conditions.
Conclusions
Through a case study it was demonstrated that the method can be valuable for building designers in understanding thermal comfort and the effect of different environmental parameters as air temperature, mean radiant temperature, air velocity and relative humidity. The method can help designers in finding appropriate measures for avoiding thermal discomfort, by defining the limits for each environmental parameter. It can be useful especially for nonstandard and highly glazed spaces in finding the appropriate comfort model, as those spaces often cannot be assessed properly by the standard comfort models.
The tool is flexible in a way that it allows designers to dynamically change all parameters, explore their limits and find combinations that provide comfort conditions. The tool is also valuable as it uses standard recommendations to derive comfort limits as described in EN 15251 and ISO 7730 and also gives alternative solutions taking into consideration the latest scientific knowledge.
References
[1] ASHRAE, 2004. Thermal Environmental Conditions for Human Occupancy - ANSI/ASHRAE Standard 55. s.l.:American Sociaty of Heating, Refrigerating adn Air-Conditioning Engineers, Inc..
[2] Blazejczyk, K. et al., 2010. Principals of the New Universal Thermal Climate Index (UTCI) and Its Application to Bioclimatic Research in European Scale. Miscellanea Geographica, Volume 14, pp. 91-102.
[3] EN 15251, 2007. Indoor Environmental Input Parameters for Design and Assessment of Energy Performance of Buildings Addressing Indoor Air Quality, Thermal Environment, Lighting and Acoustics. Brussels: European Commetee for Standardization.
[4] EN ISO 7730, 2005. Ergonomics of the thermal environment – Analytical determination and interpretation of thermal comfort using calculation of the PMV and PPD indices and local thermal comfort criteria. Brussels: European Comitee for Standardization.
[5] Fanger, P. O., 1970. Thermal comfot. Copenhagen: Danish Technical Press.
[6] Fiala, D., Lomas, K. j. & Stohrer, M., 2001. Computer Prediction of Human Thermoregulatory and Temperature Responses to a Wide Range of Environmental Conditions. International Journal of Biometeorology, Volume 45, pp. 143-159.
[7] Halawa, E. & van Hoof, J., 2012. The Adaptive Approach to Thermal Comfort: A Critical Overview. Energy and Buildings, Volume 51, pp. 101-110.
[8] Hui, B. S. C. M. & Jie, J., 2014. Assessment of thermal comfort in transitional spaces. Kowloon, Hing Kong, Proceedings of the Joint Symposium 2014: Change in Building Services for Future
[9] Nicol, F., Humphreys, M. & Roaf, S., 2012. Adaptive Thermal Comfort: Principles and Practice. London: Taylor and Francis group.
[10] Parsons, K. C., 2003. Human thermal anvironments. second ed. London: Taylor and Francis group.
[11] Pitts, A., 2010. Occupant acceptance of discomfort in an atrium building: to sweat or to shiver?. London, Department of Architecture and Planning, Sheffield Hallam University.
[12] Pitts, A., 2013. Thermal Comfort in Transition Spaces. Buildings, Volume 3, pp. 122-142.
[13] Deliahmedova, M. Examination Of Adaptive Thermal Comfort Models For Appropriate Assessment Of Thermal Comfort In Transitory And Semi-External Spaces,Lund, Department of Energy and Building Design, Lund University