Authors: Madison Likins-White, Robert C. Tenent and Zhiqiang (John) Zhai
Source: Buildings 2023, 13(2), 551; MDPI
DOI: https://doi.org/10.3390/buildings13020551
(This article belongs to the Section Building Energy, Physics, Environment, and Systems)
Abstract
Insulating glass unit (IGU) degradation has been studied extensively. However, there is limited understanding of how present durability evaluation standards relate to product lifetime. Furthermore, there is debate on how to quantify performance of installed windows over time to better understand degradation processes. More knowledge on these topics is required to link durability evaluation to product lifetime projections based on energy performance. Energy models provide helpful estimations of total annual building energy consumption. However, most models are based on “as installed” performance of envelope components and fail to account for performance degradation. This can lead to an underestimation of building lifetime energy consumption.
A better understanding of the relationship between durability and energy performance can inform integration of degradation dynamics into energy modeling software. This will improve lifetime building energy consumption estimations as well as inform appropriate retrofit strategies and timing. This paper reviews current durability literature, various standards for window performance ratings and weathering methods, existing in situ IGU energy performance measurement techniques, and whole-building energy effects. The challenges and disparities among various studies are analyzed and discussed. The authors hope that further work in this area will lead to the development of improved in situ test methods to assess IGU degradation in the field and link this knowledge to improved energy performance modeling approaches.
1. Introduction
The building sector is responsible for 40% of total energy consumption and more than 35% of greenhouse gas emissions within the US, as shown in Figure 1 [1].
![Figure 1. Global CO2 Emissions by Sector; regenerated [2].](/sites/default/files/inline-images/Fig1_303.jpg)
The building envelope is the main thermal barrier between the indoor and outdoor environments and includes the walls, windows, roof, and foundation. The building envelope is a weak point of overall building consumption and is vital for improving building performance. It is estimated that the building envelope makes up 30% of energy consumption for residential and commercial buildings with windows accounting for 15–50% of those total envelope transmission losses and 10% of total energy consumption of buildings [3,4,5,6]. The effects of the envelope performance cascade to all systems within a building; a more efficient envelope not only reduces thermal transmission, but can also reduce equipment size, cut down water use, improve the overall lifecycle of a building, and increase thermal comfort. However, the thermal performance of the envelope is not static over a building’s lifetime; it decreases with age and weather, leading to higher energy requirements. It is estimated that envelope and HVAC degradation can lead to an increase in building energy consumption by 20–30% [7].
Windows make up a large portion of envelope losses depending on window type, climate, and building type [4,5]. Not only do windows have a high U-factor compared to opaque envelope components, but they also have solar gains that contribute to their overall heat transfer into spaces (solar heat gain coefficient). Figure 2 shows that 84% of solar radiation striking the window is transferred into the space in the form of heat [8].
![Figure 2. Solar Radiation on a Window; regenerated [8].](/sites/default/files/inline-images/Fig2_311.jpg)
The solar radiation and thermal conductivity lead to increased heat gains in the summer which increase cooling loads. In the winter, only the conductivity contributes to the increase in heating required. The conductivity associated with extreme temperature differences and the solar radiation striking windows also drive degradation [9]. Windows are typically broken down into two physical components: the insulating glass unit (IGU) and the frame. The IGU consists of at least two glass lites that are separated by a spacer system, typically containing a desiccant material with the edges of the units sealed using various polymeric materials. The interior of the sealed unit is typically filled with an inert, low thermal conductivity gas, and the glass lites may have low emissivity (Low-e) coatings for mitigating solar heat gains.
Degradation of IGUs is most often associated with edge seal failure, inter-pane gas loss, and breakdown of the low-e coating. These modes of failure occur within the IGU of a window system and can typically be decoupled from thermal bridging and other frame effects. Commercial windows have a life span of 20–30 years compared to the overall 50–60 year life span of a commercial building [10]. Their shorter lifespan, multiple modes of degradation, and large contribution to energy consumption compared to other envelope components highlights the importance of linking window aging to energy performance in the effort to improve the efficiency and energy estimation of buildings.
By understanding the relationship between thermal performance and degradation, building energy modeling and energy estimation can be improved, which allows the building sector to optimize lifetime efficiency and better address retrofit needs. Improvement of retrofitting and investing in the energy efficiency of buildings was found to be the easiest way to reduce associated carbon dioxide emissions [11]. Such investments are linked to positive socioeconomic impacts in communities such as increased employment, improved quality of life, and elevated government revenues. These improvements have the potential to curtail the disparity of underrepresented groups in the housing market while also reducing overall greenhouse gas emissions.
Since the failure modes of interest for this work are not associated with the frame effects, the contents of this paper will focus on background information of IGU durability, performance rating methods, in situ measurement technology, and overall energy impacts. The main objective of this paper is to review existing literature relating to IGU durability, in situ measurement techniques, performance ratings and standards, and overall building energy consumption effects due to IGU performance changes. This paper aims to highlight both the positives and negatives of the existing literature and to establish the remaining needs of these research topics. Analysis of current literature will be used to inform future research methodology to meet larger goals.
2. IGU Durability
2.1. Seal Durability
The durability of a window is its ability to remain functional and perform as designed. Window durability is dependent on the frame and sash, insulating glass seals, and weatherstripping, though there is no simple rating of durability [12]. Figure 3, from NFRC 100, shows the arrangement of a dual-paned IGU.
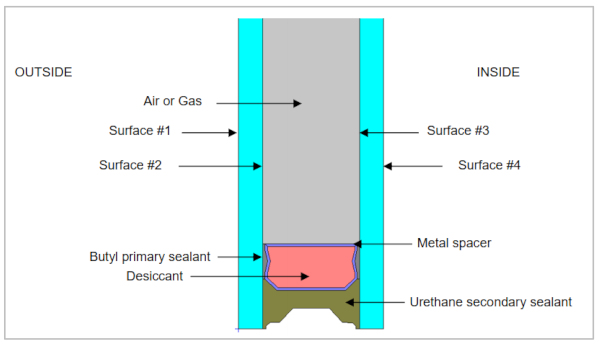
Figure 3 shows an IGU with a dual edge seal system, which became popular in the 1990s due to the demand for longer service life [9]. A dual seal system consists of a “primary” sealant, typically polyisobutylene (PIB), which provides gas retention properties, and a secondary seal of varied polymeric materials that provides structural integrity for the unit. Commonly used secondary sealants include polyurethane, polysulphides, and polysilicones. The spacer, which holds the two glass lites apart, is filled with a desiccant material that is intended to absorb any moisture that enters the edge seal and prevent ingress to the inter-lite gas gap.
The dual seal system of an IGU is of great importance to product durability as it has a notable influence on the gas leakage rate and vapor permeability, which both can reduce the thermal performance of a window [13]. In addition to gas retention concerns, water diffusing in the edge seal can lead to condensation in the inter-pane space, terminating its service life. If the thermal performance of the window degrades rapidly over time, it fails to meet the general criteria as durable.
In the 1990s, Wolf and Waters found that the secondary seal of IGUs played the most important role in IGU life expectancy and durability [14]. The main environmental aging and weathering effects on an IGU and seal are temperature, pressure, sunlight, and oxygen/ozone, as shown in Figure 4 [13].
![Figure 4. Environmental Influences on Aging Process of Insulating Glass [13].](/sites/default/files/inline-images/Fig4_284.jpg)
Both temperature and pressure fluctuations lead to mechanical stress on the edge seal which can affect elasticity and accelerate physical deterioration. Oxygen/ozone exposure can result in the oxidation of the glass sealants and make them more brittle. Sunlight is regarded as the most important aging factor on IGUs due to its thermal and photochemical effects on the edge seal. These aging factors work in tandem during the entire lifecycle of IGUs and can result in seal and glass material degradation. Additionally, low elastic recovery of the secondary seal at high temperatures shortens the service life of IGUs. Wolf and Waters evaluated the effects of temperature on vapor diffusion of 15 insulating glass sealants following DIN 53122.
They assessed the permeability at 20 °C, 40 °C, 60 °C, and 80 °C, and found that the sealants exhibit six to eight times more permeability at 60 °C than 20 °C. This indicates that the sealant will degrade more rapidly in summer months than winter months, even when exposed to high temperatures for a shorter duration. Wolf and Waters also observed that silicone sealant permeability varies less as a function of temperature than those with a polysulphide base, as shown by Figure 5 and Figure 6, indicating that polysilicones may extend the lifespan of sealants and prevent moisture penetration. Note that for Figure 5, sealants labeled with b had no meaningful data obtained.
![Figure 5. Water-vapor Permeability of Insulating Glass Sealants as a Function of Temperature [14].](/sites/default/files/inline-images/Fig5_277.jpg)
![Figure 6. Arrhenius Plot for the Water-vapor Permeabilities of Insulating Glass Sealants [14].](/sites/default/files/inline-images/Fig6_251.jpg)
Wolf and Waters also analyzed eight sealants on premature failure due to adhesion loss following ASTM G-53. All sealants were allowed to cure for six weeks under standard climate conditions before being subjected to accelerated weathering. The accelerated weathering of the sealants consisted of UV light exposure over 1000, 2000, 5000, 10,000, and 20,000 h followed by a weathering cycle of fours of UV exposure at 65 °C, then by four hours of condensation at 50 °C. Finally, specimens were elongated by 25% for 24 h and considered “failed” if they lost more than 10% of adhesion. Results of this test revealed that polysulphide sealants exhibited the poorest resistance to UV exposure and lowest elastic recovery, as shown in Figure 7.
![Figure 7. Influence of Elastic Recovery of the Secondary Sealant [14].](/sites/default/files/inline-images/Fig7_233.jpg)
All testing conducted by Wolf and Waters showed that silicone sealants have a higher life expectancy than polysulphide sealants, and that both the secondary and primary seals play a role in life expectancy. This research is a useful introduction to the main factors that lead to IGU failure and the standardized testing methods used for accelerated aging and durability testing. However, the methods described were all conducted within a lab setting and fail to account for in-field weathering or link to thermal performance.
Wolf continued to study the life-expectancy of insulating glass units by further analyzing the effects of temperature, working loads, sunlight, water, and other conditions on the seal [13]. Although this paper offers an abundance of data and insight into window durability, little methodology is described, making it difficult to expand on or replicate. Like previous works, the methodology also fails to connect to in-field durability and aging of IGUs.
Unlike most durability literature that is typically completed in a lab, Garvin and Wilson used in-field measurements to acquire quantitative data on durability parameters [15]. The main goal of this research was to analyze the potential service life of windows under real conditions given the lack of long-term durability studies. The experiment was set up in a test home in Scotland and took place over two years. Windows of various orientations and constructions were monitored every 30 min on relative humidity of the cavity, temperature of the cavity, and liquid moisture in the edge seal.
The interior room temperature was controlled via heaters while the exterior was exposed to ambient conditions. Humidity results showed that the mean relative humidity in the cavities was highest during winter months and for timber frames, likely due to direct penetration of rain. Temperature readings revealed that the cavity temperatures were a direct reflection of external conditions. Liquid moisture in the edge seal was found to be higher in fully bedded windows than the drained and ventilated frames. A sample of the results for a PVC-U frame is shown in Figure 8.
![Figure 8. Mean Temperature and Relative Humidity for PVC-U P2 Type Window [15].](/sites/default/files/inline-images/Fig8_200.jpg)
At the end of the two-year experiment, the authors stated that all results were interim, and that the results of durability could only be estimated. While conclusive findings on durability have not been met, this paper offers a state-of-the-art method for measuring durability factors in-field. The testing apparatuses and methodology can potentially be expanded on to compare and validate existing durability and accelerated weathering standards to field data.
Another field study conducted by Booth et al. [16] attempted to determine the major environmental impacts on the primary sealant of IGUs. Their work specifically focused on the flow of polyisobutylene (PIB) primary sealant into the space between IGU panes. The study included visual inspection of PIB flow in various IGU assemblies, climates, and orientations. Additionally, Booth et al. completed a photographic survey of each building envelope and measured the surface temperature of IGUs studied. Some IGUs were removed from buildings for further PIB analysis within a lab setting. Results of the in-field inspection showed more PIB flow for south-, east-, and west-facing IGUs. The in-lab study of extracted PIB showed polymer decomposition and viscosity change. The work done in this study demonstrates the degradation of PIB sealants under normal environmental conditions, highlighting the importance of window durability. However, this paper lacks data that can aid in linking durability to overall thermal performance. Additionally, this paper only focuses on one component of IGU durability and fails to analyze elements related to aging and larger impacts.
Asphaug et al. found that aging and degradation of windowpanes can lead to a loss of noble gas concentration within the inter-pane space [5]. Like Wolf and Waters, Asphaug et al. found that the durability of IGUs is primarily characterized by spacer type. Seal failure leads to the loss of insulating gas, such as argon, krypton, xenon, and air, which can increase the U-factor of an IGU up to 32%. Their experiment included 18 IGUs filled with argon gas, nine with super spacers and nine with aluminum spacers. The IGUs were split into three groups with various weathering methods including a climate simulator, a heating chamber, and a combination of the two. The gas concentration of each IGU was measured regularly over a span of 70 weeks and plotted versus time. Results indicated more gas leakage for aluminum spacers and significantly more leakage for all IGUs put in the heating chamber, as shown in Figure 9.
![Figure 9. Gas Concentration Versus Time of the Windowpanes Subjected to Accelerated Aging [5].](/sites/default/files/inline-images/Fig9_178.jpg)
Results also indicated a decrease in U-factor as a function of gas leakage, as provided in Figure 10, but little information is given on how U-factor is evaluated in this study.
![Figure 10. Increasing Center U-value with Decreasing Gas Concentration [5].](/sites/default/files/inline-images/Fig10_150.jpg)
Lastly, a commercial and residential building were simulated to determine the increase in building energy associated with lowered window performance due to aging and loss of insulating gas. The buildings were simulated in a heating-dominated climate for new windows, windows after 70 weeks of accelerated aging, windows with 50% reduction in gas concentration, and windows with 100% reduction in gas concentration. Energy comparisons for each of these conditions were compared for one year and 20 years.
Similar to the gas concentration, little information is given on the overall U-factor of the windows used in each of the simulations. Results of the simulation showed that an increase in heating demand over 20 years due to gas concentration loss would be up to 65 MWh for a typical office building and up to 1.3 MWh for a single-family home. A sample of the results is provided in Figure 11.
![Figure 11. Net Heating Demand, Office Building, Double Layer Glazing [5].](/sites/default/files/inline-images/Fig11_134.jpg)
While this experiment is valuable for determining effects on window degradation and window U-value, it fails to correlate accelerated aging to real-time aging and lacks a robust validation of U-factor measurements. The experiment also uses small window sample sizes without varying orientation or climate, failing to account for real-world conditions. Additionally, the accelerated aging techniques used are not standardized and lead to a question of their validity. The gap between real-world and in-lab results needs to be examined further to relate window durability to other performance factors.
Buddenberg et al. also explored the relationship between climate loads and IGU durability [17]. The goal of their DuraSeal project was to investigate the climate load on sealing in combination with gas loss. Buddenberg et al. began the experiment by exposing ten double pane IGUs and ten triple pane IGUs with varying spacer and seal types to a weathering cycle test outlined by EN 1279. Unfortunately, there are currently no results for vapor and gas diffusion and no updates to this project.
In 1998, Burgess [18] summarized various national standards for IGU durability tests to compare their scientific bases and application. Burgess found that many of these methods use similar assumptions or are extensions of each other, and many lack scientific verification. Burgess outlines and compares ten different standard tests, as shown in Figure 12.
![Figure 12. Standard Test Comparison [18].](/sites/default/files/inline-images/Fig12_112.jpg)
Figure 12 highlights the lack of commonalities between the ten standard tests presented, and these issues expand to more standards not listed in the figure. Because of the variety of testing methods and lack of field validation, there is little agreement on the most appropriate IGU durability test. This further underscores the shortcomings of accelerated aging testing as it relates to actual IGU performance and durability.
Although the soundness of durability testing has been questioned, there are few studies attempting to validate results. Lingnell [19] attempted to address this knowledge gap by conducting a 25-year field study to determine the correlation of observable IGU failure to standardized weathering testing classifications outlined in ASTM E 773. This study began in 1980 and was comprised of over 2400 IGUs across 140 buildings and fourteen cities in the United States of various climates. Failure of IGUs was indicated by visual inspection of seal failure and/or fogging. Units were inspected at the 10-year, 15-year, and 25-year marks, and the total failure rates were calculated as 4.9%, 7.9%, and 9.2%, respectively. Although this research offers a unique perspective of in-field performance that is often overlooked, it fails to link actual IGU failure to standardized weather procedures or provide any quantitative data related to accelerated aging.
Similarly, Gjelsvik [20] conducted several field studies to validate the results of accelerated aging tests following Norwegian standards. Gjelsvik’s most inclusive field test consisted of 2040 IGUs spanning ten different brands and twelve installation years. The field study took place in 1963 and most results in the paper are qualitative. Although Gjelsvik states that the correlation between laboratory tests and field tests is “surprisingly good,” little data is provided to back this claim. This paper highlights the lack of knowledge of durability testing and the difficulties of long-term field testing.
Due to the difficulties of long-term field testing for IGU failure, Pylkki and Doll [21] developed a predictive simulation program to advance IGU durability as designs develop. The simulation is made up of a thermal model, permeation model, and stress model as a response to the environmental stresses on an IGU. The user can assemble an IGU by defining dimensions, coatings, sealant materials, and more. The simulation uses databases for other common parameters such as optical and material properties. Results indicate the distribution of 44 different failure modes and time to failure.
Currently, there is no validation of the simulation tool. Although this tool offers a promising method to expedite the determination of failure modes, it ultimately needs to be validated to real-world IGU failures. This paper again illustrates the need for in-field testing of durability to validate both simulations and accelerating aging standards.
Gubbels et al. [22] conducted a study that examined the thermal conductivity of vacuum insulated panels (VIP) upon accelerated aging. The authors used a climate chamber to cycle VIPs between −20 °C and 80 °C and 10% and 90% relative humidity for 24 h a day and seven days a week. After one week, the panels were taken out of the chamber and the thermal conductivity was measured using a heat flow meter in accordance with ISO 8301. Although the results of this study do not directly pertain to this research, the methodology is useful, and the research work is one of the few to link aging to thermal performance of a transparent construction. The work done by Schwab et al. [23] and Fantucci et al. [24] also considered the effects of durability on thermal performance of VIPs and offer means to expand the methodology of future research in this field.
2.2. Low-e Coating Durability
Another aspect of window durability is the condition of the low-emissivity (low-e) coating. Most low-e windows are comprised of at least one thin, transparent metal film between dielectric layers. The choice of dielectric layers is chosen to optimize durability and protect the metal layer. Silver is most commonly used as the metal layer due to its high infrared reflectance and low light absorbance [25]. The durability of the low-e coating is significant because of the impact solar heat gain coefficient (SHGC) has on building energy efficiency. Like U-factor, a higher SHGC leads to increased heat within the space due to additional solar transmission. This additional transmission increases space loads in summer months, leading to larger equipment requirements and overall higher building energy consumption.
Miyazaki and Ando [26] discuss improving the durability of silver-based low-e coatings. In their study, they investigated the degradation of a silver layer sandwiched between two layers of zinc oxide. The degradation process was comprised of a humidity test at 50 °C, 95% relative humidity for 144 h. After this test, Miyazaki and Ando used electron microscopy, energy dispersive X-ray spectroscopy, and X-ray diffraction to compare to the new sample. They found that the zinc films had a large internal stress under higher gas pressure that was reduced by adding aluminum, as shown in Figure 13.
![Figure 13. Dependence of the Internal Stresses in ZnO Layers on the Sputtering Gas Pressure [26].](/sites/default/files/inline-images/Fig13_101.jpg)
These two methods improved the durability of the overall low-e coating as well. Similarly, Ross [27] studied the effects of humidity-induced degradation of silver-based low-e coatings. Ross completed three experiments to compare the condition of the films before and after induced aging. Experiment one was comprised of low-e films with varied zinc barriers exposed to room temperature, 95% relative humidity for four days over a KCl solution. The other two experiments had samples placed in a chamber at 50 °C, 95% relative humidity for four days and were examined using either optical microscopy or transmission electron microscopy to observe different degradation effects. Ross found that humidity-induced degradation is caused by physical restructuring of the silver layer and not by chemical reaction. Ross also found that degradation was governed by temperature and humidity.
While these works provide useful methodology for aging low-e samples, their focus is more on small-scale physical degradation rather than the effects degradation would have on overall thermal performance factors of IGUs, such as U-factor and SHGC.
2.3. Durability Test Methods
Due to the various environmental influences of an IGU that can lead to seal and low-e failure, such as water/water vapor, temperature fluctuations, and working loads, it is imperative to develop test methods to quantify durability as a function of weathering and aging. Testing and quality standards in the US were first introduced for IGUs in the 1980s [28]. Since then, several different countries have developed their own standards for assessing window durability. However, the accuracy and suitability of many of these methods is unknown [18]. Many test methods have been industry tests self-developed to ensure occupant comfort and extend window life with limited focus on thermal performance. Other testing methods focus on a singular issue, such as moisture ingress to the gas gap between the panes, which ignores the synergistic quality of weathering effects and hinders the overall testing purpose [18].
Most test methods, including ASTM E 2188, artificially induce weathering and analyze the moisture content of sample IGUs but do not account for natural exposure. While inducing artificial weather effects can give a good idea of its influence on window aging and durability, it does not fully reproduce real-world conditions and overlooks certain impacts. Artificial conditioning typically involves accelerated weathering tests of cyclical symmetric or asymmetric heating, cooling, and water spray where the temperature of the sample is cycled from high to low. In addition, UV illumination is used to induce chemical degradation of edge seal materials at certain parts of the thermal cycle. However, these tests and their scientific verification have been disputed [18] and there is little understanding of how realistic they are [29]. Because of the abundance of methods with various goals, there is little agreement on the main drivers of IGU failure or the best standard for quantifying window durability [18].
3. Thermal Performance
3.1. Performance Rating Methods and Simulations
An understanding of thermal and optical performance is necessary to determine the overall impacts aging and durability have on IGU life expectancy. The performance of an IGU can be broken down into three major components: thermal conductivity (U-factor), solar heat gain coefficient (SHGC), and visible light transmittance (VLT). U-factor and SHGC represent the thermal performance of a window by defining the conductive and radiative heat transfer, respectively. The VLT of a window is related to visual comfort and is the measurement of the amount of visible light passing through the glass.
Laboratory-based thermal performance standards are used to confirm that IGUs behave as intended before installation. One standard for measuring window U-factor is ASTM C1199-14. This standard covers the process and calibration required to measure the steady-state thermal transmittance of fenestration systems in a lab setting. Figure 14 shows the testing setup required for ASTM C1199-14 and highlights its complexity and large size.
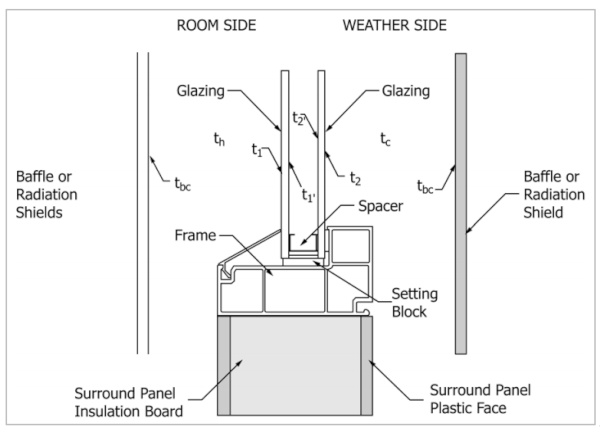
ASTM C1199-14 requires that all testing be done with a standard specimen size and extrapolate results for any other sizes; this hinders the real-world application of the test method since window size varies over all building types. The standard does not account for thermal bridging or radiation effects, which are major factors in the performance and durability of windows in the field. Because of these drawbacks, the standard itself states that “results obtained do not reflect performances that are expected from field installations,” leading users to question the practicality of the results obtained from the standard.
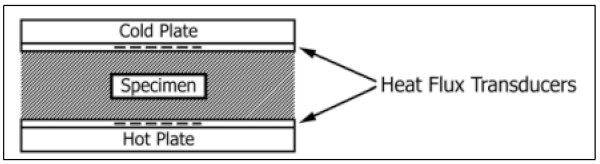
ASTM C518-21 is a standard test method for steady-state thermal transmission through flat slab specimens using a heat flow meter apparatus. This standard can be applied to any material, including glass samples. Steady-state one-dimensional heat flux through a specimen is generated through two parallel plates. Fourier’s law of heat conduction is used to calculate thermal conductivity based on the heat flux and plate temperature measurements. This method offers a quick and easy way to measure thermal properties of window samples using a heat flow meter; however, the testing apparatus is typically large and cannot be used in the field. Figure 15 shows a typical assembly using two heat flux transducers and one specimen.
Simulation tools are also used for estimating and confirming the thermal performance of windows and IGUs. One of the main simulation tools for quantifying IGU performance is WINDOW 7.8. This follows simulations methods covered in NRFC standards and is used for industry certification. Advanced heat transfer simulation tools such as those based on finite element and finite difference method are also available, although they often require more assumptions and inputs, and usually cannot predict unsteady long-term performance due to computational complication and costs. Simulations are convenient but cannot be relied on alone to produce a systematic representation of real-world performance.
3.2. Thermal Performance Measurement In Situ
As noted in the previous section, existing standards take place within laboratory settings and use specific sample sizes that do not reflect the actual conditions of windows and building elements in the field. Because of this, accurate measurement techniques have been increasingly studied to determine the legitimacy of using real-time techniques in-field for more accurate and representative thermal performance. The thermal characterization of building components can be determined through several methods as outlined by Soares et al. [30]. The first method discussed for measuring U-factor is the heat flow meter (HFM) method, as it is the most widely used technique. This method is internationally recognized as ISO 9869-1, is non-invasive and lightweight, and can be used in both a lab setting and in situ.
However, the measurement is time-consuming, dependent on calibration, and expensive, and does not consider the entire surface of the element measured. The evaluation of the U-factor based on this method can be determined using the average method or the dynamic method. The average method assumes the conductance can be determined by dividing the mean density of heat flow rate by the mean temperature difference over a long enough period. For the dynamic method, the building element is represented in a model by its conductance and several time constants which are solved using a given set of algorithms.
There is extensive literature comparing the two methods, with the consensus that the dynamic method is more accurate but much more intensive than the average method. The next method discussed is the guarded hot plate method (GHP). This method is accurate but requires a large and expensive test rig. Next is the hot box (HB) method. Like the GHP, the testing rig is too large and not suitable for in-field measurements. The last method examined is the infrared thermography (IRT) method. This method is non-destructive, flexible, lightweight, quick, and considers whole surfaces of the object measured. The drawbacks of this method are the high cost, steep learning curve, dependency on weather, and mixed results for use on transparent constructions.
3.2.1. Heat Flux Meter Method
The heat flux method is outlined in ISO 9869-1. Unlike ASTM C518-21, this method can be used in field and allows for a small, portable testing apparatus. ISO 9869-1 outlines the procedure for measuring the thermal resistance of building elements assuming steady-state conditions. The apparatus is made up of a heat flow meter and temperature sensors. The heat flow meter is typically a thin plate that measures the heat flux through a construction sample. The temperature sensors are typically thermocouples placed to measure both surface and ambient temperatures. ISO 9869-1 offers a simple and robust method for measuring thermal performance but requires long testing times to reach steady-state and must be completed under ideal weather conditions. This method is typically used on opaque constructions and its reliability for use on windows is still being discussed.
A study was conducted by greenTEG to determine if their gSKIN U-value kit, typically used for U-factor measurements of opaque building components, could be applied to windows [31]. The gSKIN U-value kit showed acceptable standard deviation criteria (per ISO 9869-1) of wall U-factor measurements of 2.8% for south-facing walls. The same heat flux setup described in ISO 9869 was then repeated for a 50 cm by 90 cm window on the south side of a test home. The heat flux sensor was attached to the interior side of the window with two temperature sensors on the interior and exterior, 3–5 cm away from the window surface. This setup is shown in Figure 16.
![Figure 16. gSKIN Measurement Setup [31].](/sites/default/files/inline-images/Fig16_58.jpg)
Three night-time measurements were taken over several hours with stable weather conditions to negate the effects of wind and solar radiation and evaluated using greenTEG software. Graphs of these measurements are provided in Figure 17.
![Figure 17. Results of Three Nighttime Measurements [31].](/sites/default/files/inline-images/Fig17_41.jpg)
Results calculated from the measurements gave an average U-factor of 2.10 W/m2K and a standard deviation of 3.1%. The range of U-value and standard deviation results are within the acceptable criteria outline in ISO 9869-1. The test was repeated during the day with unreliable results because of solar radiation and transmittance. Because of this, the author suggests taking all measurements during the evening after the sun has set. This work offers promising results for an easy and precise method to measure window U-factor in-field.
However, the testing was repeated for only a south-facing window for three nights without mention of measurement intervals. To ensure accuracy, this testing method should be repeated over several nights with higher resolution for various window types, sizes, and orientations. This paper also does not describe the calculation method used for U-factor and it is assumed the average method per ISO 9869-1 is used. This could lead to potential inaccuracies of the U-factor due to the lack of steady-state conditions caused by weather such as wind and temperature fluctuations.
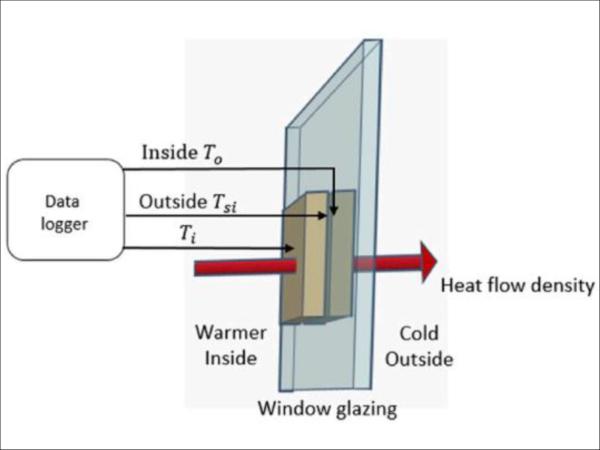
Feng et al. [32] developed their own accessible in situ measuring system of building windows based on the fundamentals of the heat flux method and ISO 9869-1. Feng et al. used two 3D-printed objects made of acrylonitrile butadiene styrene with known thermal properties, three temperature sensors, and a data logger as their measurement setup, as shown in Figure 18.
![Figure 18. Typical Measurement Setup [32].](/sites/default/files/inline-images/Fig18_35.jpg)
The thermocouples in Figure 18 measure inside air temperature, outside air temperature, and inside surface temperature. They assumed steady-state so that the heat flux through the 3D-printed object and window could be equal, and the equations simplified. By doing so, they were able to estimate the center-of-glass U-factor of the window based on three temperatures and the R-value of the 3D object. The three temperatures were processed every second by a micro-controller and plotted versus time over several hours in the evening to avoid solar radiation effects. Three measurements with various outdoor conditions were taken on a double-pane window with a manufacturer U-factor rating of 2.97 W/m2K.
The first measurement took place with an indoor temperature of 24.1 °C and outdoor temperature of 6.3 °C. It took 35 min to reach steady-state and the measured U-factor was 3.15 W/m2K, a 6.1% error compared to the known value. The second measurement took place with an indoor temperature of 23.7 °C and outdoor temperature of 8.4 °C. It took 35 min to reach steady-state and the measured U-factor was 3.26 W/m2K, a 9.8% error compared to the known value. The third measurement took place with an indoor temperature of 23.8 °C and outdoor temperature of 18.2 °C. It took 40 min to reach steady-state and the measured U-factor was 2.32 W/m2K, a 21.6% error compared to the known value. Figure 19, Figure 20 and Figure 21 show the results from each measurement.
![Figure 19. First Measurement [32].](/sites/default/files/inline-images/Fig19_27.jpg)
![Figure 20. Second Measurement [32].](/sites/default/files/inline-images/Fig20_25.jpg)
![Figure 21. Third Measurement [32].](/sites/default/files/inline-images/Fig21_23.jpg)
Feng et al. [32] found that the measured U-factor is most accurate when there is at least 15 °C temperature difference between indoor and outdoor conditions. This experiment offers an HFM method that is cheap and accessible. It follows the procedure of ISO 9869-1 and produces promising results for measuring U-factor in situ when conditions are optimal. It should be noted that no frame/thermal bridging affects are accounted for, leading to simplified results.
Ficco et al. [33] present their methods and results of assessing the performance of various HFM methods to evaluate the influence of outdoor conditions. Their main goal is to compare U-factor results of the typical ISO 9869-1 method to in situ results where outdoor conditions play a role. The authors assume mono-dimensional and steady-state conditions to simplify equations and use the HFM method as outlined in ISO 9869-1. They used four different heat flux sensors of various shapes, sizes, and accuracies on seven different envelope components, with one transparent construction being of particular interest. The test for the window sample was conducted in the winter for four different sample durations: 3 h, 6 h, 9 h, and 12 h. All sample durations had a measurement frequency of 15 min. This measurement was conducted according to ISO 9869. The measured U-factors were compared to known values determined through three methods bulleted below:
- Method 1: estimation based on data obtained by historical analysis of buildings;
- Method 2: estimation based on nominal design data;
- Method 3: estimation based on structure identification via endoscope method.
The authors found method one to be unreliable and thus scrapped it from their results. Their results for the window sample show a range of accuracy for each test and each heat flux meter. They averaged the results for each sample duration and found the U-factors to be 3.19 W/m2K, 3.2 W/m2K, 1.81 W/m2K, and 3.16 W/m2K for four different HFM measurement techniques. These are compared to the known U-factor of 3.3 W/m2K. A box-and-whisker plot of these in situ values, along with U2 and U3 values measured in-lab and their uncertainties, is provided in Figure 22.
![Figure 22. Comparison between in situ U-values [33].](/sites/default/files/inline-images/Fig22_21.jpg)
Their results found that lightweight components, such as the window, resulted in reduced uncertainties with shorter sampling times compared to heavy components. This research again shows promise in using the HFM in situ but encourages rigorous U-factor uncertainty estimations and post-processing to achieve accurate results. Similar to the previous work, Ficco et al. used the average method to calculate the U-factor, which is less accurate than the dynamic method.
Overall, the literature shows that the HFM method can be reliable for determining IGU U-factor under proper conditions. These conditions include, but are not limited to, no solar interactions, low wind velocity, and long testing times to reach steady-state. Additionally, current research found that the dynamic method for calculating U-factor is more accurate than the average method and allows for shorter testing time in-field. The HFM method offers a portable and non-destructive approach for determining IGU and window U-factor in situ.
3.2.2. Infrared Method
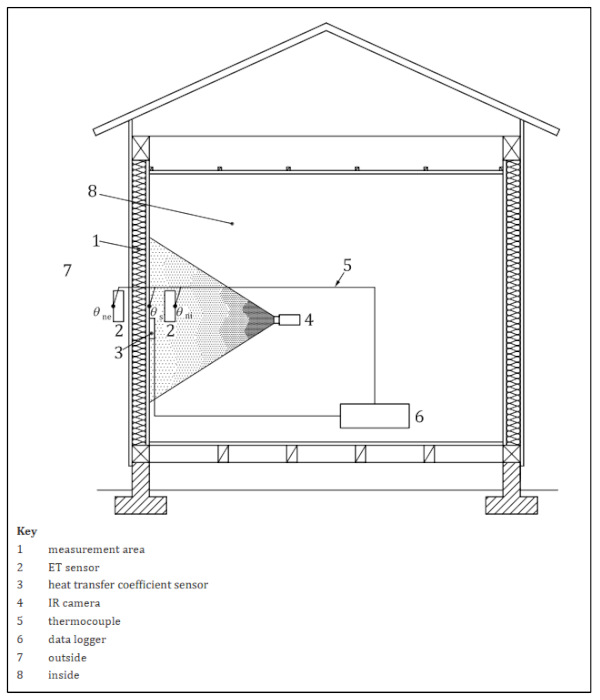
Another promising method for measuring window U-factor in situ is the infrared method. The apparatus consists of an infrared camera, heat transfer coefficient sensor, ET sensor, and thermocouples. This method measures the amount of irradiance of regions in contact with outside air from the surface temperature, total heat transfer coefficient, and ambient temperatures. Compared to the heat flow method, infrared offers shorter testing time, more flexibility of measurement area/location, and less interference with building constructions. The infrared method is outlined in ISO 9869-2 for opaque envelope constructions and results on accuracy for transparent constructions is mixed.
An example of the testing apparatus is provided in Figure 23. ET sensors are used to measure environmental temperature of the regions of the object to be measured, and the heat transfer coefficient sensor is used to estimate the total heat transfer coefficient of the surface to be measured. Thermocouples are arranged to measure inside air temperature, outside air temperature, and at least one surface temperature. The main component of the setup is the infrared camera which captures a thermal image of the surface.
Maroy et al. [34] evaluated the potential of using infrared technology (IRT) in determining the thermal performance of IGU’s following ISO 9869-2 guidelines. The researchers began by performing a sensitivity analysis to understand under which conditions steady-state could be fulfilled based on solar irradiation, wind velocity, clear sky conditions, and temperature gradient. Results of the sensitivity analysis show that steady-state may be achieved under the following boundary conditions: fully clouded sky (or nighttime) and at least 15 °C temperature difference between outside and inside temperatures. In the next step, the authors examined the IRT measurements and U-factor calculations in a laboratory setting and compared to thermal resistance based on heat flux measurements and EN673 methods.
The authors used a heated box to maintain a 20 °C temperature difference across a glass sample. The inside was coated black to avoid reflectance and the heat transfer coefficients were determined based on temperatures alone since no wind was present. Heat flux sensors and temperature sensors were placed inside the box and on the surface of the glass specimen to be used in U-factor comparisons to IRT methods. The thermal resistance values using IRT method were calculated using two different convective heat transfer coefficient (CHTC) methods. The first method used an equation based on natural convection and underestimated the total resistance value. The second method derived internal CHTC from the measured heat flux, which led to better accuracy but is often inaccessible in situ.
Next, the authors performed four in situ cases of various types of glazing. They found that the deviation between IRT surface temperature and the temperature sensors was larger in situ than in the lab due to effects of specular reflection. Results of the in situ cases indicate high sensitivity to the internal and external heat transfer coefficients and outdoor air temperatures. Figure 24 shows the results of resistance values for Case 3 (triple glazing with argon). This figure shows the high variation of measured R-values (shown as black, orange, and green squares) compared to a known value (black line).
![Figure 24. (a) Resistance Calculation for location 1 and (b) Resistance Calculation for location 2 for Case 3 Sample [34].](/sites/default/files/inline-images/Fig24_9.jpg)
Maroy et al. [34] conclude that while IRT can be used for qualitative analysis of insulating condition, it should not be used to estimate actual thermal resistance/U-factor. Further, the authors highlight the importance of ideal conditions during IRT inspection, such as cloudy weather and at least 15 °C temperature difference between indoor and outdoor spaces.
Varshney et al. also presented a novel technique to measure the U-factor of windows on site using IRT [35]. For their in-field measurements, Varshney et al. analyzed both residential and commercial buildings with various window types. All in-field temperatures were measured with an IR thermometer except for the exterior window surface temperatures for multi-story buildings. Due to the height, the reading of the IR camera was inaccurate, so a K-type thermocouple connected to the IR camera was used instead. U-factors at various locations on ten different windows were calculated using an equation provided by NFRC as a function of multiple interior and exterior temperatures. The authors compared the in-field U-factor measurements to those of lab U-factor measurements to develop a correction factor based on outdoor temperature. This corrected U-factor equation is used for all future in-field measurement analysis in their study. Results of their measurements showed that all lab-measured U-factors were within 10% of the NFRC rated values.
This paper offers promise for using IRT on windows in the field; however, the research is lacking certain information regarding detailed results values, sampling time, conditions, window orientation, weather, etc.
Park et al. used ISO 9869-2 as a basis for determining the accuracy of infrared for measuring window U-factor [36]. In this paper, the authors measured U-factor of a window sample using the KSF 2278 performance evaluation standard, the heat flow method, and the IR method. The IR method was repeated for two cases; case one applies a surface coefficient of 9.09 W/m2K per the Korean energy-saving design standard and case two applies a surface coefficient of 7.69 W/m2K per ISO 6946. All cases were compared to KSF 2278 to determine their accuracy. KSF 2278 requires a large testing apparatus that creates hot and cold conditions across a testing sample. The U-factor is calculated based on chamber temperatures, chamber heat supplied, surface heat transfer resistance, and sample area.
The HFM method used by the authors consisted of measuring internal, external, and surface temperatures and heat flux using a heat flux sensor and T-type thermocouples. A heat flux sensor was attached to the glass sample at the center, corners, and frame; the average U-factor was calculated based on an area weighted average of each measured value. The authors also used the average method for calculating U-value based on heat flux and temperature after the sample reached steady-state. For the IR method, a black body was created to correct for emissivity and reflectance, then the surface temperature of the actual window sample was taken. The U-factor was evaluated based on the measured surface temperature and surface coefficient using either case one or case two mentioned above. Results showed that the relative errors for the HFM, IR case one, and IR case two are 5.9%, 3.05%, and 11.81%, respectively. Boxplots of these results are given in Figure 25, Figure 26 and Figure 27.
![Figure 25. Boxplot of U-value Results Using HFM Method [36].](/sites/default/files/inline-images/Fig25_8.jpg)
![Figure 26. Boxplot of U-value Results Using IR Case 1 [36].](/sites/default/files/inline-images/Fig26_5.jpg)
![Figure 27. Boxplot of U-value Results Using IR Case 2 [36].](/sites/default/files/inline-images/Fig27_2.jpg)
This study offers promising results for both HFM and IRT on windows in-lab but fails to repeat the procedure in situ. All testing was done within a lab with stable conditions, indicating the results could be inaccurate when conducted outdoors. Additionally, the difference in accuracy due to the surface coefficient estimation suggests the need for this study to be repeated under specific conditions.
Similarly, Lu and Memari [37] evaluated the effectiveness of infrared thermography by validating against results of the HFM method. Lu and Memari used the MorningStar Solar house as their building for in situ measurements. They began by installing temperature, humidity, and heat flux sensors to produce results following the HFM method. The authors compared the HFM results to five different IRT models. The HFM, or baseline, average R-value was measured to be 1.372 m2K/W. The results for Garg’s, Berger’s, Clark’s, Bliss,’ and Melchor’s models were 1.237 m2K/W, 1.014 m2K/W, 1.241 m2K/W, 1.170 m2K/W, and 1.110 m2K/W, respectively.
The authors conclude that all proposed IRT methods are within acceptable error to the HFM method, with Garg’s model and Clark’s model performing best. This study provides more detail on sky temperature and heat transfer coefficients and shows encouraging results for using IRT in the field. However, this paper uses the HFM as its validation which is a cause for concern since there are inherent inaccuracies within the HFM methodology. Results should also be validated with manufacturer ratings and/or more standardized U-factor measurement techniques to further corroborate findings.
Current literature has mixed results on the accuracy of the IRT method for measuring U-factor. This arises from the difficulty of measuring heat transfer coefficients which play a major role in the thermal performance of all envelope components. Most work attempts to validate the IRT method on its own; however, there is a lack of methodology that combines the HFM method with the IRT method.
3.2.3. SHGC Measurement Method
Another thermal performance metric for transparent building components is the solar heat gain coefficient (SHGC). SHGC represents the fraction of solar heat that can pass through a window into a space. The SGHC coefficient adds a thermal load to the space, increasing the cooling required in the warm months, but reducing the heating required in colder months. The SHGC can be altered using different coatings on the window glass, such as low-e, and through implementing shading devices/natural shadings.
Marinoski et al. [38] presented a study on an improved system for measuring the solar heat gain through fenestrations. Their test setup consisted of clear glass measuring 21 cm by 21 cm within a fenestration radiometer protype consisting of cooling fans, heat flux meters, and a support system as shown. A photo of the actual setup is shown in Figure 28.
![Figure 28. Front View of Fenestration Radiometer Prototype [38].](/sites/default/files/inline-images/Fig28_2.jpg)
The incident solar radiation intensity was measured with a global pyranometer placed on the same plane as the glass sample. The measured Solar Factor using the radiometer was calculated by dividing the heat flow density through heat flux sensors by the incident solar radiation density on the sample. The main test developed heat flux meter calibration constants to improve results of the Solar Factor measurement. Results from the calibrated setup show that the measured Solar Factor was within 5.4% variation of the reference values calculated using ISO 9050.
The final test used a water circulation cooling system instead of the original fans to improve the cooling of the heat flux meters. Results when using a water circulation cooling system show that the measured Solar Factor was within 0.94% variation of the reference values calculated using ISO 9050. This paper shows promising results for accurately measuring the SHGC of window specimens compared to a calculated reference value. However, the current prototype cannot be used on installed windows due to the specimen size requirement and protype configuration. This paper offers a good beginning methodology that can be applied to a new system that can be used in situ more easily.
3.3. Thermal Performance Shortcomings
While standards and simulations are useful to confirming as installed performance, in situ performance measurement is necessary to determine how IGUs behave over time. Measuring the thermal performance of existing IGUs and windows in-field becomes even more complicated because of space constraints, environmental effects, and lack of information on installed windows. Current standardized test methods for measuring thermal performance of IGUs require large testing apparatuses with specific sample sizes. These existing test methods are invasive and cannot be applied to existing buildings without demolition of the envelope.
However, there are promising methods for measuring U-factor in situ including portable heat flux meters and the infrared method. greenTEG’s gSKIN kit uses the heat flux meter method, which is portable and easy to use, but is heavily dependent on the outdoor conditions. Similarly, results from using IR technology show dependence on conditions such as temperature, sunlight, and wind [31]. The research conducted using both the heat flux and IR methods does not account for other factors such as location, size, or age. Though these methods show promise for measuring performance in field and are a good starting point, further investigation and verification are needed to determine the legitimacy of measuring U-factor in situ.
Methods for measuring SHGC in situ are being pursued by Marinoski, Güths, Pereira, and Lamberts [38]. Like U-factor measurement techniques, these methods require ideal conditions and additional analysis to determine if the methods are reliable in-field. Neither U-factor nor SHGC measurement techniques consider the interrelated nature of various failure modes. U-factor measurements and SHGC measurements alone cannot distinguish the main cause of performance degradation within an IGU. It is necessary to develop a reliable and accessible method to measure IGU performance in the field as it relates to IGU durability and overall performance for existing buildings.
Although lab testing is beneficial for determining as installed performance and comparing to other products, it is not as flexible or robust as in situ measurements. IGU durability is a factor of age and weather conditions which cannot be entirely replicated in the lab; real-world and real-time measurements are needed to accurately link durability to thermal performance. It is much more difficult to perform thermal characterization of windows of existing buildings since the material properties are often unknown [22]. Because of this, in situ measurement methods are also needed to measure U-factor and assess the low-e coating of existing windows to address retrofit needs. A new method which can also differentiate performance changes due to both gas loss and low-e coating deterioration is needed to best understand the link between degradation and performance.
4. Energy Impacts
Since windows are the weak point of the building envelope, their performance is of the utmost importance to overall building energy consumption. Both durability and thermal performance of IGUs can lead to increased loads within a space; these effects trickle down to all building components and ultimately lead to increased building energy requirements and cost.
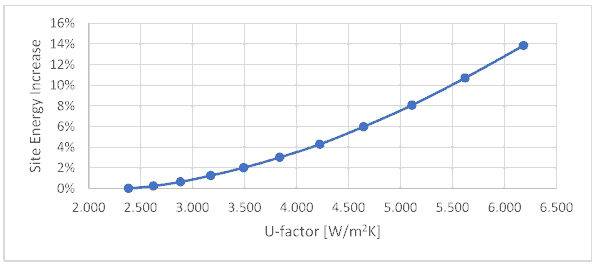
Ratings and simulations do not account for window durability or aging effects, leading to an underestimation of annual building energy consumption of up to 14% per building based on a black-box model of a typical office building located in Denver, as shown in Figure 29.
Duan et al. [39] consider the effects of condensation in low-e windows on overall building energy use. Duan et al. point out that inner glazing surfaces with added low-e coatings are colder than those without and may increase the risk of condensation. Condensation within the panes of an IGU leads to reduced energy performance and cascades down to all equipment in the building. The authors of this paper chose to focus on condensation because no prior study considered whole-building impacts. The authors extended the Nusselt film-wise condensation model to validate their own analytic model.
They then created a series of building energy use comparisons within EnergyPlus. The authors found that low-e films on single pane windows are not suitable for colder climates due to condensation effects. Figure 30 shows the difference in annual heating energy savings with and without considering condensation effects applied to retrofitted windows. It reveals that there can be a loss of savings in climate zones 5–7 when condensation is considered.
![Figure 30. Annual Heating Energy Use and Associated Energy Savings Trends [39].](/sites/default/files/inline-images/Fig30_3.jpg)
This paper offers a good guide on energy modeling methodology and how to assess overall building energy consumption due to changes in window performance metrics. However, this paper fails to evaluate condensation effects in-field and relies only on models and numeric analysis.
Yoo et al. [40] measured the U-factor of different windows and analyzed their effects on energy savings to determine certification qualification in various regions in South Korea. They used a combination of lab testing and energy modeling to determine that revision of the current certification system in South Korea is needed. While this paper offers insight into the bigger picture of building energy consumption and building codes, it does not consider the main drivers of window or other envelope component degradation. More work needs to be done on an individual scale to determine when retrofit is needed to improve overall building energy performance.
There is extensive literature pertaining to whole-building energy consumption due to various envelope and equipment changes. However, most research focuses on modeling large changes without in-field analysis or focuses on individual metrics, such as IGU durability. More work is needed combining in-field measurement techniques with whole-building modeling to better understand the most important degradation parameters. This understanding can lead to more robust retrofit analysis and optimization of existing building performance.
5. Conclusions
Existing IGU durability research and literature lack correlations between low-e durability, seal failure, and thermal performance. Additionally, few methodologies fully assess and confirm standardized weathering procedures to in-field aging. There is also a lack of validation within current weathering standards, leading to skepticism that the methodology accurately represents what is happening in the field. Further, this inhibits one’s ability to evaluate durability in the lab and develop relationships between other IGU performance parameters. As for in situ measurement techniques, existing methods for quantifying U-factor can be accurate; however, these methods fail to decouple IGU performance components, such as gas fill and low-e coating performance.
IR results are mixed and there is a noticeable lack in research on low-e measurement tools that can be used in situ. A new method which can differentiate performance changes due to both gas loss and low-e coating deterioration is needed to best understand the link between degradation and thermal performance. Additionally, more work is needed to combine measurement techniques with whole-building energy analysis to better understand the most important degradation parameters. This understanding can lead to more robust retrofit assessment, optimized existing building performance, and improved energy modeling predictions.
Author Contributions
Conceptualization: M.L.-W., Z.Z. and R.C.T. All authors have read and agreed to the published version of the manuscript.
Funding
This study is partially funded by the BEST Center, an industry research cooperative research center established under US NSF Grants No. 213874 and No. 2113907.
Data Availability Statement
No new data were created or analyzed in this study. Data sharing is not applicable to this article.
Acknowledgments
This study is partially funded by the BEST Center, an industry research cooperative research center established under US NSF Grants No. 213874 and No. 2113907. The authors would like to thank Marc LaFrance of the U.S. Department of Energy for his ongoing support of this work. This work was authored in part by the National Renewable Energy Laboratory, operated by Alliance for Sustainable Energy, LLC, for the U.S. Department of Energy (DOE) under Contract No. DE-AC36-08GO28308. Funding was provided by the U.S. Department of Energy Office of Energy Efficiency and Renewable Energy Building Technologies Office. The views expressed in the article do not necessarily represent the views of the DOE or the U.S. Government. The U.S. Government retains, and the publisher, by accepting the article for publication, acknowledges that the U.S. Government retains, a nonexclusive, paid-up, irrevocable, worldwide license to publish or reproduce the published form of this work, or allow others to do so, for U.S. Government purposes. This research was performed under an appointment to the Building Technologies Office (BTO) IBUILD- Graduate Research Fellowship administered by the Oak Ridge Institute for Science and Education (ORISE) and managed by Oak Ridge National Laboratory (ORNL) for the U.S. Department of Energy (DOE). ORISE is managed by Oak Ridge Associated Universities (ORAU). All opinions expressed in this paper are the author’s and do not necessarily reflect the policies and views of DOE, EERE, BTO, ORISE, ORAU, or ORNL. ORISE is managed by ORAU under DOE contract number DESC0014664.
Conflicts of Interest
The authors declare no conflict of interest.