Dr. Romain Decourcelle (1)
Guillaume Kaminski (2)
Francis Serruys (3)
(1) Saint-Gobain Glass France – CRDC
(2) Eckelt Glas GmbH
(3) Saint-Gobain Building Glass Europe
Abstract
Although anisotropy is inevitable when heat treating glass a major breakthrough took place in the industry in 2016 by developing an on-line anisotropy visualisation equipment.
The result is an on-line equipment capable of visualizing and quantifying the level of anisotropy of each single heat treated glass based on the photo-elastic theory. This allows a scientific way of quantifying the level of anisotropy.
The use of this method to evaluate the level of anisotropy of each single heat treated glass allows also to guarantee the consistency of the produced glass with an approved mock-up glass in case of an architectural project.
1.Introduction
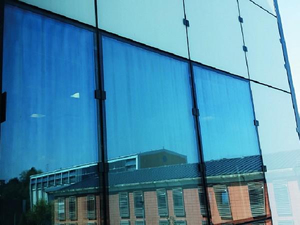
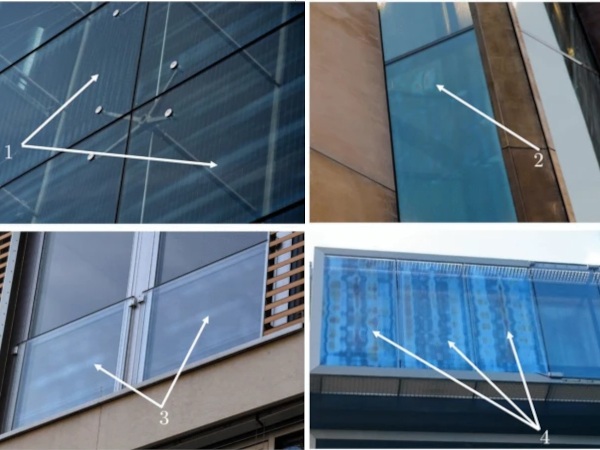
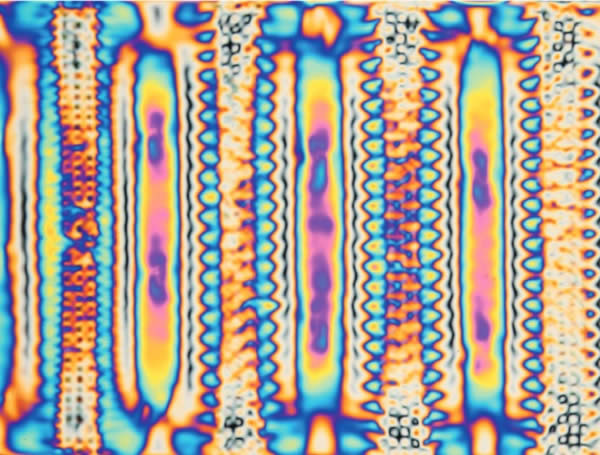
Anisotropy as shown in Figure 1 is also called ‘iridescence’ or ‘leopard spots’ or ‘toughening marks’ or ‘quench marks’ or ‘Brewster Marks’ or ‘strain marks’.
The European Standard EN 12150 Glass in building – Thermally toughened soda lime silicate safety glass [1] [2] [3] describes anisotropy as follows:
9.2 Anisotropy (iridescence)
The toughening process produces areas of different stress in the cross section of the glass. These areas of stress produce a bi-refringent effect in the glass, which is visible in polarised light. When thermally toughened safety glass is viewed in polarised light, the areas of stress show up as coloured zones, sometimes known as ‘leopard spots’.
Polarised light occurs in normal daylight. The amount of polarised light depends on the weather and the angle of the sun. The bi-refringent effect is more noticeable either at a glancing angle or through polarised spectacles. The phenomenon is a natural, physical property of toughened glass and cannot be eliminated.
And the ASTM C1048 – 12 Standard
Specification for Heat-Strengthened and Fully Tempered Flat Glass [4] defines anisotropy as: 7.4 Strain Pattern—A strain pattern, also known as iridescence, is inherent in all heatstrengthened and fully tempered glass.
This strain pattern may become visible under certain lighting and other conditions. It is a characteristic of heat-treated glass and should not be mistaken as discoloration, non-uniform tint or color, or a defect in the glass. The strain pattern does not affect any physical properties or performance values of the glass.
A visualization method has been developed allowing to improve the homogeneity of the heating and cooling of the glass during the heat treatment process by modifying the settings of the tempering oven parameters hence decreasing the stress differentials in the glass.
A quantification based on the photo-elastic theory will allow to calculate the optical retardation. The result of the calculation will not only allow to better compare the overall anisotropy appearance of each single heat treated glass but also to specify the level which shall be reached.
2. Glass processing and anisotropy
Anisotropy is the inevitable consequence of the heat treatment process in order to obtain heat strengthened glass (HS) or thermally toughened safety glass also called fully tempered (FT) glass. This heat treatment process can be split into 3 parts i.e.
A/ The heating up of the glass in a furnace till a temperature of approximately 680°C
B/ Followed by the more or less sudden cooling of the glass in the quench in order to introduce stresses into the glass
C/ Cooling down
The process shall be controlled in such a way that the heating and cooling of the glass will be as homogeneous as possible.
The oscillation of the glass during the first phase of the cooling in the quench is critical. An optimised cooling process shall be determined taking into account the cooling rate (HS or FT) and possible oscillation path. The oscillation path is determined by the dimensions of the glass and the length of the cooling zone or quench.
As the length of the quench is fixed and as the cooling rate for obtaining heat strengthened glass is lower compared to fully tempered glass, heat strengthened glass will show more anisotropy than fully tempered glass.
The same reasoning can be made for thicker heat treated glass i.e. the thicker the glass the longer it will take before the glass reaches a temperature below the glass transition temperature. Consequently the thicker the glass the higher the risk of having visible anisotropy. The level of anisotropy is fixed once the heat treatment has been done.
3. Measures to control anisotropy
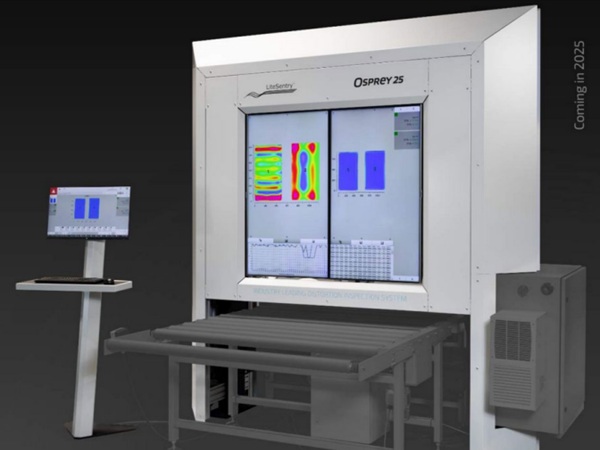
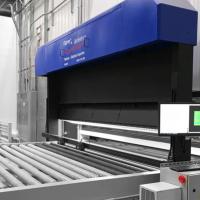
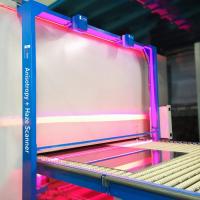
The optimisation of the heat treatment process can be evaluated by checking the level of anisotropy after the heat strengthening or tempering process. Ideally this is done for each glass pane. Therefore an on-line inspection equipment has been developed allowing to visualise the anisotropy of each pane coming out of the tempering equipment.
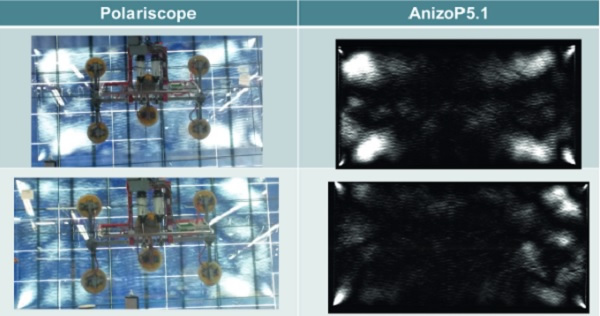
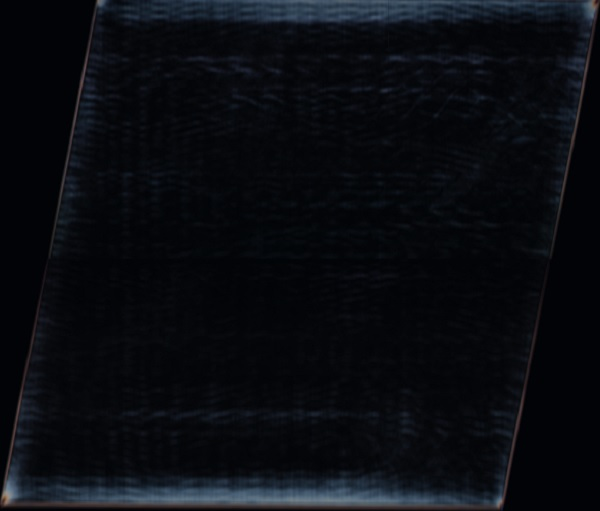
It was important that at first the on-line inspection gave exactly the same information as the picture obtained with the off-line equipment allowing to check the quality of the picture acquisition. Figure 2 shows the comparison between the pictures obtained with a polariscope off-line equipment versus the pictures obtained with an on-line visualisation equipment.
4. Acquisition of on-line anisotropy pictures
Many parameters are influencing the visualisation of anisotropy. The most important parameters are the type of light used – monochromatic light or white light – and the kind of polarising filter i.e. a linear or circular polaroid filter.
4.1. Isoclinics
A beam of polarised light entering heat treated glass will be split into two principle axes as glass is subject to stresses after the heat treatment and consequently is behaving as a bi-refringent material.
The principle axes are perpendicular one to the other and the light waves will travel at different speeds through the material hence one will be retarded with respect to the other when travelling through the heat treated glass.
This retardation results in a phase difference between the two waves when exiting the glass. If there is no phase shift, the screen will be black as the components will eliminate each other.
However the screen will also be black if the direction of polarisation coincides with one of the principle stress axis as the polarised light entering the glass will not be split although a non-homogeneous stress state may exist in the glass.
These fringes, called isoclinics, are showing the points where the direction of the principal stress is the same but are independent of the magnitude of the stress. Consequently, isoclinics will not give any information related to the appearance of anisotropy.
4.2. Circular polariscope
When monochromatic light is passing through a linear polariser, heat treated glass and a linear analyser which is at 90° to the polariser, two different fringes can be seen i.e. isoclinics and isochromatics.
As isoclinics are not giving valuable information with respect to the appearance of anisotropy a circular polaroid filter shall be used. This optical arrangement will eliminate the isoclinics and keep the isochromatic fringes. These fringes may be considered as the location of all points having the same difference in principal stress.
Eliminating the isoclinic fringes means that there is no distinctive direction for the polarised light beam. This is in opposition to the use of a linear polaroid filter where the light intensity changes with the orientation of the axis of polarisation (i.e. light intensity of the observed pattern will be maximised at a phase shift of half a wavelength).
4.3. White light
White light is made up of many wavelengths. If such a light source is used in combination with a circular polaroid filter, a pattern of multi-coloured isochromatic fringes will be observed as shown in Figure 3.
The colour of the isochromatic fringes depends on which wavelengths are extinguished. It can be seen in Figure 4 that the higher the relative retardation, the more colour may be extinguished at the same time.

5. Quantification
Since the quality of image acquisition technology has improved a lot over the past decade the optical retardation can be determined by using a method based upon the RGB-photoelasticity [5].
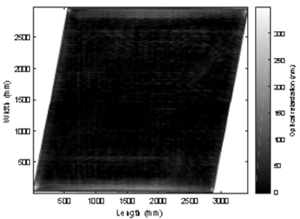
The source image coming from the on-line visualisation equipment is given in Figure 5. For each pixel of this image the retardation is determined by comparing the RGB value with the calibrated scale for the given system. This process results in the coloured Figure 6 showing the optical retardation in each point.
From Figure 6 a graph (Figure 7) can be plotted showing the optical retardation in relation to the percentage of the glass surface. Example: 66% of the glass surface has an optical retardation below or equal to 50 nm.
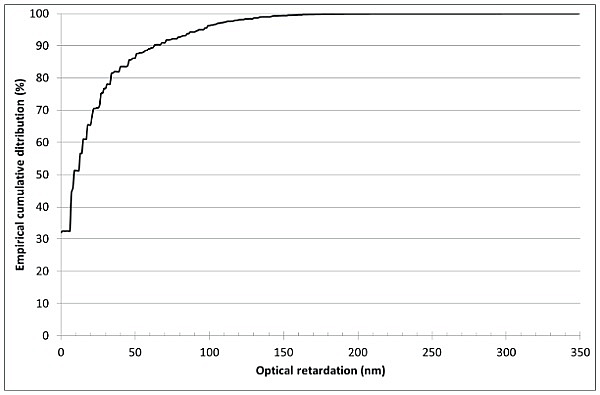
The steeper the curve, the less visible anisotropy as the optical retardation will be small indicating that the stress differential over the entire glass surface will be small i.e. the stress distribution will be more homogeneous.
From this curve a statistical evaluation can be made as given in table 1. The use of quantiles is recommended for benchmarking the level of anisotropy between different single heat treated glass panes of one or different batches.
If the values of the optical retardation for the 5% and 95% quantiles are almost equal meaning that the curve is very steep, almost no anisotropy will be visible.
| Maximum | 349.00 | Quantile 5 | 0 |
| Mean | 22.27 | Quantile 50 | 9 |
| Standard deviation | 32.06 | Quantile 95 | 97 |
As there will always be visible anisotropies along the edges of the glass one can decide whether to ignore the edge area or not depending on the future glazing method i.e. a captured system or a frameless system.
6. Financial impact
The sharp point of a triangle will always show critical anisotropy. Moreover the shape of the triangle is influencing the air-flow in the furnace and quench and affects the anisotropy of the bigger pane as shown in Figure 8.
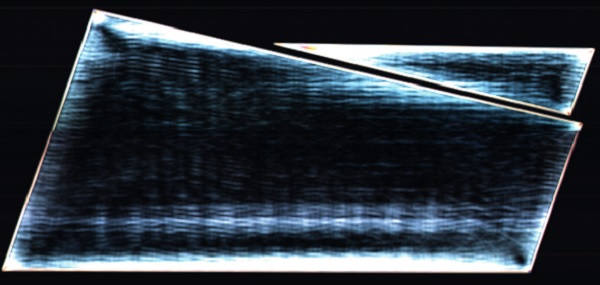
appearance of anisotropy.
This means that when controlling the anisotropy during the heat treatment one must take into account that a pane may influence another pane if they are part of the same bed load. In some cases controlling the anisotropy will reduce the bed load. This in addition to an optimized oscillation speed etc. will reduce the output of the tempering line.
Conclusions and Summary
As anisotropy free heat treated glass doesn’t exist and as the environment is influencing the appearance of anisotropy it is recommended to evaluate the glass by means of a mock-up installed on or nearby the construction site.
Once the mock-up has been approved, the continued production shall be controlled using an on-line visualization and quantification equipment allowing to compare the quality of the single heat treated glass with the quality of the approved mock-up.
Furthermore a scientific approach based on the photo-elastic theory resulting in an objective quantification shall be used to specify the required and acceptable level of anisotropy.
While specifying heat treated glass it must be taken into account that heat strengthened glass and/or thicker glass will show more anisotropy than fully tempered and/or thinner glass.
Even so it must be taken into account that a project with a lot of different dimensions and/or shapes will be more critical to have visible anisotropies compared to a project with huge series of glass having the same composition, dimension and shape.
Further measurements must be done to determine the additional cost for controlling the anisotropy during the heat treatment as the overall equipment efficiency is impacted by this process.
Finally measurement data shall be collected aiming at defining classes of anisotropy which potentially shall be standardized and become the reference.
References
[1] EN 12150 Glass in building – Thermally toughened soda lime silicate safety glass, 2015, 20
[2] EN 1863 Glass in building - Heat strengthened soda lime silicate glass, 2011 [3] EN 14179 Glass in building - Heat soaked thermally toughened soda lime silicate safety glass, 2016
[4] ASTM C1048 – 12 Standard Specification for Heat-Strengthened and Fully Tempered Flat Glass, 2012,3
[5] M. Illguth, C. Schuler, Ö. Bucak, The effect of optical anisotropies on building glass façades and its measurement methods, Frontiers of Architectural Research (2015) 4, 119 – 126
[6] H.W. McKenzie & R.J. Hand, Basic optical stress measurement in glass, Society of Glass Technology, 2014