Authors: Benedicto Joseph, Baraka Kichonge and Tatiana Pogrebnaya
Source: Journal of Energy, Hindawi | https://doi.org/10.1155/2019/6096481
Abstract
Integrating solar PV technology with semi-transparent windows permits multifunctional operation as electricity generation and allowing natural light to enter the building, hence overall energy efficiency improvement. The performance of the semi-transparent building integrated PV glazing on office building facade has been investigated in Tanzania’s tropical climate. Experimental measurements of the electrical and optical parameters for the system efficacy evaluation were done at various conditions which included cloudy, normal, and clear sky days. The weather parameters under consideration were solar irradiance, air temperature, relative humidity, and wind speed.
The experimental set-up consisted of building integrated silicon mono crystalline semi-transparent PV module rated at 50 W and accessories. The I-V and P-V curves were measured at different irradiances. Throughout the experiment, the observed module temperature was between 20°C and 51°C and the air temperature was 17–33°C while the humidity was recorded at the range of 23–63%. Module electrical efficiency was observed to vary from 4% to 9% while the visible light transmission was obtained between 11% and 19%. It was proved that at high temperature regardless of irradiance increase, there were observed output power and efficiency drops caused by high heat losses.
1. Introduction
Energy is an essential component and considered as the major agent that touches almost every sphere of human life, and the requirement for human development in the development process of any country for achieving sustainable goals according to [1–3]. However, overall awareness of energy use and its eco-friendly consequences have been raised in the report by the Intergovernmental Panel on Climate Change according to Didoné and Wagner [4]. Li et al. [5] studied that the rapid economic development of any country is usually accompanied by the growth of its energy consumption.
Generally, economic sectors such as transport, industry, transportation, and buildings are the main areas that consume energy. According to the International Energy Agency, commercial and residential buildings account for 30−40% of the total end-use energy consumption worldwide as stated by Güneralp et al. [6]. The share of buildings in the total energy consumption continues to increase by 8−10% every five years, which is attributed primarily to rapid improvement in the economy and the corresponding advancement in individual living standards [7].
Photovoltaic (PV) technology as the main provider of solar energy supply is a clean energy source that supports climate change mitigation [8]. It is one of the major ways of harvesting renewable energy for buildings that can minimize energy crises [9–11]. This is because the solar PV has minimal greenhouse gas emissions related to burning fossil fuel or any other source of energy. This is also proved by [3, 12] that photovoltaic solar energy is an efficient and cost effective energy as it has transformed socio-economic lives in villages, cities, and countries in Africa. Solar energy is converted to direct current electricity by PV materials, such as monocrystalline silicon, polycrystalline silicon, and amorphous silicon as described by Green et al. [13].
With almost 1.5 billion people the challenge of providing affordable, clean, and sustainable energy for building applications remains one among the global challenges facing the world at present according to Biyik et al. [14] and Shukla et al. [15]. The efforts in providing affordable, clean, and sustainable energy have often concentrated on the conventional single renewable energy technology options such as the solar photovoltaic and the wind according to [16, 17]. However, such options are frequently incapable to provide consumers’ needs adequately and reliably due to limitations in resource availability. Building-integrated photovoltaic (BIPV) systems are considered as a solution to challenges encountered [18, 19]. The BIPV systems are a relevant application of the photovoltaic and are used where solar PV modules are integrated into the building structure [20, 21].
This combination is made by PV modules as a portion of the building ingredients [22, 23]. The production of qualified electricity using BIPV results is very close to the demand points, and the building envelop provides an aesthetical, economical, and technical solutions [11]. This directly increases energy efficiency and decreases electrical supply losses, also reduces the use of energy in buildings’ as well as contributes to mitigating the opposing effects of climate change [18, 22]. However, the energy generation by BIPV system depends on different factors such as solar irradiance, temperature, humidity, orientation, and wind [20, 24–26].
Office buildings are particularly suitable for BIPV as they consume energy primarily in daytime, which is when the PV system collects and converts the solar energy into electricity; thus, the effort and cost associated with energy storage can be avoided according to Yang et al. [27]. BIPV technology is becoming widely used in most modern buildings worldwide, especially office buildings, residential buildings, and greenhouses [12, 28]. The technology most used in an office building is the semi-transparent integrated PV because it creates a pleasant environment allowing natural light to enter the building and avoiding overheating in the summertime while producing electricity. The semi-transparent BIPV allows high transmission of the light while opaque BIPV does not have the ability to allow penetration of the natural light; it is mostly used in roof and facades but not in windows [29, 30].
Available performance data as reported by manufacturers are normally established under laboratory conditions which are solar irradiance of 1000 W/m2, the temperature of 25°C, and air mass value of 1.5 [24, 31, 32]. The information established under laboratory conditions in most cases does not represent actual conditions established at specific locations and therefore leading to significant differences in output values [33]. Also the cost analysis and energy payback time in most cases are not considered for the BIPV basing on local conditions [34].
However, there is still a lack of studies in tropical regions regarding multifunctional performance of the semi-transparent BIPV as compared with conventional PV technologies. Much of the research on the multifunctional effect of semi-transparent BIPV has attempted the utilization of theoretical modeling for the semi-transparent BIPV modules which might not truly reflect the ones currently available in the market [35, 36]. Tanzania being in the tropical regions is normally characterized with hot and humid climatic conditions almost whole-year-round resulting in its buildings being cooling-load dominated. Therefore, with this backdrop, the study aims at investigating the electrical and optical performance of the semi-transparent BIPV for office building applications mostly suitable for tropical conditions.
2. Research Methodology
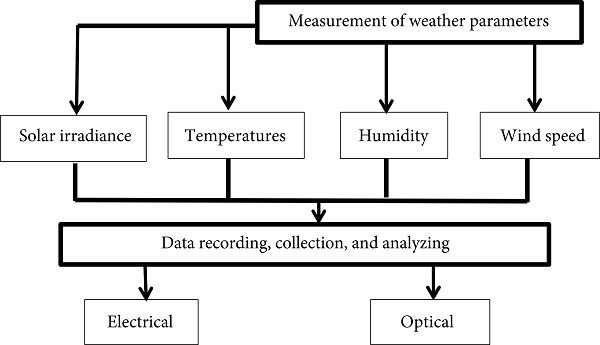
The study consists of the field measurements and experimentation for the performance of the semi-transparent PV panel. The field measurement is carried out for the experimental investigations of electrical and optical properties, as well as the performance of the semi-transparent PV panels under various weather conditions. Figure 1 shows the conceptual framework of the study.
2.1. Measurement Equipment and Accessories
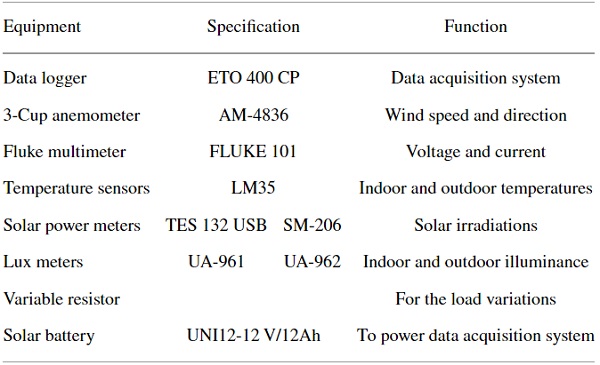
Different equipment and accessories were used for the study using two solar meters SM-206 and TES USB 132, two lux meters UA-961 and UA-962, 3 cup anemometer AM-4836, three temperature sensors LM35, fluke multimeter FLUKE 101, and variable resistor respectively, controlled by the data logger as shown in Table 1. Measurement of different parameters was done by different equipment and accessories and taken based on various test conditions of the Arusha tropics. These parameters are solar irradiance G, incidence, and transmitted illuminance Ein and Etr, air temperature Ta, room temperature Tr, module temperature Tm, relative humidity Rh, and wind speed.
The solar meters were used for measuring the global solar irradiation, while lux meters were used for measuring the daylight entering the building for checking the energy saving; temperature sensors were used for measuring the humidity, indoor, and outdoor temperature. Fluke multimeter and variable resistor were used for measuring the voltage and current at different irradiation within 5 minutes to keep constant irradiance for plotting I-V and P-V curves. The three-cup anemometer was used for measuring the wind speed while the data logger was used for monitoring the whole experiment by storing the data through the card leader and the information is sent directly to the nearby laptop by bluetooth. Table 1 shows the description of the equipment for the experiment.
Table 1. Descriptions of measurement equipment for the study.
2.2. Experimental Set-Up
The experimental study was set at the Innovation Technological and Energy Center (iTEC) building, Nelson Mandela African Institution of Science and Technology. Solar meters with an accuracy of ±10% were installed nearby the semi-transparent PV and north facing facades at the same inclination. Three temperature sensors were used: one sensor was connected directly to the data logger, another outside nearby the solar window glazing while third sensor within the surface of the window glazing. The 3-cup anemometer was installed 1.9 m from the ground and 2.5 m across the window and connected directly by the RS232 cable to the computer.
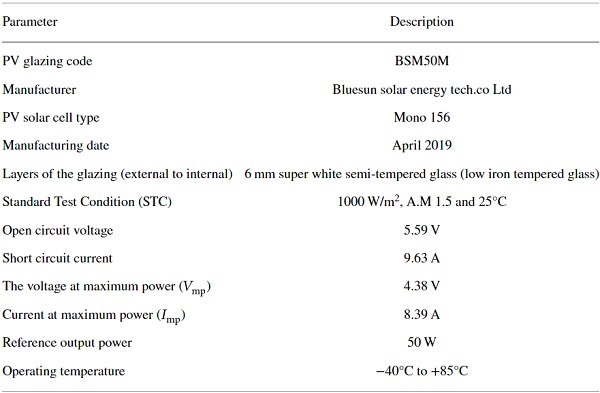
The double glazed mono crystalline silicon semi-transparent PV module of 50Wp manufactured in China was fixed on the window at an inclination of 90°. Semi-transparent PV was chosen because they are used in office buildings as it has a transparent area to allow the light for penetration and occupant comfort. Table 2 shows the specification of the module for the study.
Table 2. Descriptions of the PV glazing.
2.3. Field Measurement
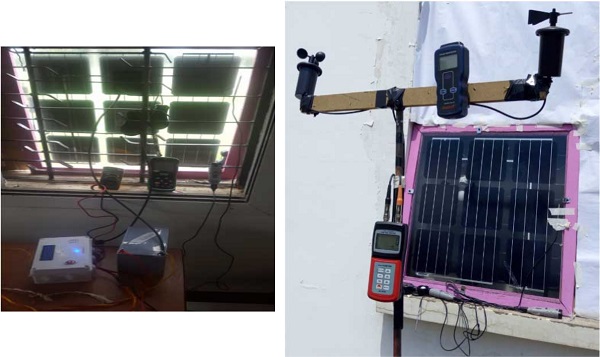
The field experiment and data collection were conducted for 10 hours a day from May to August 2019. All data was recorded by the data logger automatically at the interval of one minute and be sent to the near-by computer for the storage by using Bluetooth and averaged to one thirty minutes for simplifications of the data. There were some trees nearby the experimental area facing south; therefore, the tests in the evening could be influenced by a shading effect that was considered. The measurement was done basing on a clear sky, cloudy sky, and normal sky days weather conditions. Figure 2 shows the inside and outside view of the semi-transparent window glazing.
2.3.1. Measurement of Air Temperature, Relative Humidity, and Module Temperature
Three temperature sensors were used to measure the temperature on both inside and outside the surface of the PV glazing, the temperature of the module and the relative humidity. One of the sensors was connected directly to the data logger for recording room temperature and relative humidity. The air temperature was recorded by another sensor that was installed outside nearby the solar panel and the module temperature was connected by another sensor within the surface of the panel.
2.3.2. Measurement of Solar Irradiance and Daylight at Various Test Conditions
Two solar meters and lux meters were installed nearby the semi-transparent PV and north facing facades. One solar meter was installed near the experimental room and another was connected outside about 1 m from the solar panel both tilted at 90°. Also, one lux meter was fixed at the center of the rear side of the semi-transparent PV and at a height of 0.54 m, to record the indoor illuminance. Another lux meter was installed near the panel out of the experimental room to determine the outdoor illuminance. Both solar meters were recording the global solar irradiance for comparison purposes while lux meters were recording the transmitted and incident daylight.
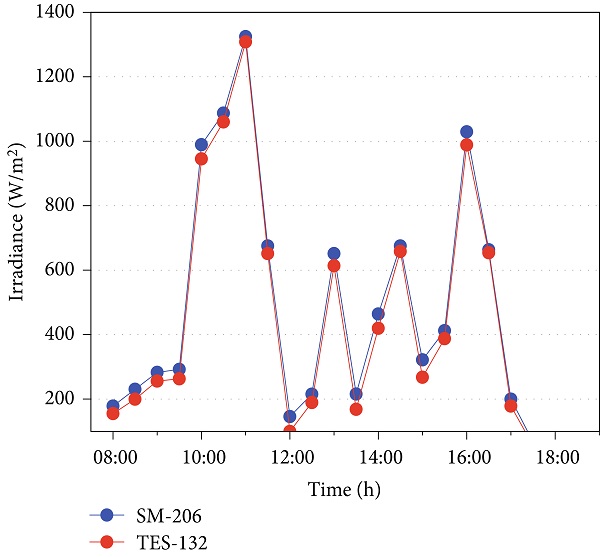
Figure 3 shows comparisons of the two solar meters, SM-206 and TES-132 USB, for consideration of the impact of irradiance variation. It was observed that data comes to an agreement with a slight variance in the range from 7 to 40 W/m2 between the total readings on both test conditions throughout the experiment. In this observation, the reading of the solar meter one SM-206 gives higher value due to its high sensitivity and gives more reliable signal, and it was considered for further measurements.
2.3.3. Testing of Electrical and Optical Performances
Electrical and optical testing was done by performing experiments on studying the photovoltaic electricity generating capabilities of the semi-transparent BIPV modules by using equivalent circuit were also tested by other researchers [37, 38]. The electrical parameters include current, voltage, and power. The I-V and P-V curves provide important performance information about the PV modules such as the open circuit voltage Voc, the short circuit current Isc, the maximum rated power Pmax, current at the maximum power Imp, voltage at the maximum power Vmp. Then the fill factor (FF) and the power conversion efficiency η were calculated from the formulas (1) and (2):

where: G is the incident irradiance, W/m2, and A is a window surface area, m2.
Also, in testing optical performance, the visible light transmittance (VLT) as the basic parameter was calculated. Some parameters on optical measured and calculated were illuminance, transmitted (Etr) inside the room and incident (Ein). Then VLT was calculated using formula (3):

3. Results and Discussions
3.1. Weather Parameters Results
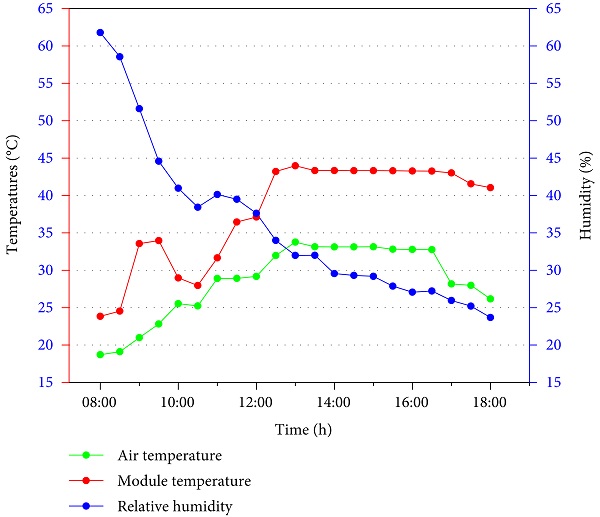
Weather parameters are important factors for the performance of the solar PV window. These parameters are temperatures, humidity, and irradiance. The variations of the air and module temperatures with the humidity at different test conditions for the experimentation are shown in Figure 4 as measured on 10 July 2019. The air and module temperatures vary from 17°C to 33°C and 23–51°C, respectively, while relative humidity varies from 23% to 63% at different test conditions through the experimentations. As the air temperature increases, there is a great increase in the module temperature that may affect the performance of the PV window glazing. Our observation agrees with other findings [1, 39] that as air temperature increases, relative humidity decreases with irradiance increase but not significantly. It was observed that any drop in relative humidity is due to the increase in irradiance, hence resulted in increase in power output; the observation agrees with data by Hassanien et al. [40].
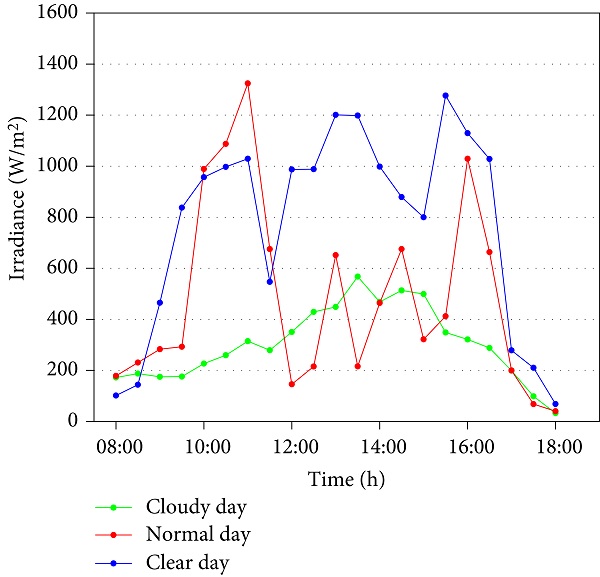
Variation of the solar irradiation at different test conditions measured on 28 May 2019, 10 June 2019, and 18 July 2019 are shown in Figure 5. It has been observed that at clear sky, the energy received was 6 kWh/m2/day, at normal sky, 4 kWh/m2/day while at the cloudy sky, the total solar energy was only 2 kWh/m2/day. The irradiance was reduced sharply when the sun was covered by clouds and raised shortly when the sky cleared. The solar irradiance ranges were ~30–450 W/m2, 75–800 W/m2, and 130–1350 W/m2 on a cloudy, normal, and clear sky days condition, respectively, throughout the experimentations. The maximum solar irradiance at noon reached ~1350 W/m2 for the whole experiment while the minimum irradiance was obtained in the evening ~32.5 W/m2.
In the evening the solar radiation drops abruptly from 5 pm to 6 pm additionally due to the shadding effect. This observation agrees with the author Cheng et al. [41] in climatic regions of China were shading has an effect on power generation because during shading there is drop of solar irradiance. Also, the fluctuations of monitored parameters were due to the change in environmental conditions caused by either increased or decreased wind speed, unprolonged cloud cover or irradiance fluctuations were also observed by [42] in climatic condition of Tanzania. Hence consideration of the location must be taken into account for proper solar PV maintenance in buildings.
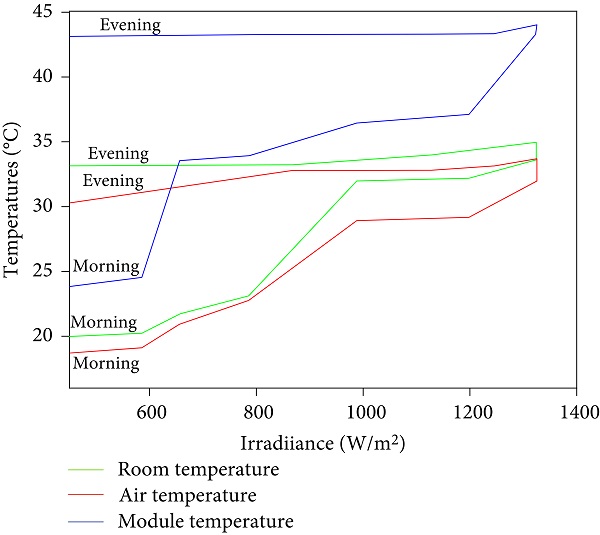
Also, the effect of solar irradiance on the temperature of air Ta and the semi-transparent window glazing Tm and room temperature Tr are shown in Figure 6 as measured on 18 June 2019. Any increase in temperatures is due to the increase of the solar irradiation, and module temperature Tm is higher than air temperature Ta by 5–10°C. The temperatures increase gradually with increase in irradiation in the morning, but in the evening when the irradiation decreases sharply the air temperature decreases slowly while the module temperature remains practically unchanged; this observation concurs to the work by Selvaraj et al. [43] done in the United Kingdom.
3.2. Electrical Performance
The electrical characteristic (I-V and P-V) curves measured at different irradiances on the semitransparent window glazing are shown in Figure 7. From the curves, the open circuit voltage (Voc), and the short circuit current (Isc), were obtained; the efficiency and fill factor were calculated from the formulas (1) and (2); electrical performance parameters are summarized in Table 3. The maximum efficiency obtained was 8.89% at an irradiance of 1000 W/m2 and a temperature of Tm = 32°C, which was equivalent to the manufacturer’s efficiency, while at 1100 W/m2 the efficiency decreased to 5.82% with an increase module temperature of 46°C.
The power produced by the solar window was affected by irradiation and temperatures. The higher the solar irradiance the higher the power, while as module temperature increases the module current and the voltage drops, for example; at G = 1100 W/m⁻² and Tm = 32°C the power, current Isc, and voltage Voc appeared lower than those at G = 1000 W/m⁻² and Tm = 47°C (Table 3). The results agree with other studies [44, 45] performed in the tropics of Spain and China, respectively, that with increasing temperature Tm, the Voc and Pmax decreases.
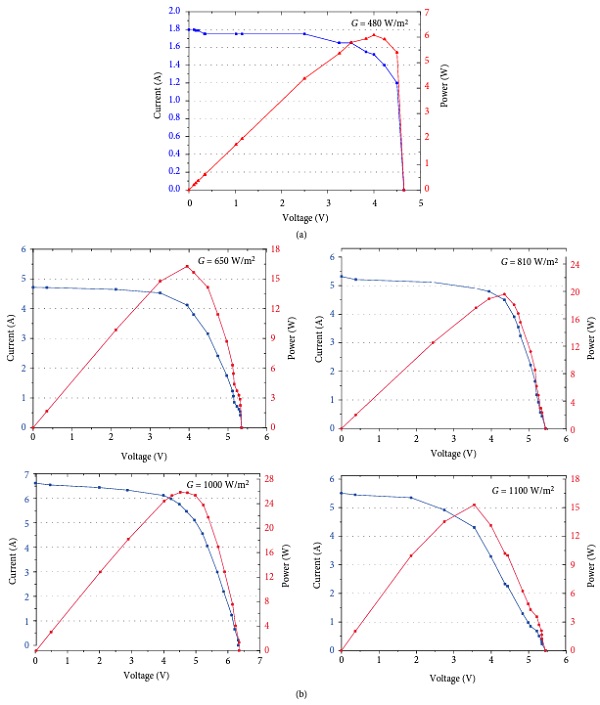
Table 3. Results of electrical measurements investigating the effects of irradiance and temperature.
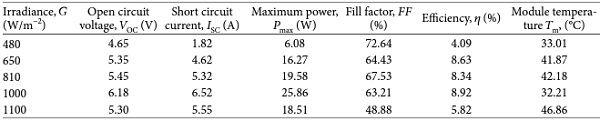
The variation in power versus solar irradiation obtained through the recordings of voltage and current operating from morning to evening is shown in Figure 8. The power generated apparently depends on the solar irradiation, the higher the solar irradiations the higher the output power and vice versa. In the morning, the irradiance increases with the increase in power output, while at noon there is slightly a change in irradiance before being decreased in the evening depending on other factors such as module temperature. This was also proved by [46, 47] that irradiance directly proportional affects the power output with the variation in temperature. Through the regression analysis, the coefficient R² was found to be 0.8243 which is between two sets of data; this confirms a direct mutual correlation between the power generated and solar irradiance.
3.3. Optical Performance
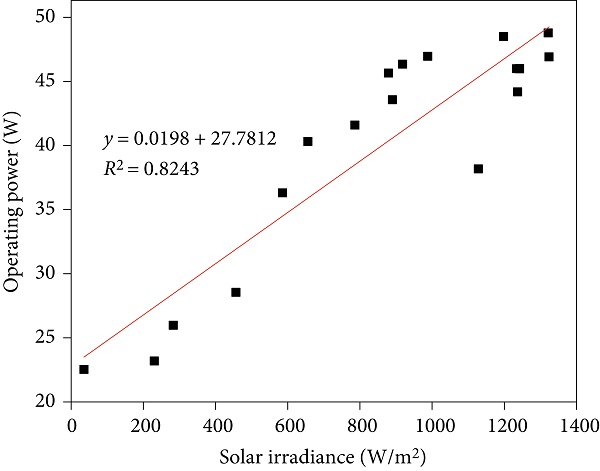
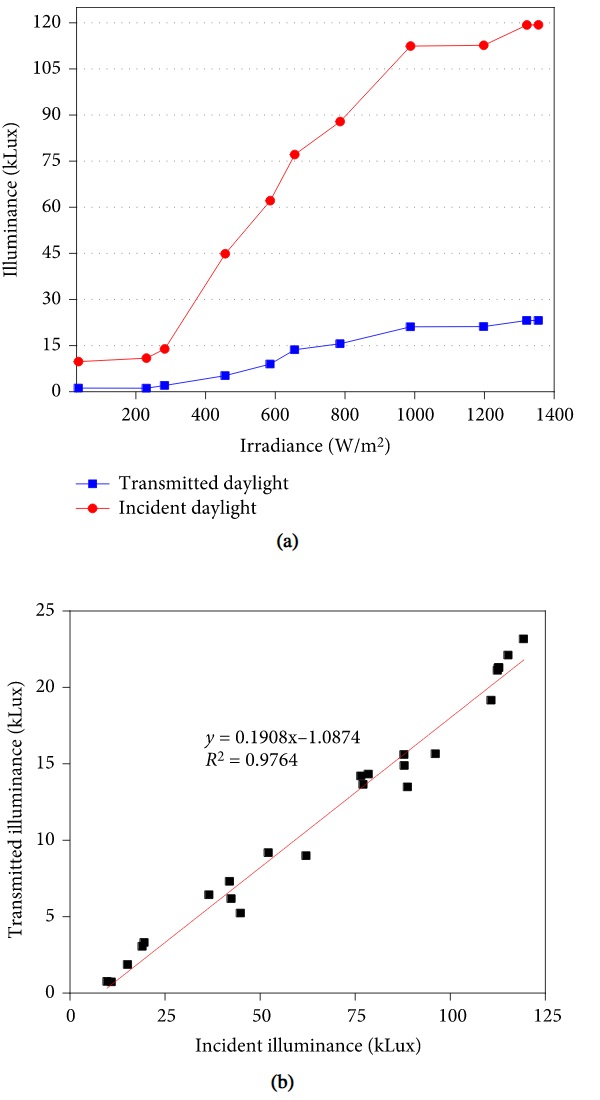
The visible light transmittance of the semi-transparent is the important parameter for the determination of the day light coming inside. It was calculated from formula (3). Figure 9(a) shows the plot of the transmitted daylight illuminance through the semi-transparent PV as the daily profile of the daylight illuminance measured in the clear sky on 26 July 2019. The results show low values of the illuminance in the morning and higher values recorded in the afternoon, also low illuminance again in the evening. The illuminance drops as solar irradiation also drops and vice versa.
The maximum outdoor daylight illuminance Ein was 119 kLux between 12:30 and 15:00 while the correspondent transmitted energy Etr was 23 kLux, this represents VLT of 19% which can be used as light inside the room. The values come to an agreement with other researchers [48, 49] where the VLT ranged 2–37% in the tropics of China. Our result also shows that an increase in outdoor and indoor illuminance is due to the increase in the irradiance with good correlation with the determination coefficient R² of 0.9438. Figure 9(b) shows correlation indoor daylight illuminance through the semi-transparent PV panel against the incidence daylight illuminance. In this plot there is a good correlation with the coefficient R² of 0.9794.
4. Conclusion
In this paper, an experimental investigation of the semi-transparent BIPV electrical and optical performance on-office building applications suitable for tropical conditions was carried out. The actual data considered were for different test conditions which involved cloudy, clear, and normal sky days. The electrical analysis shows that the performance decreases with increasing of the module temperature inspite of higher irradiance. The maximum efficiency obtained was 8.89% at irradiation of 1000 W/m2 at the panel temperature of 32°C while at 1100 W/m2 efficiency decreased to 5.82% with increase of temperature to 46°C.
Also, the study proves that the semi-transparent window glazing generates more indoor environmental visual comfort for occupants with the energy saving of between 11% and 19%. Therefore, the test of the semi-transparent BIPV electrical and optical performances in real operating conditions is necessary to promote the systems integration in buildings, and help in more efficient energy use according to the sustainable energy goals.
Abbreviations
| BIPV: | Building-integrated photovoltaic |
| FF: | Fill Factor |
| Ein: | Incidence daylight |
| Etr: | Transmitted daylight |
| Ta: | Air temperature |
| Tm: | Module temperature |
| Tr: | Room temperature |
| VLT: | Visible light transmission |
| Rh: | Relative humidity |
| Pmax: | Maximum power |
| Isc: | Short circuit current |
| Voc: | Open circuit voltage |
| Vmax: | Voltage at maximum power |
| Imax: | Current at maximum power |
| η: | Power conversion efficiency. |
Data Availability
The data used to support the findings of this study are available from the corresponding author upon request.
Conflicts of Interest
The authors declare that there are no conflicts of interest regarding the publication of this paper.
Acknowledgments
The authors are gratefull for the financial support from Water Infrastructure and Sustainable Energy Futures (WISE-Futures), African Centre of Nelson Mandela African Institution of Science and Technology (NM-AIST) for enhancing and stimulating learning and research environment, which contributed greatly in completing the research work. We also appreciate the role played by Dr. Rhee Herb (Managing Director of Innovative Technological and Energy Center, iTEC) for his inputs and conductive environment given for the research work at the iTEC building.