Authors: Thomas Bröthaler, Marcus Rennhofer, Daniel Brandl, Thomas Mach, Andreas Heinz, Gusztáv Újvári, Helga C. Lichtenegger and Harald Rennhofer
Source: Sustainability 2021, 13(8), 4374; MDPI
(This article belongs to the Special Issue Green Building Technologies II)
DOI: https://doi.org/10.3390/su13084374
Abstract
Due to recent changing climate conditions and glazing of building facades, a rapid increase in the requirement of cooling systems can be observed. Still the main energy source for cooling are fossil fuels. In this article we report on a fully integrated approach of running a heat pump for actively cooling a test room by electric energy, generated by facade integrated photovoltaic modules, the “COOLSKIN” system. Photovoltaic facades are emission free in the operation phase, efficiently utilize otherwise unused surfaces, and portray a favorable method in terms of construction physics and the architectural design of buildings. Compared to existing systems, COOLSKIN is an entirely autonomous system where every component is located inside the facade structure which introduces a high level of plug and play character.
In this article the analysis of the electric performance of the COOLSKIN system with respect to its operation under different environmental conditions is presented. The over all system efficiency was determined with 73.9%, compared to a simulated efficiency (PV*SOL) of 68.8%, and to the theoretically expected value of 85%. The system behavior is evaluated depending on photovoltaic output and the cooling demand. The analysis shows that a considerable amount of cooling demand could be decentrally fulfilled with photovoltaic energy, but environmental conditions as well as system layout have a considerable impact on system performance.
1. Introduction
The transition to renewable energy is essential to reduce carbon dioxide pollution and thus positively affect the climate [1]. Currently in Austria 33.5% of total energy and 72.6% of electric energy originate from renewable sources. The Austrian goal is to cover 100% of total national electric energy demand with renewable sources by 2030, reach climate-neutrality by 2040, and switch the entire energy system to a renewable one until 2050 [2,3,4]. Expanding the market for solar power, supporting the implementation of policies which strengthen the use of clean technologies and optimizing renewable energy technologies will be important tasks to shift the fossil dominated energy system to a renewable one [1,5,6,7].
In order to reach the 100% renewable energy goal in 2050, estimations from Fechner et al. [8] show that the current proportion of installed photovoltaic is 1 TWh which needs to be increased to at least 29.9 TWh. This amount of solar energy requires around 170 km22 of space. The estimated roof and facade area potential of 230 km22 indicates that it will be a major challenge to fulfill the photovoltaic energy goal [8]. A recent study from Fechner [9] indicates that the area potential is not sufficient, making additional measures necessary, like optimizing the use of renewable energy by the direct and decentralized consumption or the systematic integration in facades, even if the energy potential of those is not maximal [10].
The rising interest in energetically self-sustaining technical systems will be further enhanced in its dynamics of application because of its positive impact on the public energy supply price [11]. Thermal comfort requires a large proportion of the available energy while a rapid uptake of appliances and cooling systems can be observed [12,13]. Reducing the energy consumption in the building sector is another step towards a more sustainable development pathway. A promising concept for energy surplus buildings is therefore, to use photovoltaic modules mounted on the facade for cooling (and heating) as well as modules on the roof for residual electric energy applications. Weather independence, passive cooling, and annual equalized production due to the optimized use of the sun’s position during the morning and evening are the main benefits of facade-integrated photovoltaics [14,15,16]. Using solar energy for cooling or heating purposes is already a well-studied area [17,18,19,20,21,22,23].
Nevertheless, most of the comparable systems found in the literature either use facade PV without direct cooling purpose [23,24,25] or a cooling system, powered from other PV sources, demanding already contested space like roof top installation [17,18], or consider photovoltaic-thermal systems [26]. Many reported systems are merely simulated and theoretically analyzed [19,23,27] or require a grid-connection [18]. In contrast to this, the facade PV system COOLSKIN, considered here, is an entirely autonomous installation, with all necessary components located inside the structure that is mounted onto the facade. Our study combines facade PV for energy production with a cooling/heating system (shading and active cooling/heating). Among the standalone systems, the COOLSKIN technology sets itself apart due to its high plug and play character whereby it can be retrofitted effortlessly, and the efficient use of otherwise unused spaces.
Research projects like ’Multifunctional Plug & Play Facade’ (MPPF) and ‘COOLSKIN’ focused on developing environmentally friendlier systems in order to contribute to a more sustainable future [16]. Based on the setup and findings of the MPPF within the project COOLSKIN, a multidisciplinary team developed the setup which consisted of a facade with an autonomous photovoltaic-powered system for cooling of interior spaces. Facade integrated photovoltaic (PV) modules converted the solar irradiation into electricity in order to operate a heat pump (HP) system for controlling the indoor temperature of the adjacent interior room [28]. Inverter, battery, cooling unit, and ventilation were also facade integrated and fully supplied by the PV [29]. The setup was connected to an electrical energy storage, no external energy supply was connected.
The mock-up system has been tested under real conditions from January 2018 until September 2019. First results from Brandl et al. [28] have shown a good match of the daily and seasonal cooling demand in the building and the solar irradiation hitting the surface area of the facade [30]. In comparison to that, critical system behaviors for heating situations as well as during bad weather conditions were observed [29].
This article undertakes a performance evaluation of the electrical sub system of COOLSKIN installation for cooling scenarios by analyzing monitoring data of the electrical components over the course of 2018 and 2019. First, representative days with clear, cloudy, and overcast sky conditions were determined and the corresponding general system behavior was scrutinized, respectively. Furthermore, the performance characteristics of the COOLSKIN system were analyzed during clear-, cloudy-, and overcast sky conditions regarding cooling scenarios. Finally, the annual overall performance concerning efficiency and thermal-load fulfillment was determined.
The article is structured in the following way: After the introductory section the COOLSKIN concept, experimental setup, and methodological processes are presented in Section 2. Results concerning the COOLSKIN performance for clear, cloudy, and overcast sky conditions, observed system behavior, the system efficiency, and the thermal-load fulfillment are presented in Section 3. The results are discussed in Section 4 and conclusions are drawn in the last section.
2. Materials and Methods
2.1. Experimental Setup
During the development phase of the scientific framework of the COOLSKIN system, the design was subdivided into three development steps: The first involves an evaluation of promising system configurations, the second involves the construction and dimensioning for a functional experimental model, and the third involves the implementation and monitoring of an outdoor test-facade.
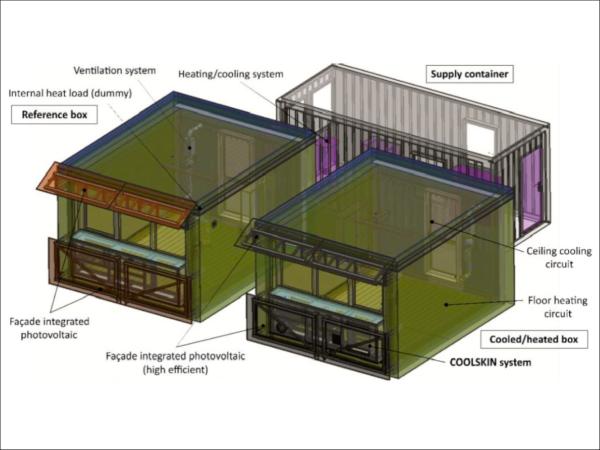
As shown in Figure 1, the COOLSKIN outdoor test-facility consisted of a non- conditioned reference-room (box west: left) and a climatized test-room (box east: right). The boxes, with an effective floor area of 13.49 m22 (room volume approximately 30 m33), each were made of concrete and were insulated with 200 mm thick expanded polystyrene (EPS) material. A container was situated behind the test-facilities in order to host technical periphery and monitoring IT infrastructure. Optionally it supplied the boxes with external heating to prevent damage by freezing during critical situations [28].
![Figure 1. COOLSKIN 3D model (a) and south-side view of the real-setup (b) at the campus of TU Graz (left: reference box west without temperature regulation, right: test box east with temperature regulation) [28].](/sites/default/files/inline-images/Fig1_300.jpg)
The components installed on the test-room are listed in Table 1. Additionally, a schematics of the electric circuit of the COOLSKIN system is displayed in Figure 2, together with the main results for the system efficiencies determined in this work. Four black enameled glass-glass modules (Ertex Solar-type “black line”) with 1167 W cumulative nominal power were placed on the test-room (Table 1 component 1), two below the window and two above the window. The modules consisted of mono crystalline cells which were all connected in series. Four gray-printed glass-glass modules (Ertex Solar-type “digital print”) were mounted on the facade of the reference-room. Here they served no other purpose than shading the reference-room in an identical way, the “black line” modules shaded the test-room and were used in additional experiments, not presented in this work.
The other components, including electronics, a Li-ion battery, and the heat pump were installed behind the lower part of the PV-facade. The PV-modules output was controlled by a “Maximum Power Point Tracker” (MPP-Tracker) which also controlled the battery charging process (Table 1 component 2). The battery acted as a dynamic buffer between the PV-modules and the compressor (Table 1 component 3)—the compressor was never powered by the PV-modules directly, but from the battery only. It was realized by two 𝐿𝑖𝐹𝑒𝑃𝑂4-batteries each with a 1.15 kWh capacity and 12.8 V voltage which were connected in series to attain a capacity of 2.3 kWh and a nominal voltage of 25.6 V. The DC battery voltage was transformed by the inverter (Table 1 component 4) to 230 V and 50 Hz AC to power the compressor which provided thermal energy for test-room temperature regulation [29]. The compressor was capable of partial load operation and had an electric consumption between 200 and 450 W, depending on the mode of operation (Table 1 Component 5). In this installation, a maximum of 85% of the PV-yield could be used to supply the compressor, due to conversion losses of the MPP-tracker, battery, and inverter [28].
![Figure 2. Schematic of the electric circuit together with power measurement points and corresponding measured efficiencies of the built in components together with system efficiencies results (authors’ own figure, data: AIT, based on Rennhofer et al. [29]). Including results of this article.](/sites/default/files/inline-images/Fig2_308.jpg)
Table 1. COOLSKIN system components description with corresponding maximum conversion efficiencies of the official data sheets [29,31]. PV: Photovoltaic; MPP-Tracker: Maximum Power Point Tracker.

The measurement positions of power values in the COOLSKIN system are indicated on the left-hand side of the schematic electric circuit by the green lines in Figure 2 for comprehensibility reasons. The first power measurement was conducted after the PV-modules 𝑃𝑝𝑣 and relates to the actual power output of the PV modules. The second power measurement was conducted between the MPP tracker and battery 𝑃𝑏𝑎𝑡, allowing to calculate the conversion losses by the MPP tracker. The third power measurement point was between the inverter and AC-compressor 𝑃𝑐𝑜𝑛𝑠, and is related to the actually consumed power. Consequently, the results of these measurements were used to calculate the associated efficiencies, which are described in Section 2.3. For a better overview, the efficiencies results are indicated already in Figure 2 on the right-hand side of the schematic electric circuit by blue lines. The measured overall mean system efficiency 𝜂̲¯𝑠𝑦𝑠 is compared to the theoretical value 𝜂𝑡ℎ, calculated from the data sheet efficiencies of the components and a value obtained from a simulation of the system in PV*SOL software, 𝜂𝑠𝑖𝑚.
The thermal system contained a ventilation channel with an integrated heat exchanger and, based on the required application, it could be operated in condensing or evaporating mode. The test-room was cooled by a plate heat exchanger on the ceiling, heated by a floor integrated pipework, and directly conditioned with a fan coil unit. The reference room was only supplied with warm water from the supply container when the interior temperature dropped below 12 ∘C to prevent damage caused by freezing. The test-box contained several sensors, e.g., for component power measurements, refrigerant state, electric consumption, temperature, and many others. The heating and cooling system was regulated based on the information of these sensors. Additionally during working days between 8:00 and 16:00, a heat load of 300 W was activated to simulate the internal thermal loads due to persons and equipment [28].
The main goal of the COOLSKIN system was to keep the temperature above 21 ∘C and below 26 ∘C. Therefore, the system was set to optimally use PV for charging the battery and the battery energy to supply the compressor for providing comfort conditions. The charging progress was controlled by the MPP-Tracker (acting as a charge controller) according to the charge level, which was indicated by the battery voltage level. The charging process was initiated in case the battery voltage was below the cut-off voltage of 28.4 V [30]. In the COOLSKIN setup, the discharge process was stopped before the battery voltage decreased below 23 V. The charging process of the MPP-Tracker was configured in three phases:
- Bulk: The controller delivers as much charge current as possible to rapidly recharge the batteries.
- Absorption: When the battery voltage reaches the absorption [upper] voltage setting, the controller switches to constant voltage mode. When only shallow discharges occur, the absorption time is kept short in order to prevent overcharging of the battery. […]
- Float: During this stage, float voltage is applied to the battery to maintain it in a fully charged state. When the battery voltage drops below float voltage during at least 1 min, a new charge cycle will be triggered [32].
2.2. Data Measurement, Processing, and Analysis
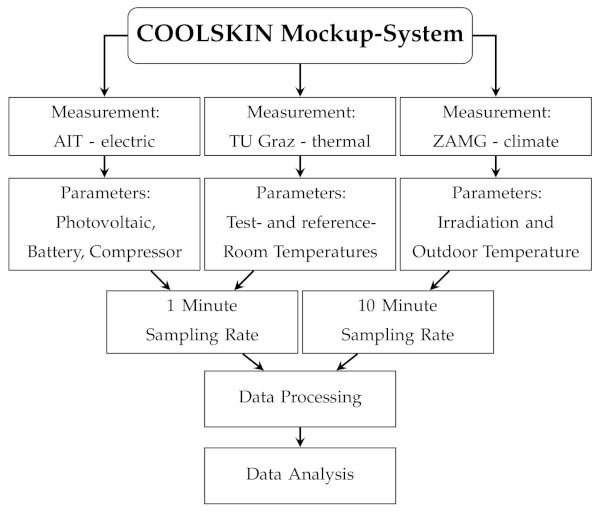
In the experimental investigation, electrical and thermal parameters were monitored in the field installation site. Electrical parameters like photovoltaic and battery voltage, current and power, as well as the compressor AC consumption were recorded. The main parameters for the given investigation were the room and the ambient temperature, measured at the test site. Data of the outdoor temperature and global irradiation for the specific location was provided by the Austrian meteorological measurement network by “Zentralanstalt für Meteorologie und Geodynamik” (ZAMG).
The time period considered in this article ranges from the 1 September 2018 until the 30 September 2019. The data files were collected from the various sources which also had varying sampling rates. For example the irradiation and outdoor temperature data were recorded with a 10-min time resolution, while the electric data was stored with a one-minute sampling rate. Consequently, the fact of different sampling rates was taken into account regarding the evaluation. In further steps, coding in R (Version 4.0.4) was applied to filter, select, analyze, and visualize the data efficiently. The main R-packages used for data processing and analysis were tidyverse, lubridate, ggplot2, and plotly. The measurement and methodological processes of this article are visualized schematically in Figure 3.
Data errors and missing values were observed over the considered time period. Major outages during November 2018 until February 2019 were caused by the partial deactivation of the system for rebuilding purposes, thermic system adjustments, and general maintenance.
2.3. Calculations and Used Formulas
The main results of this manuscript depend on the measurement of individual power values P, as indicated in Figure 2 and the data of global irradiation H in Watts per square meter, provided by ZAMG.
It shall be noted that the system efficiency was determined for suited time values of the monitored data where all necessary data for a full calculation was available and the regarding components were operating. The corresponding efficiencies from the PV panels to the battery and from the battery to the compressor, respectively, could only be evaluated if the corresponding components were available, i.e., the system was switched on and the PV-modules were operating. Also the system design allowing no bypassing of the battery restricted the choice of data for the evaluation of system efficiency by cases where, e.g., the load was on and the battery charging at the same time, as the load was operated through the battery only.
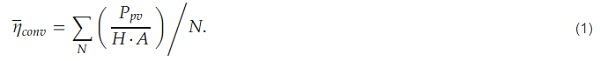
The mean photovoltaic modules conversion efficiency 𝜂̲¯𝑐𝑜𝑛𝑣 was calculated with N is the amount of measurements, 𝐴=8.4 m2 is the area of the photovoltaic modules, 𝑃𝑝𝑣 is the measured photovoltaic power values, and H is the corresponding global irradiation values as follows (Equation (1)).
An important parameter to distinguish between clear, cloudy, and overcast sky conditions can be derived from changes in the global irradiation values, caused by changing cloud conditions. This parameter, the amount of irradiance fluctuations over a specific time period 𝐻̃˜, was calculated over a day of 24 h if not otherwise indicated. 𝐻̃˜ is defined by summing differences between consecutive H measurements, normalized by N, the number of measurement values (Equation (2)):

The thermal-load fulfillment factor 𝑇𝐿𝐹𝐹 is defined as the percentage of temperature values inside the thermal thresholds of 21 ∘C to 26 ∘C. The 𝑇𝐿𝐹𝐹 was calculated with the amount of temperature values within the thresholds 𝑛𝑇,21−26∘C and the total amount of recorded temperature values 𝑛𝑇 (Equation (3)):
![]()
The energy E gained in a given time period t can be calculated from the average of all power measurements in this time period 𝑃̲¯ by: 𝐸=𝑃̲¯·𝑡.
The photovoltaic modules only produce energy if the battery needs to be charged or the compressor to be powered in order to provide thermal energy. At other times, the potential photovoltaic modules output was curtailed, i.e. not used. In order to calculate the theoretically available PV energy in a given time period 𝐸𝑡ℎ, the mean theoretical generated PV power in this time 𝑃̲¯𝑝𝑣,𝑡ℎ was determined. To this purpose, the global irradiation in the considered time period was averaged 𝐻¯ and multiplied by the area of the solar panels A as well as the measured conversion efficiency of the solar panels 𝜂̲¯𝑐𝑜𝑛𝑣 (Equation (4)):
![]()
The estimated percentage of lost energy due to the curtailment of PV modules of a certain time period 𝑝𝑐𝑢𝑟𝑡 can be calculated by the ratio of gained energy E and theoretically available energy 𝐸𝑡ℎ, as defined below (Equation (5)). Note, that the mean power values 𝑃̲¯𝑝𝑣 and 𝑃̲¯𝑝𝑣,𝑡ℎ can be used for this calculation as well:

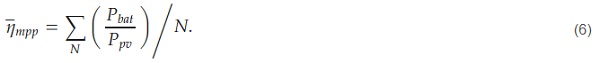
The COOLSKIN measurement positions were located after the PV modules, before the battery and before the compressor (see Figure 2). Therefore, the mean MPP-tracker efficiency for the whole available time period 𝜂̲¯𝑚𝑝𝑝 can be calculated from the N measurement values of the battery power 𝑃𝑏𝑎𝑡 and the PV power 𝑃𝑝𝑣, (Equation (6)):
Because of the above-mentioned measurement positions, the battery and inverter efficiency cannot be calculated individually. Consequently, the mean battery and inverter efficiency 𝜂̲¯𝑏𝑎𝑡,𝑖𝑛𝑣 was calculated with the compressor consumption power 𝑃𝑐𝑜𝑛𝑠 and the battery power 𝑃𝑏𝑎𝑡 measurement values (Equation (7)):

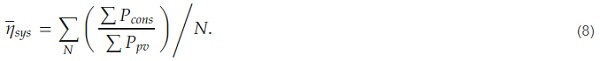
The mean system efficiency 𝜂̲¯𝑠𝑦𝑠 was calculated with the compressor consumption power 𝑃𝑐𝑜𝑛𝑠 and the photovoltaic power 𝑃𝑝𝑣 measurement values (Equation (8)):
It should be noted, that necessarily the following relation holds: 𝜂̲¯𝑠𝑦𝑠=𝜂̲¯𝑚𝑝𝑝·𝜂̲¯𝑏𝑎𝑡,𝑖𝑛𝑣.
The theoretical system efficiency 𝜂𝑡ℎ can be calculated from the data sheet efficiencies of the MPP-tracker 𝜂𝑡ℎ,𝑚𝑝𝑝, battery 𝜂𝑡ℎ,𝑏𝑎𝑡, and inverter 𝜂𝑡ℎ,𝑖𝑛𝑣 (Equation (9)):
![]()
To determine the loading status of the battery, an additional parameter was defined: The mean battery voltage 𝑉¯(t) as a function of day time t. It was calculated from the voltage values measured at a specific day time by averaging these values over all days in a given month by (Equation (10)):

2.4. System Simulations
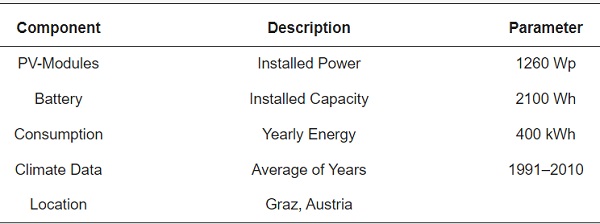
One segment of the COOLSKIN system simulations was performed with the software PV*SOL to evaluate the maximum possible output of the setup and to appraise the magnitude of photovoltaic curtailment [33]. The parameters and components were entered into PV*SOL as close to the real mock-up system as it was feasible (see Table 2). The simulation was conducted with these components and with the additional setting of a theoretical grid connection. With this simulation, the amount of PV power that was theoretically supplied to the grid could be used to assess how much of the generated PV-power was lost due to curtailment when the battery was full and neither cooling nor heating was required. Additionally, the power used from the grid to supply the load and battery showed how much power the PV-system failed to provide.
Table 2. Input parameters of the COOLSKIN simulation performed with the tool PV*SOL [33].
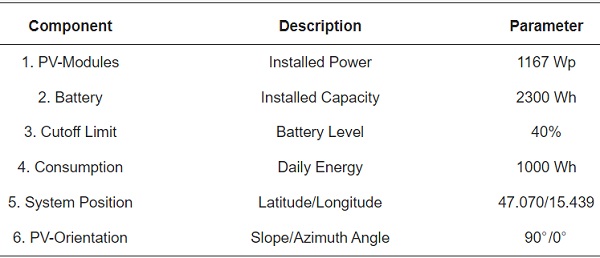
Another simulation of the COOLSKIN system was conducted with the tool PVGIS, maintained by the European Commission. Details concerning the PVGIS simulation input parameters can be seen in Table 3. This simulation allowed to investigate the estimated power production and battery performance for an off-grid PV-system. In comparison to PV*SOL, PVGIS allows one to simulate a decentralized system with a battery in cases of underproduction (no fulfilment of load demand) and estimates the PV curtailment. The information was of high value to interpret the down time of the COOLSKIN system and the loss of efficiencies compared to the theoretical possible yield.
Table 3. Input parameters of the COOLSKIN simulation performed with the online-tool PVGIS [34].
3. Results
3.1. Case Studies
The following subsections cover the main observations and outcomes of the COOLSKIN system during clear, cloudy, and overcast sky conditions. Based on the sky-status quantification of Abawi [35] each day was classified into clear, cloudy, or overcast sky conditions. Because there was no absolute standard for classifying days in a similar manner, the thresholds were determined by investigating the present data thoroughly. For this classification, the daily peak irradiation 𝐻̂^, the mean value of daily irradiation 𝐻¯, and the extent of daily irradiation fluctuations 𝐻̃˜ (Equation (2)) were used. Since peak and mean values are smaller in winter months, different limits for the classification were set: Lower limits were applied for November, December, and January while higher limits were used for all other months. All limits for classification can be found in Table 4 and were set based on example days and the quartiles of each parameter.
Table 4. Threshold parameters for the sky condition classification. The level of monthly average daily irradiation is denoted as 𝑅𝑎𝑑, the maximum daily irradiation as 𝐻̂^, the mean daily irradiation as 𝐻¯, and the irradiation fluctuation as 𝐻̃˜.
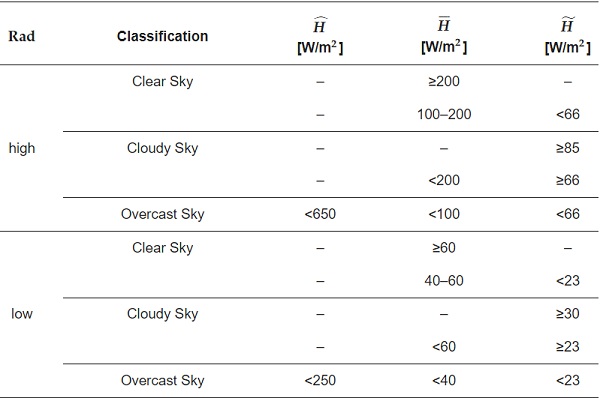
The overcast sky condition is e.g., defined by a small peak irradiation, i.e., 𝐻̂^ < 650 W/m2 (higher limit) or 𝐻̂^ < 250 W/m2 (lower limit) together with small mean irradiation and small amount of fluctuations. A higher mean radiation indicates clear or cloudy sky, depending on whether the amount of irradiation fluctuations due to changing cloud cover is small or high, respectively. Thus 𝐻̃˜ enables one to distinguish clear and overcast from cloudy sky conditions since on clear and overcast sky days, the irradiation fluctuates less compared to cloudy sky days.
In total, 395 days of system operation were used for categorization. A total of 36% of the days were clear sky, 39% of days were a cloudy type, and 25% of days were overcast type. For each of these conditions a representative day was chosen as a case study and an in depth investigation of the battery states and temperature levels was performed. The three days were chosen in the beginning of September 2018 since the weather conditions in this time period allowed selecting representative days close to each other.
3.1.1. Clear Sky Performance
Typically days with a clear sky condition have the highest available amount of solar energy. The main characteristics of clear sky days are a high daily sum and peak of irradiation as well as an almost bell-shaped irradiation power curve. A representative day with a clear sky condition (9 September 2018) is visualized in Figure 4 with the irradiation peak 𝐻̂^𝑐𝑙𝑒𝑎𝑟 = 725 W/m2 with a mean 𝐻¯ = 221 W/m2 and an irradiation fluctuation 𝐻̃˜𝑐𝑙𝑒𝑎𝑟 = 63 W/m2. Minor troughs that occur over the course of the day are caused by slight cloud cover and shading of the pyranometer by surrounding objects.
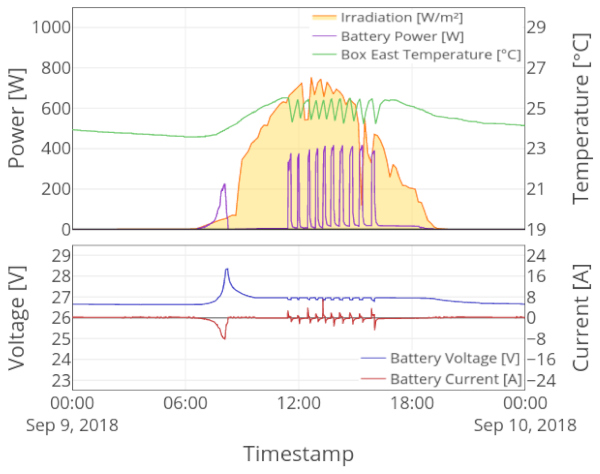
The battery processes in the lower part of Figure 4 indicate that in the morning hours, the MPP-tracker adjusted the photovoltaic operating point to deliver up to 8.2 A current to rapidly recharge the battery. Because the temperature did not exceed the threshold of 25 ∘C, the battery could be fully charged to the cut-off voltage of 28.4 V. At 11:26 h for the first time that day the temperature exceeded the upper threshold of 25.5 ∘C at which point the compressor is powered at around 200 W to keep the temperature between 21 ∘C and 26 ∘C. Over the course of the afternoon, about every 15 to 20 min, the compressor was powered to keep the thermal comfort conditions of the test room. Throughout the representative clear sky day only one three phase charge cycle was initiated since the battery voltage always remained above a float voltage of 23 V.
In order to avoid over and undershooting temperatures because of the expected reaction time of the temperature regulation system, cooling or heating was initiated before the thermal conditions exceeded the thresholds. During the representative clear sky day with outdoor temperatures of 26.2 ∘C the test room temperature was held between 23.6 ∘C and 25.5 ∘C, achieving a TLFF of 100.0%. In comparison to the conditioned test room, the reference room temperatures varied between 26.0 ∘C and 28.5 ∘C with a daily mean temperature of 27.0 ∘C.
3.1.2. Cloudy Sky Performance
A predominant characteristic of cloudy sky conditions is the vigorously fluctuating irradiance with peaks similar to clear sky days. This behavior seems to result in a lower sum of irradiation compared to clear sky days. Over the course of the cloudy sky day (5 September 2018) a peak 𝐻̂^𝑐𝑙𝑜𝑢𝑑𝑦 = 728 W/m2 was reached with a mean global irradiation 𝐻¯ = 169 W/m2 and a mean irradiation fluctuation 𝐻̃˜𝑐𝑙𝑜𝑢𝑑𝑦 = 126 W/m2. The typical flickering irradiation trend and other component parameters for cloudy sky conditions can be seen in Figure 5.
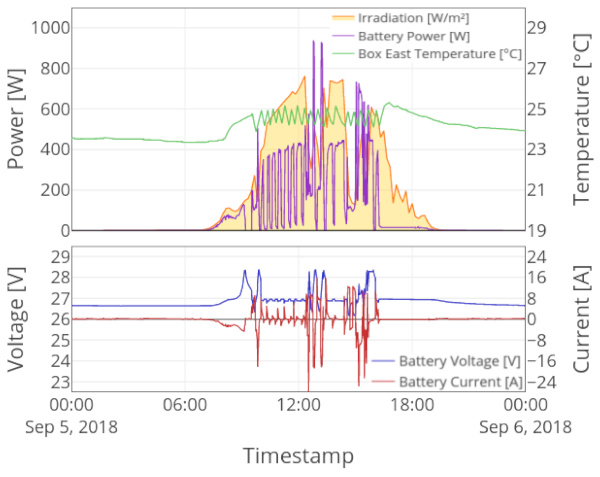
The representative cloudy day started with similar initial system conditions as the clear sky day and a battery voltage of 26.7 V. At 06:40 h, the MPP-Tracker activated the photovoltaic modules to fully charge the battery at bulk-mode. Because of increasing exterior and therefore also rising interior temperatures in the morning, the compressor was powered at 9:32 h for the first time that day in order to cool the test room. After 10 min of 220 W to 323 W AC-power usage, the battery voltage decreased from 27.4 V to 26.3 V. Consequently the battery was charged again in bulk-mode until the voltage level reached the upper threshold. For the next three hours, the system stayed in float-mode since continuous charging and discharging of the battery occurred, because of ongoing need for temperature regulation. Afterwards, three more full charge cycles were initiated with float-modes in between.
The test room frequently exceeded the temperature threshold which caused the MPP-Tracker to regularly activate the compressor in order to provide cooling and to keep the temperature below 26.0 ∘C. This continuous energy demand resulted in periodic charging and discharging of the battery. The test room temperatures varied between 23.4 ∘C and 25.3 ∘C with a mean of 24.1 ∘C, while the reference room reached temperatures from 25.5 ∘C up to 29.1 ∘C with an average of 26.8 ∘C. Throughout the representative day during a cooling scenario, the thermal load of retaining a temperature below the threshold was fulfilled all the time, i.e., TLFF was 100%, despite the maximum outdoor temperature of 27.8 ∘C.
3.1.3. Overcast Sky Performance
Overcast sky days have the least amount of available solar energy of all observed sky conditions. The selected typical overcast sky day (1 September 2018) reached an irradiation maximum of 𝐻̂^𝑜𝑣𝑒𝑟𝑐𝑎𝑠𝑡 = 198 W/m2, a mean global irradiation 𝐻¯ = 41 W/m2, and a mean irradiation fluctuation 𝐻̃˜𝑜𝑣𝑒𝑟𝑐𝑎𝑠𝑡 = 39 W/m2. On overcast days, usually little cooling is needed as can be seen in Figure 6.
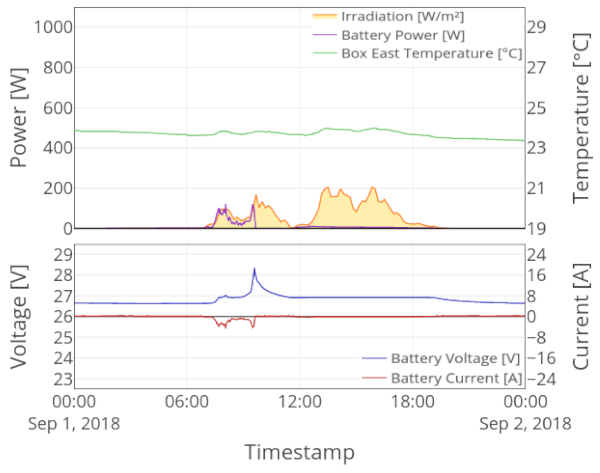
The representative overcast day started with similar initial system conditions as the clear and cloudy sky days and a battery voltage of 26.7 V. Figure 6 depicts that the MPP-Tracker switched to bulk-mode and charged the battery with the available photovoltaic energy at 06:43 h. Due to low amounts of solar energy, this charging process almost took three hours to increase the battery voltage from 26.7 V to 28.4 V. As soon as the battery reached the maximum voltage at 09:35 h, the charge controller initiated the absorption-setting by switching to constant voltage mode. During the rest of the afternoon and evening, the battery voltage did not decrease to the disconnection threshold and no additional charging cycle was initiated.
Over the course of the day the test room temperatures decreased from 23.8 ∘C to 23.4 ∘C while the reference room showed a temperature decline from 26.7 ∘C up to 26.0 ∘C. The higher temperature level of the reference room, despite the lower outdoor thermal conditions with a maximum of 19 ∘C, indicates that warm previous days were responsible for the elevated interior temperature. Due to insulation, the thermal conditions of both the reference and test room only gradually decreased with a time shift. TLFF of 100% shows that the test room temperatures were constantly between the desired thresholds and that it was not required to power the compressor.
3.2. System Performance
Several parameters allow one to estimate the systems performance. The loading behavior of the battery allows one to estimate the electric circuitry and regulation of the system and the curtailment allows to gain information about the battery size. The TLFF allows to consider the passive shading and active cooling effect in contrast to heating scenarios, while the efficiencies give an overall impression. The respective parameters and simulations are presented in the following sections.
3.2.1. Battery
During the data examination of the COOLSKIN system, a flickering behavior of the battery voltage was noticed for some days. In some cases the solar power was too low to properly charge the battery but it was sufficient to raise the battery voltage to the safety threshold of 25 V causing the load to reconnect and instantly discharge the battery again. This provokes the battery to toggle continuously between the load disconnection and reconnection voltage thresholds. This kind of phenomenon occurs most of the time under cloudy weather conditions or during colder months when the system was operated in heating mode. The unique characteristic of the battery voltage during these scenarios was used to identify days with this undesired state.
Another characteristic system behavior can be derived from the mean daily battery voltage 𝑉¯(t) calculated by Equation (10), which was analyzed for the considered time period (see Figure 7). The first observation is that the peak voltage was reached around 08:00 h or slightly thereafter since the thermal load for cooling scenarios is delayed compared to the global irradiation. This is visible in the case studies of the three representative days shown above. Photovoltaic power was available shortly after the sun rose but the room temperature started to increase only later in the morning. Therefore, the battery could be charged before cooling was required. As cooling was often required in the afternoon, the gained energy was not always sufficient to recharge the battery completely, the battery voltage was usually below full load status in the mornings. Throughout the day the voltage level should be slightly higher compared to the night since available solar energy is used to charge the battery. This was also observed in the chosen days.
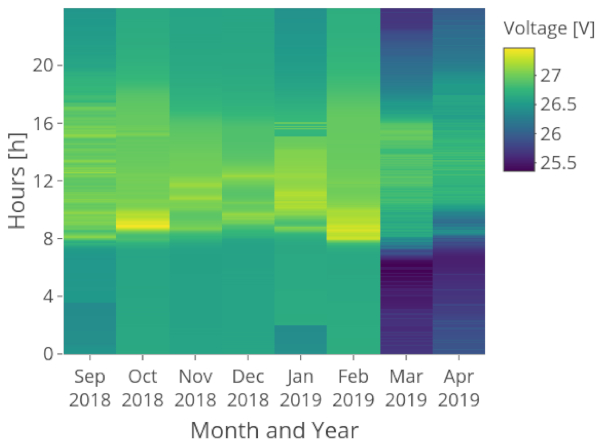
During the colder months, low battery voltage during the night is naturally expected since heating demand is high. Figure 7 shows the battery voltages of the cold season of the years 2018 and 2019. Throughout March and April 2019, battery voltage was low during the night and moderate over the course of the day. This characteristic indicates, that the room was also heated during the night and the MPP-Tracker attempted to charge the battery over the course of the day. From November to February inclusive, however, the system was deactivated most of the time due to restructuring of the heat-pump and cooling cycle. During these situations heating was done by an external source to avoid damage by freezing. The day-night characteristics for cool days with heating therefore does not show in those months.
3.2.2. Energy Production and Curtailment
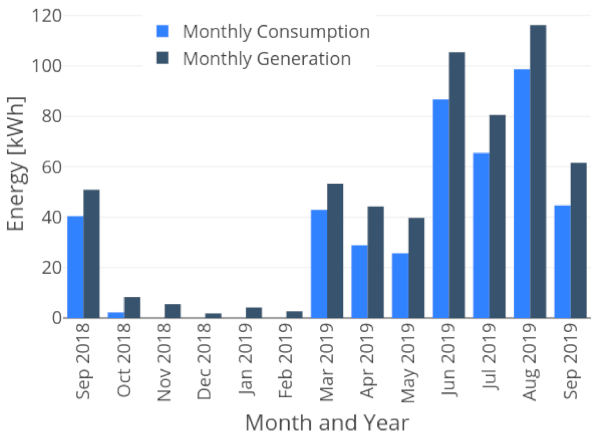
The amount of energy that was used by the system related to the amount of energy that could have been produced was determined. Values of the measured production 𝐸𝑚𝑒𝑎𝑠 and the theoretical available PV-energy 𝐸𝑡ℎ are provided in Table 5 on a monthly basis. During the months with higher solar irradiation with available data (from March until September), the PV-modules generated about 40 kWh to 120 kWh electrical energy per month. With about 60 kWh to 105 kWh, the theoretically available photovoltaics energy was about 5 kWh to 30 kWh per month higher than real generation.
Table 5. Monthly energy data for the measured photovoltaic generation energy 𝐸𝑚𝑒𝑎𝑠, the theoretically available photovoltaic energy 𝐸𝑡ℎ, the simulated photovoltaic energy with PV*SOL 𝐸𝑠𝑖𝑚, and corresponding curtailment values 𝑝𝑐𝑢𝑟𝑡 (authors’ own table, data: AIT, ZAMG, and PV*SOL results [33]).
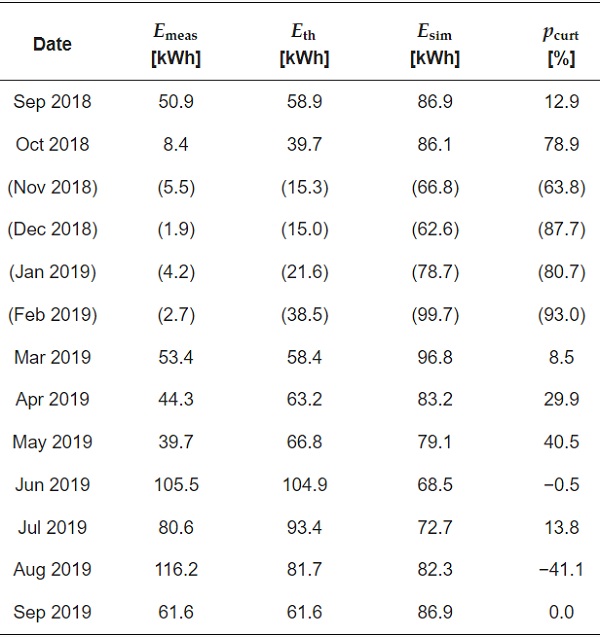
During months with lower solar irradiation (October until February), 𝐸𝑚𝑒𝑎𝑠 was significantly lower compared to 𝐸𝑡ℎ where approximately 2 to 8 kWh were produced by the PV-modules and theoretically about 15 kWh to 40 kWh could have been generated based on the available solar irradiation. The difference between 𝐸𝑚𝑒𝑎𝑠 and 𝐸𝑡ℎ resulted in unused energy of about 63 to 93%. There are several reason for the low performance characteristic during the months with lower solar irradiation, but it was mainly caused by the partial deactivation of the system.
Also for times of operation, the difference in available and used energy clearly indicates that the system did not utilize the available solar energy according to its photovoltaic module capacity. The main cause of this deviation was based on the properties of the COOLSKIN system: Photovoltaic power could only be used if the battery needed to be charged or the load to be supplied. Due to this PV-curtailment, only a fraction of the theoretical available PV-energy was used. The result can also be seen in Figure 8.
The estimated percentage of lost energy due to PV curtailment 𝑝𝑐𝑢𝑟𝑡 was calculated based on Equation (5) and can be found in Table 5. For the month of September 2018, a value of e.g., 𝑝𝑐𝑢𝑟𝑡,𝑆𝑒𝑝2018 = 12.9% was calculated, i.e., about 13% of solar energy were unused in this month. A significant increase of measured generation energy compared to the theoretical one in August 2019, resulting in a negative value for the curtailment, was most likely due to ground albedo and potential reflection from nearby building structures, which is an artifact of the facade type of the PV-generator.
Note again, that the month of November and December 2018 as well as January and February 2019 were months of partially or total missing of active load, due to maintenance work on the system. Thus, these months show quite high values of curtailment which do not reflect the real demand-supply situation. These values are therefore in parenthesis in Table 5.
The curtailment was also calculated for the whole considered time period with 𝑝𝑐𝑢𝑟𝑡,𝑜𝑣𝑒𝑟𝑎𝑙𝑙 = 35.9% of lost energy. Because this parameter was influenced by the partial deactivation of the system during the colder months, 𝑝𝑐𝑢𝑟𝑡,𝑜𝑣𝑒𝑟𝑎𝑙𝑙 𝑓𝑖𝑙𝑡𝑒𝑟𝑒𝑑 = 15.8% was calculated where the months of November 2018 until February 2019 were not considered.
Additionally, the PV*SOL simulation of the COOLSKIN system with a theoretical grid-connection enabled another method to estimate the electric energy lost due to curtailment of the photovoltaic modules. In this model the electric energy supplied to the grid indicated the amount of unused solar energy in the COOLSKIN system. Remember, that the real setup is an autonomous system without grid-connection. Based on this simulation, the amount of electric energy unused due to curtailment of the photovoltaic modules was about 𝑝𝑐𝑢𝑟𝑡,𝑜𝑣𝑒𝑟𝑎𝑙𝑙 𝑠𝑖𝑚 = 53.0%.
The simulation with PVGIS was performed in order to further estimate the curtailment of photovoltaic modules. In Figure 9 the result of the PVGIS simulation is visualized where the “Energy output” represents the theoretical energy generated by the PV-modules and the “Energy not captured” shows the amount of energy not used due to a fully charged battery. The simulation shows that in cooler months the energy output is comparable, or even higher than the not captured energy. In warmer months the energy output was simulated with about 30 kWh/month, and considerably higher energy that is not captured, e.g., about 50 kWh in March or April. This would account for a total of about 80 kWh of available energy for warmer months, which is in the range of the measured data or data simulated with PV*SOL (see Table 5).
The energy output during the months was limited to 1 kWh/day in order to resemble the average daily consumption of the COOLSKIN system. From March until September, the PVGIS simulation results indicate that the battery was fully charged about 88% of the time. The drop in energy not captured in June is perhaps caused by specific weather conditions with a higher occurence of cloudy days. In general the PVGIS simulation indicates that the photovoltaic modules are able to provide sufficient energy for the estimated daily load of 1 kWh/day. Still, a larger proportion of the potential energy is not captured due to PV-curtailment.
![Figure 9. Theoretical energy output simulation of the COOLSKIN system estimated with the tool PVGIS [34].](/sites/default/files/inline-images/Fig9_175.jpg)
3.2.3. System Efficiency
The system efficiency presented in this section does not include the PV-module efficiencies which are about 11.0% to 15.5%, as declared by the supplier [31]. The values can be found in Table 1. In comparison to this, the effective conversion efficiency of the PV modules was determined by measurement to be: 𝜂̲¯𝑐𝑜𝑛𝑣 = 6.3% (Equation (1)). This value is in good agreement with the expectations.
The system efficiency given here deals with the total system efficiency form the electric energy gained until the load. As stated above, the efficiencies were calculated for times, where the operation conditions allowed to determine the efficiency from PV modules to battery, from battery to load as well as from PV module to load, respectively. Due to the system setup, it was not possible to measure the efficiency of single components to a higher degree of detail, as the battery could not be bypassed, i.e., only joint energy production and consumption for system parts—not single components—was therefore analyzed.
In the case of the COOLSKIN technology, every interposed component has an impact on the overall efficiency (Figure 2). The mean MPP-tracker efficiency 𝜂̲¯𝑚𝑝𝑝 (Equation (6)) resulted in 97.7% and the mean battery and inverter efficiency 𝜂̲¯𝑏𝑎𝑡,𝑖𝑛𝑣 (Equation (7)) resulted in 75.7%. In total the calculated mean system efficiency 𝜂̲¯𝑠𝑦𝑠 (Equation (8)) resulted in 73.9% while the theoretical system efficiency 𝜂𝑡ℎ (Equation (9)) was 85.0%. Based on these percentages the most significant result that emerges from the data is that major losses occur between the conversion of the battery power through the inverter to the AC-compressor. Throughout the simulation with PV*SOL with components close to the COOLSKIN system a total efficiency 𝜂𝑠𝑖𝑚.𝑠𝑦𝑠 of 68.8% was estimated.
3.2.4. Thermal-Load Fulfillment Factor
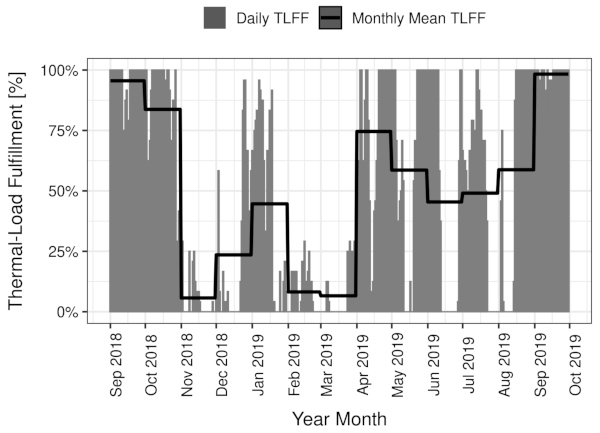
In order to evaluate the system performance, the thermal-load fulfillment 𝑇𝐿𝐹𝐹 was calculated following Equation (3) for each day, as well as for the full month. The results for the TLFF of the COOLSKIN system on a daily and monthly basis are depicted in Figure 10. Especially for cooling scenarios during warmer months from May until October, the load to keep the temperature below 26 ∘C was fulfilled 81.5% of the time. Throughout the colder time period from November until April, keeping the temperature above 21 ∘C was fulfilled 31.7% of the time. Overall, keeping the thermal comfort conditions between 21 ∘C and 26 ∘C was fulfilled with 50.3% of the considered time period from 1 September 2018 until 30 September 2019.
4. Discussion
In this article the monitoring data of the installed COOLSKIN out-door test facility is reported for the time period between 1 September 2018 and 30 September 2019. Overall a considerable amount of heating and especially cooling demand could be decentrally fulfilled with photovoltaic energy. During the case studies for cooling scenarios it was found that during clear and overcast sky conditions the load correlates very well with the photovoltaic yield. In comparison to that, during cloudy sky days a lower amount of irradiation is available but the outdoor temperature level and consequently the thermal load is similar. This results in uncertain load-fulfillment and the system highly relies on the battery to buffer the fluctuating irradiance. Such a scenario can cause an undesired flickering state of the battery voltage which occurrs repeatedly over the considered time period. Especially edge case scenarios with previous warm days followed by cloudy days might be straining for the battery system and can result in temperatures exceeding the thresholds. In general, the system efficiency calculations show promising results.
The case study analysis provides important information concerning the performance during different sky conditions. For the clearest sky days, enough solar energy was available to supply the compressor sufficiently and simultaneously keep the battery at a safe voltage level. Another predominant characteristic for clear sky conditions is the frequently occurring curtailment of the PV-modules induced by the MPP-Tracker, when the battery is fully charged and no cooling is required. This indicates that with the presented setup, a substantial amount of solar energy cannot be used for electricity production.
In contrast to this, cloudy days generally exhibit a higher usage of the available solar energy since the battery is constantly discharged when the irradiance is low and charged as soon as the amount of irradiation increases. Undesired flickering of the battery voltage could be observed when a warm summer night is followed by a cloudy sky day. Potential negative impacts on the battery life and other affected system components can be expected. In order to avoid this behavior in the mock-up setup, the battery cut-in voltage threshold of 25 V could be increased. In a real setup, an increase of the PV size and the battery capacity could potentially decrease the occurrence of under-supply and flickering system states [36]. In contrast to this Nevertheless, COOLSKIN is a system designed to operate primarily during cooling scenarios and therefore, the benefit of increased PV and battery capacities is questionable. The high load fulfillment for keeping the room below 26 ∘C∘C indicates that optimized control strategies could also minimize the occurrence of flickering states. Additionally, with respect to increasing the battery capacity, it must be considered, that the battery is rarely fully charged, space is limited inside the facade construction and the current cost of batteries seems uneconomical [37,38,39].
Due to a low outdoor temperature level, overcast sky days correlate very well with the load during cooling scenarios. On overcast sky days the interior temperature usually does not exceed the upper threshold of 26 ∘C. Consequently, no cooling of the interior space is required and the small amount of available solar power can be used to charge the battery. Similar to cloudy sky conditions, in some scenarios it can be expected that a series of hot clear sky days is followed by an overcast day. This indicates that the outdoor temperature level is already elevated which can cause the room temperature to increase despite the overcast sky conditions. In that case, the system almost entirely depends on the battery to provide enough energy to fulfill the required load.
The main defining parameter for the COOLSKIN system performance is the thermal-load fulfillment factor. The results indicate that the system operates in a superior way during cooling scenarios. Throughout days with increased temperatures, the amount of solar irradiation tends to be equally higher. Consequently, the photovoltaic modules are able to produce more energy which is used to power the compressor in order to provide cooling. The low thermal-load fulfillment in June 2019 was caused by hot outdoor temperatures followed by days with cloudy sky conditions. During these climate conditions, the system is not always able to keep the temperature below 26 ∘C because the generated PV-power is low, while thermal load for cooling would be required. The unfulfilled thermal conditions during the end of July and beginning of August were caused by sensor maintenance instead of specific climate conditions. The issue could be resolved at around 14 August from which the system worked again as intended with a high load fulfillment.
The main optimization potentials resulting from the findings and simulations are improving the system control strategy and implementing usage of excess energy. In a theoretical ideal layout the facade system could be combined with photovoltaic modules on the roof which provide additional energy for light and other electric appliances. Besides the energy production building integrated photovoltaic (BIPV)-facades can also be used as appealing modern architectural designs.
A system specific limitation was the unavailability of bypassing the battery due to partial load capability. This might have been useful in a real setting, when the battery is empty while the temperature exceeds the threshold which would require thermal energy supply [30]. In that case, the bypass would allow to supply the load with currently available solar energy and recover the battery voltage above the security threshold of 25 V in a later stage. In contrast to that, over the course of the considered time period the photovoltaic modules are seldom able to provide 500 W power in order to fully supply the compressor at maximum power, as would be required mainly during heating scenarios.
The results of this article deliver a comprehensive insight on system functioning which allow to infer the main performance characteristics of the COOLSKIN system. Therefore enabling the evaluation of progressive steps for optimization and improvement of this technology in further development phases.
The measurements of June, July, and August 2019 show that the thermal-load could be fulfilled about 50% of the time. Considering the measurement equipment issues during July and August 2019, the results can be expected to be higher. This demonstrates that the cooling capacity of the COOLSKIN system is not only sufficient in the month of September, which was discussed in detail with three selected days, but also in the hot season.
In the literature, the analyses of comparable systems show similar results where the photovoltaic cooling/heating systems are able to cover most of the thermal load during summer months [17,18,19,20]. For example a stand-alone photovoltaic powered air-conditioning system, described by Li et al. [17], is able to cover over 80% of the warmer months thermal-load. Aguilar et al. [18] present results of another comparable system, with the exception of an existing grid-connection, which was able to cover the thermal-load during summer months with a solar contribution of over 65%.
In a former study, a photovoltaic system integrated in an element facade and dedicated for electric consumption in an office room was analyzed [40]. The “MPPF” system could gain 85% load fulfillment over the year, lacking supply especially during winter time. The results of the MPPF project led to the conclusion that massively over-sizing the system components would help to reach higher supply levels. However, throughout this study it was shown that the photovoltaic modules mounted on the south side facade of the office room were sufficient to supply the electric energy required for cooling purposes.
Further work will concentrate on data covering a full year, including summer. Optimally the system would run with slight changes, like a bypass of the battery, which would allow the optimization of system operation. For reasons of space and since the focus of the COOLSKIN system is on cooling, profound case studies for heating scenarios were not addressed in this article.
The findings of this study as well as previous work of Selke et al. [36], Brandl et al. [28], Rennhofer et al. [29], and Ge et al. [41] support the idea that this technology can be used as an efficient autonomous cooling system and additionally provide freezing protection during colder months. Considering all mentioned characteristics, the autonomous and environmentally friendly system COOLSKIN could establish a conceptual design for near future office-buildings.
5. Conclusions
Over the course of this article the electric, thermal, and climatic monitoring data of the installed COOLSKIN out-door test facility was analyzed for the time period between September 2018 and September 2019. The facade technology consisted of an autonomous photovoltaic-powered system for cooling of interior spaces, with no external energy sources required. The measured data were used in order to evaluate the electric performance of the facade-integrated photovoltaic cooling system.
First, clear-, cloudy-, and overcast-sky conditions were defined, representative days for each scenario selected, and evaluated in detail. Considerable amount of cooling demand could be decentrally supplied, although the different sky conditions did have an impact on system performance. The COOLSKIN system efficiency was evaluated with about 74% which was in good agreement with the simulated value of about 69%, while both values were lower than the theoretically expected value of about 85.0%, calculated from the data sheet efficiencies of the components.
One important result is that the operating points set result in a cyclic start-stop behavior of the system. Such a behavior suggests that the PV and/or the storage system do not optimally match in power and capacity for a certain supply-demand scenario. Field testing (winter and summer operation) demonstrated that: (i) Contribution to cooling/heating with up to 250 W continuous power in partial load operation of the compressor or intermittently 500 W can be provided, (ii) behavior in bad weather periods is critical for heating cases due to battery voltage drop, (iii) critical behavior at lower discharge limit depends on the system configuration and was almost not apparent in the field test in the cooling scenario, and (iv) the cooling case correlates well with PV yield or in delay with the stored energy provision.
One of the main defining performance parameters concerning the COOLSKIN system was the thermal-load fulfillment factor. Keeping the temperature below 26 ∘C was achieved with 81.5% of the time from May until October, which indicates a promising mode of operation. The low percentage of 31.7% for heating scenarios of heating-load fulfillment emphasizes the fact that the system operates in a superior way during cooling scenarios. Nevertheless, partial system deactivation due to maintenance have influenced the results obtained during the colder months. Therefore, heating scenarios were merely considered as reference in order to gain first insights on heating performance.
Over the course of this study considerable insight has been gained with regard to understanding COOLSKIN operation characteristics. The results of this article will foster future development of facade intergrated cooling solutions.
Author Contributions
Conceptualization, M.R., T.B. and H.R.; methodology, M.R. and T.B.; software, T.B.; validation, M.R., H.C.L. and H.R.; formal analysis, T.B., H.R. and M.R.; resources, M.R., D.B., T.M., A.H., G.Ú.; data curation, M.R., T.B. and H.R.; writing—original draft preparation, T.B., H.R. and M.R.; writing—review and editing, T.B., M.R., D.B., T.M., A.H., G.Ú., H.C.L. and H.R.; visualization, T.B.; supervision, M.R., H.R. and H.C.L.; project administration, M.R.; funding acquisition, M.R. All authors have read and agreed to the published version of the manuscript.
Funding
This research was funded by Program line Energieforschung (e!MISSION) 1. call, 2015–2019 supported by the Klima-und Energiefond of FFG grant number 848871 within the project COOLSKIN–Autarkes Kühlen über Gebäudehüllen.
Institutional Review Board Statement
Not applicable.
Informed Consent Statement
Not applicable.
Data Availability Statement
All data reported is visualized in the manuscript.
Acknowledgments
Open-access funding was provided by BOKU Vienna Open Access Publication Fund.
Conflicts of Interest
The authors declare no conflict of interest. The funders had no role in the design of the study; in the collection, analyses, or interpretation of data; in the writing of the manuscript, or in the decision to publish the results.