Authors: Ioannis Katsivalis & Stefanie Feih
Source: Glass Structures & Engineering | https://doi.org/10.1007/s40940-022-00194-w
Abstract
Glass/steel adhesive joints are being used increasingly in the construction industry as they offer significant structural advantages over conventional mechanical fastener approaches. However, adhesive joints are also known to be sensitive to moisture diffusion into the bondline, which reduces the interfacial bonding strength for hybrid glass/steel substrates. The effect of moisture on the performance degradation of glass/steel adhesive joints has been successfully predicted assuming adhesive property degradation but requires experimental determination of the affected moisture ingress zone.
This study utilizes a multi-physics numerical approach implemented via the commercial finite element code Abaqus 2020, which firstly simulates moisture ingress into the adhesive/glass interface and subsequently couples the diffusion effects with a cohesive zone modelling approach for damage initiation and propagation. The numerical predictions are calibrated against experimental data on glass/steel Double Cantilever Beam (DCB) specimens, which are bonded with a ductile methacrylate adhesive (Araldite 2047–1).
The modelling approach is then validated against the experimental response of large double lap shear joints of a significantly different bondline geometry. It is demonstrated that the numerical model successfully predicts the critical exposure time for partial to complete joint degradation enabling the development of engineering guidelines for life-time prediction of various joint geometries.
1. Introduction
Adhesive joints are being used increasingly across a wide range of engineering sectors including automotive, marine and construction industries (da Silva et al. 2018). They offer significant advantages over conventional mechanical connections as they distribute the stresses over the area of the joint, minimise stress concentrations and do not increase the weight of the structure (thereby reducing its cost). In addition, adhesive joints can be used in glass structures since they lead to uninterrupted facades providing aesthetic advantages, while also avoiding drilling of glass which is known to introduce micro-cracks and surface flaws. However, the use of adhesive joints for glass/steel structures is still an unproven method, and the topic of active research interest with several experimental and numerical studies published over the last few years (Katsivalis et al. 2018, 2019; Machalická et al. 2018; Van Lancker et al. 2018; Marchione et al. 2022).
One of the main reasons that limit the use of adhesive joints is their sensitivity to environmental conditions such as moisture and high/low temperatures (Adams et al. 1997). Numerous studies have tried to understand the degradation mechanisms and quantify the effect on the bonded joints. A common approach is to study the degradation mechanisms observed in the bulk adhesive under the effect of environmental exposure. The adhesive can experience different types of degradation such as plasticization (Brewis et al. 1982; Ellis and Karasz 1984), hydrolysis (Xiao and Shanahan 1997; Costa et al. 2017) and swelling (Popineau et al. 2005; Viana et al. 2017), which can lead to a change of its mechanical properties (Viana et al. 2016). This approach generally neglects the influence of the substrate’s interface on the joint degradation, which is significant in the case of glass surfaces (Katsivalis et al. 2020b).
To accurately predict the effect of environmental exposure on adhesive joint strength via numerical modelling is challenging. Different modelling approaches can be used (including bulk adhesive and interface degradation) utilising damage parameters or knockdown factors (Abdel Wahab et al. 2002; Bordes et al. 2009; Li et al. 2016; Yang et al. 2019). The knock-down factors are mostly extracted by performing tensile dogbone tests on the adhesive or tests on single/double lap shear joints and by comparing key mechanical properties (stiffness/failure stress for the adhesive and maximum load capacity for the joints) before and after exposure. The use of knock-down factors assumes that the rate of degradation of the mechanical properties of the joints, such as the stiffness or the failure load, is similar. However, studies have shown that the different mechanical properties degrade at different rates (Viana et al. 2016). As a result, it is postulated that studying the degradation of the interface can provide a better insight of the performance of the joint.
Fracture specimens (such as the double cantilever beam) have been used to evaluate interface degradation after environmental exposure (Costa et al. 2017, 2018; Viana et al. 2017). However, the limitation of this methodology is that it is sensitive to the geometry and the size of the specimens. Smaller specimens are affected more since moisture ingress affects a larger part of the joint, while larger joints are affected less. In addition, in this approach, the damage in the adhesive layer is non-uniform as the moisture enters the joint from the sides and gradually diffuses toward the centre. Therefore, different areas of the adhesive layer experience different moisture concentrations. As a result, a single damage law does not accurately represent the adhesive layer.
More sophisticated approaches have also been utilised where the degradation of the interface was directly evaluated, thereby leading to relevant constitutive laws for numerical modelling (Wylde and Spelt 1998; Loh et al. 2002; Liljedahl et al. 2006; Heshmati et al. 2017). For instance, Heshmati et al. (2017) used open faced Double Cantilever Beam (DCB) and End Notched Flexure (ENF) tests and measured the cohesive laws under modes I and II at different degradation stages directly. Liljedahl et al. (2006) used open faced Mixed Mode Flexure (MMF) and Notched Coating Adhesive (NCA) specimens to directly evaluate the interfacial fracture toughness degradation and then utilised a cohesive zone modelling approach to predict damage and failure in the adhesive joint. These studies focused on metal and composite adherends and have not yet been expanded to glass substrates and hybrid joints.
Recent work in glass/steel adhesive joints by Katsivalis et al. (2020b) used two different methods to predict environmental damage due to elevated temperatures and humidity. The first approach was based on continuum mechanics and assumed the degradation of the joints was solely caused by the degradation of the adhesive properties. In the second approach, a cohesive zone model was used. Here the damage was assumed to be caused by interfacial degradation, and the cohesive laws were extracted by performing modified versions of the DCB/ENF tests on representative glass/steel specimens. However, in both cases the degradation of the adhesive and the interface was assumed to be uniform throughout the bonded area, and the gradual moisture diffusion from the edges of the specimens was not considered.
In this paper, the cohesive zone modelling approach presented in Katsivalis et al. (2020b) is revisited and expanded to lead to the development of a multi-physics modelling approach for the simulation of moisture diffusion, coupled with subsequent property degradation and damage initiation and propagation for glass/steel adhesive joints. More specifically, instead of assigning a uniformly degraded property to the interface, Fickian diffusion is assumed from the edges of the bonded area moving toward the centre of the joint.
The approach can therefore consider the varying edge to adhesive area ratio of the tested joint geometries and related differences in moisture ingress progression for various joint geometries. The modelling approach is first calibrated on hybrid DCB specimens for different exposure times to establish appropriate interface bonding laws and later validated on large hybrid double lap shear joints. This unique multi-physics modelling approach is shown to be able to predict moisture ingress and damage in glass/steel adhesive joints with varying bonded area geometry. Guidelines for partial and complete failure times can then be established for joints based on numerical simulations.
Methodology
Substrate and adhesive characteristics
The hybrid substrates used in this study were low carbon mild steel (S275R) and float tempered glass. It is worth noting that for all tests performed, the stresses generated within the steel substrate were significantly lower than the yield stress of the material, and steel was therefore considered to be an elastic material. Similarly, the glass substrate is a brittle material, which was modelled with elastic properties as no progressive damage occurs.
The adhesive used in this study (Araldite 2047-1) is a 2-part ductile methacrylate. The adhesive was allowed to cure for one week at ambient conditions as per manufacturer recommendations before exposure and testing. According to the manufacturers’ datasheet, the glass transition temperature (Tg) of the methacrylate is 80 °C under these curing conditions. Details about the mechanical properties of the adhesive in the aged and unaged state can be found in Katsivalis et al. (2020b) and Katsivalis et al. (2019). Curing of hybrid joints at room temperature minimized the issue of residual stress build-up in the joint due to a mismatch of thermal expansion of the substrate materials.
Experimental methodology
Environmental conditioning
Industry standards for the environmental exposure of glass adhesive joints do not exist. The environmental conditioning cycle was therefore based on ETAG 002 (European Organisation for Technical Approvals, 2012), and information on the experimental campaign can be found in detail in Katsivalis et al. (2020b). ETAG 002 is a European guideline for the use of sealants in buildings, and in the absence of other relevant standards it was decided that this provides an adequate environmental exposure protocol. Similar testing protocols based on ETAG 002 have been used extensively in glass related research (Machalická et al. 2018; Silvestru et al. 2019; Drass and Kraus 2020).
Three different types of samples were exposed to the environmental conditions (bulk specimens, double cantilever beam specimens and double lap shear specimens) and the geometry and details for each specimen type can be found in this section. The samples were fully immersed in demineralised water for a period of 3 weeks at a temperature of 45 °C according to the ETAG guidelines. The temperature was controlled by using a universal oven, while a digital thermometer was used to ensure consistent conditions. After the exposure period, the specimens were removed from the chamber, dried, and conditioned for 24 h at ambient conditions according to the ETAG guidelines.
Diffusion coefficient measurements
Gravimetric measurements were used for measuring the diffusion coefficient of the adhesive at 45 °C (water immersion), which is the same temperature as utilised for the joint exposure studies. The methodology was based on ISO 62:2008 (ISO 2008). The size of the samples was approximately 60 × 60 mm2, while their thickness was about 1 mm, ensuring one-dimensional diffusion. The weight of the samples was measured prior to exposure and at frequent intervals during exposure. The absorbed moisture concentration was calculated as
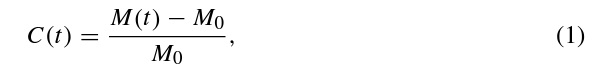
where C(t) is the absorbed moisture, M(t) is the mass at the time of the measurement and M0 is the initial mass. The average measurements based on five samples and the respective standard deviations can be seen in Fig. 1.
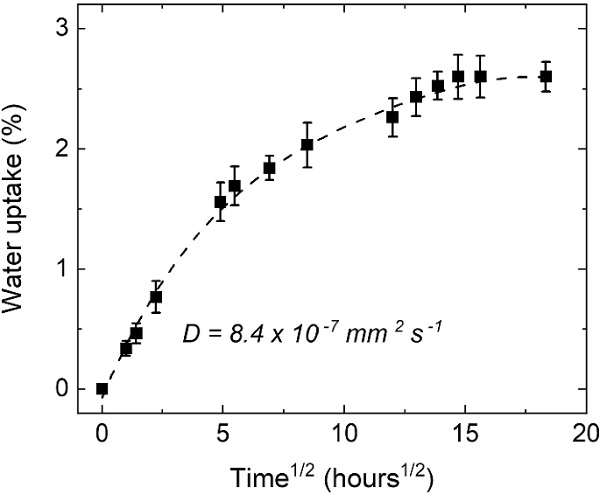
The linear part of the curves of Fig. 1 can be used to calculate the diffusion coefficient of the adhesive as follows in Eq. 2. Here, D is the diffusion coefficient, h is the thickness of the specimens and Cs is the concentration at saturation. The moisture concentration at saturation was determined as 2.6% after three consecutive measurements took place with no significant additional water uptake recorded. The diffusion coefficient for the adhesive material was calculated as 8.4×10⁻⁷mm²/s.
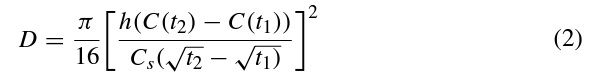
In addition to the diffusion coefficient measurements presented above, a literature review was conducted as per Table 1 to identify diffusion coefficients of adhesives under similar exposure conditions. While all the adhesives reported in Table 1 are epoxy resins, all diffusion coefficient measurements are between 1.9×10−71.9×10−7 and 9.8×10⁻⁷mm2/s9.8×10−7mm2/s, which is in good agreement with the measurements reported in this paper.
Table 1 Diffusion coefficients reported by various researchers for adhesives at similar exposure conditions - Full size table
Double Cantilever Beam testing
The geometry of the hybrid DCB specimen is shown in Fig. 2. The hybrid DCB specimens consist of a glass and a steel arm. The bondline thickness of the DCB specimens was 0.2 mm and was controlled with metallic spacers. To ensure pure mode I loading of the adhesive layer, the bending stiffness of the two arms was matched by adjusting the thickness of the two substrates as per Eq. 3:
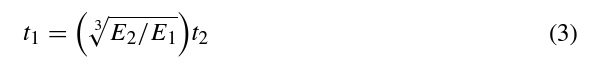
In Eq. 3, E₁,t₁ and E₂,t₂ are the respective Elastic modulus and thickness for each of the DCB arms. The DCB specimens were again exposed to the same conditions as described above (water immersion at 45 °C). It is worth noting that in engineering practice, the edges of the bonded joints should be sealed to avoid moisture ingress. In contradiction of this practice, the edges were not sealed in this work since moisture diffusion was desired to study the diffusion effects in an accelerated manner. Specimens were tested in regular intervals (after 1, 2 and 3 weeks), providing three calibration points for the numerical methodology. The loading of the DCB specimens was displacement-controlled at a fixed rate of 0.5 mm/min, and a minimum of 5 specimens were tested. The load–displacement curves were recorded, and an inverse FE method was used to calculate the critical traction and fracture energy of the interface (see Katsivalis et al. (2020a)).
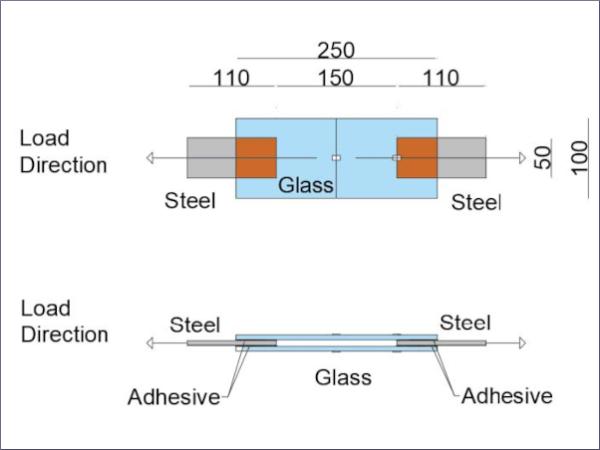
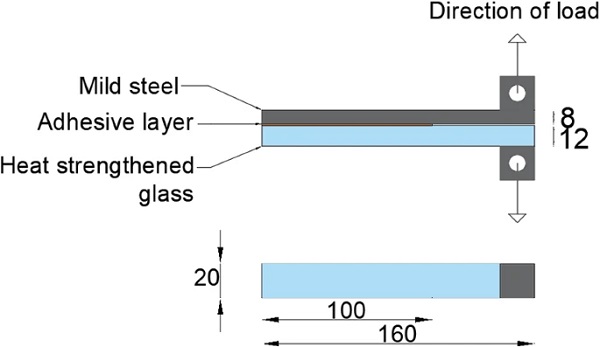
Double lap shear joint testing
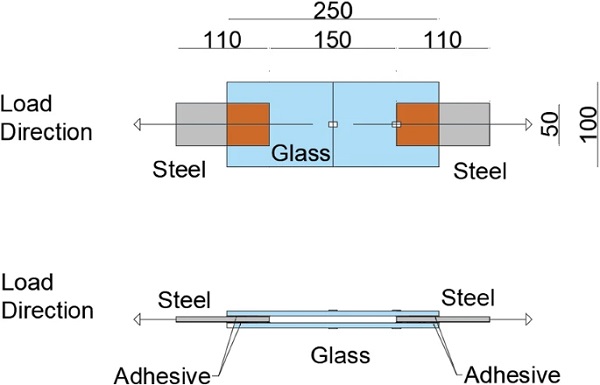
The geometry of the glass/steel double lap shear joint in this work is shown in Fig. 3. The bondline thickness of the double lap shear joint specimens was 0.2 mm and was controlled with metallic spacers. The double lap shear specimens were exposed to the same conditions described above (water immersion at 45 °C) and tested after 3 weeks of exposure. Similar to the DCB specimens, the edges of the double lap shear joints were not sealed as accelerated moisture diffusion was desired to study the diffusion effects. The loading of the joints was displacement-controlled at a fixed rate of 1 mm/min, and a minimum of 5 specimens were tested. During testing, the load–displacement response of the joints was recorded.
Numerical predictive methodology
The multi-physics numerical simulations were based on two different physical processes. The first one is a diffusion process, where the concentration of moisture occurring on the edges propagates to the central part of the joints. Figure 4 presents the diffusion mechanism in the adhesive layer sandwiched between a glass and a steel substrate. There is water concentration C₀ on the edges, which starts to diffuse to the central parts of the joint through the adhesive layer and its interfaces. The diffusion is taking place from all free edges of the specimens.
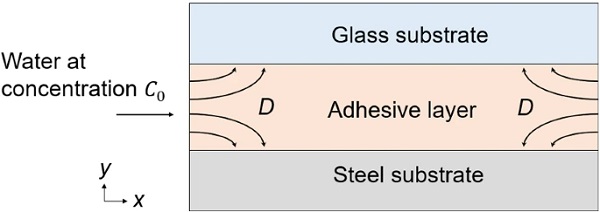
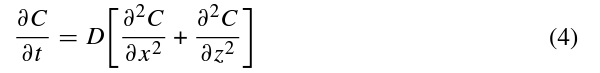
The diffusion process is controlled by Fick’s second law as shown in Eq. (4), where C is the concentration of water, D is the diffusion coefficient and x, z are the position vectors.
It is noted that separate interface and edge diffusion mechanisms are not explicitly modelled, but both events are taken into account together during the calibration of the diffusion coefficient, D. Moisture ingress through-the-thickness of the adhesive layer is assumed to be uniform due to the small bondline layer thickness of 0.2 mm, which is considered small compared to the other dimensions of the adhesive bonding area.
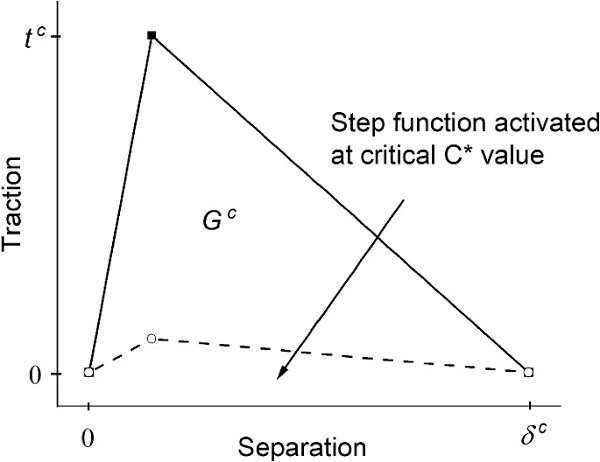
The second process is related to the mechanical response of the joint and—more specifically—of the interface and is controlled by a cohesive zone modelling approach. More details on cohesive zone modelling for glass/steel joints can be found in Katsivalis et al. (2020a). A simple bi-linear cohesive law was used, which correlated the traction and fracture toughness of the interface as shown in Fig. 5 (for both the opening and the shear mode). The quadratic nominal stress criterion was used for damage initiation (Eq. 5), while the linear energetic criterion (Eq. 6) was used for damage propagation in alignment with similar studies on bonded joints (Jung Lee et al. 2010; Campilho et al. 2011; Domingues et al. 2016). In Eq. 5, tn and ts are the values of traction in modes I and II, while
![]()
are the critical values of traction in modes I and II. Similarly, in Eq. 6, Gn and Gs are the values of the interfacial fracture toughness in modes I and II, while
![]()
are the critical values of interfacial fracture toughness in modes I and II.
The degradation of the interfacial properties is expected to vary with the concentration of moisture in the interface, hence resulting in a gradual property change within the bondline. However, measuring the interfacial degradation as a function of the moisture concentration is very difficult to achieve within a bonded joint and was not attempted as part of our work. Therefore, in this paper, a step function is evaluated for its ability to capture the complicated physical phenomenon of gradual property degradation in a simplified manner. As a result, the interfacial properties were controlled by the step function which at a critical concentration C∗ assumed that the affected elements lost all load bearing capacity and did not contribute further to the mechanical joint response. For simulation convergence purposes, the critical traction and fracture toughness properties were assigned values 1000 times lower than those of the unaged state. Figure 6 shows the respective relationship of fracture toughness with moisture concentration.
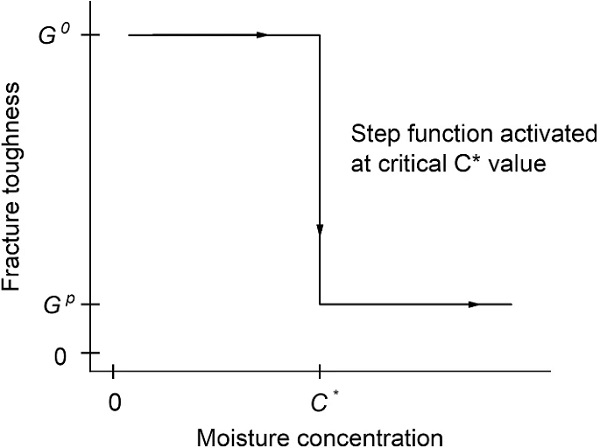
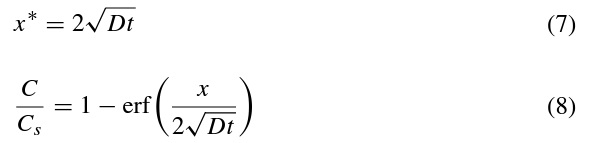
The value of the critical concentration was based on Eq. 7 (applicable to one-dimensional diffusion), which correlates the distance and exposure time to the diffusion coefficient. The value 2√Dt is commonly considered as a characteristic diffusion distance (Carslaw and Jaeger 1986; Bird et al. 2006; Shewmon 2016). The solution to Fick’s second law for one dimensional diffusion with a constant concentration (infinite moisture source in one end) is shown in Eq. 8. Replacing x with x∗ in Eq. 8 gives C/Cs=1−erf(1)≈0.157, where erf(z) is the error function. Therefore, Eq. 7 represents the distance x∗, after time t, where the concentration is at 15.7% (Martínez-Pañeda et al. 2020). The value C∗=15.7% will be used here as the critical concentration at which the step function is activated.
For the numerical analyses reported in this paper the commercial Finite Element (FE) code ABAQUS 2020 (Dassault Systèmes Simulia 2020) was used. The analysis was conducted in two steps. The first step was a heat transfer analysis, which simulated the moisture diffusion utilising the direct analogy between the heat transfer and moisture diffusion processes (Szekeres 2000; Sugiman et al. 2013). The reason why heat transfer analysis was preferred over mass diffusion is related to the multi-physics nature of the problem, since ABAQUS allows for easier dependence of the material properties based on temperature (in contrast to mass concentration, which would in turn require a field variable and a user subroutine). Preliminary numerical studies confirmed an appropriate mesh density and the analogy of the heat transfer and mass diffusion analysis results. The nodal temperature degree of freedom in a transient temperature analysis was shown to be equivalent to the moisture concentration in the adhesive for mass diffusion analysis.
For the heat transfer analysis, 8-node linear heat transfer brick elements were used (DC3D8 in ABAQUS). The time-dependent analysis determined the temperature distribution (i.e., the distribution of moisture concentration) in the adhesive. The second step (mechanical deformation) of the multi-physics model started by introducing the thermal profile (i.e., moisture concentration) as a predefined field. Cohesive elements are not mesh size sensitive provided an adequate number of elements are used throughout the degradation zone (Dragoni and Mauri 2000; Feih and Shercliff 2005). A preliminary sensitivity study was conducted which showed that a cohesive element size of 0.05 mm was able to represent the fracture process zone adequately.
Mesh compatibility between the two steps was ensured and in the second step the mechanical properties of the adhesive layer were moisture dependent as described in Fig. 5. In the mechanical deformation step, the adhesive layer was modelled with 8-node three dimensional cohesive elements (COH3D in ABAQUS), while the substrates were modelled with 8-node three dimensional linear solid elements (C3D8R in ABAQUS) with linear elastic material properties. The numerical input parameters required for the developed models are summarised in Tables 2 and 3. The extraction of the numerical inputs for the cohesive laws was discussed in earlier work (Katsivalis et al. 2020a, 2020b), and the same input parameters are used in the current work.
Table 2 Numerical input parameters for the substrate materials - Full size table
Table 3 Numerical input parameters for the adhesive bondline of Araldite 2047-1 - Full size table
Results
Moisture diffusion evaluation and failure prediction in the hybrid DCB specimen
The extent of the affected area in the joints is numerically defined by the diffusion coefficient D and the critical concentration C∗. The diffusion coefficient measured in Sect. 2.2 was validated against the DCB specimens by comparing the load–displacement curves after 1, 2 and 3 weeks of exposure. The main evaluation variable that was used for the validation was the characteristic peak load of the DCB specimen, which is most sensitive to the active width of the specimen (i.e., the width that has not been affected by moisture).
An additional evaluation variable was the stiffness response of the specimen, which is most sensitive to the active length of the bondline. Figure 7 shows the corresponding load–displacement curves of the DCB specimens for 1, 2 and 3 weeks of exposure and the FE predictions with the measured value of the diffusion coefficient, while Table 4 compares the measured and predicted characteristic peak load of the DCB specimens. It is shown that applying the measured value of D from the moisture diffusion tests on the bulk adhesive underestimates the effect of the moisture on the joints, and the discrepancy becomes more evident with increasing exposure time.
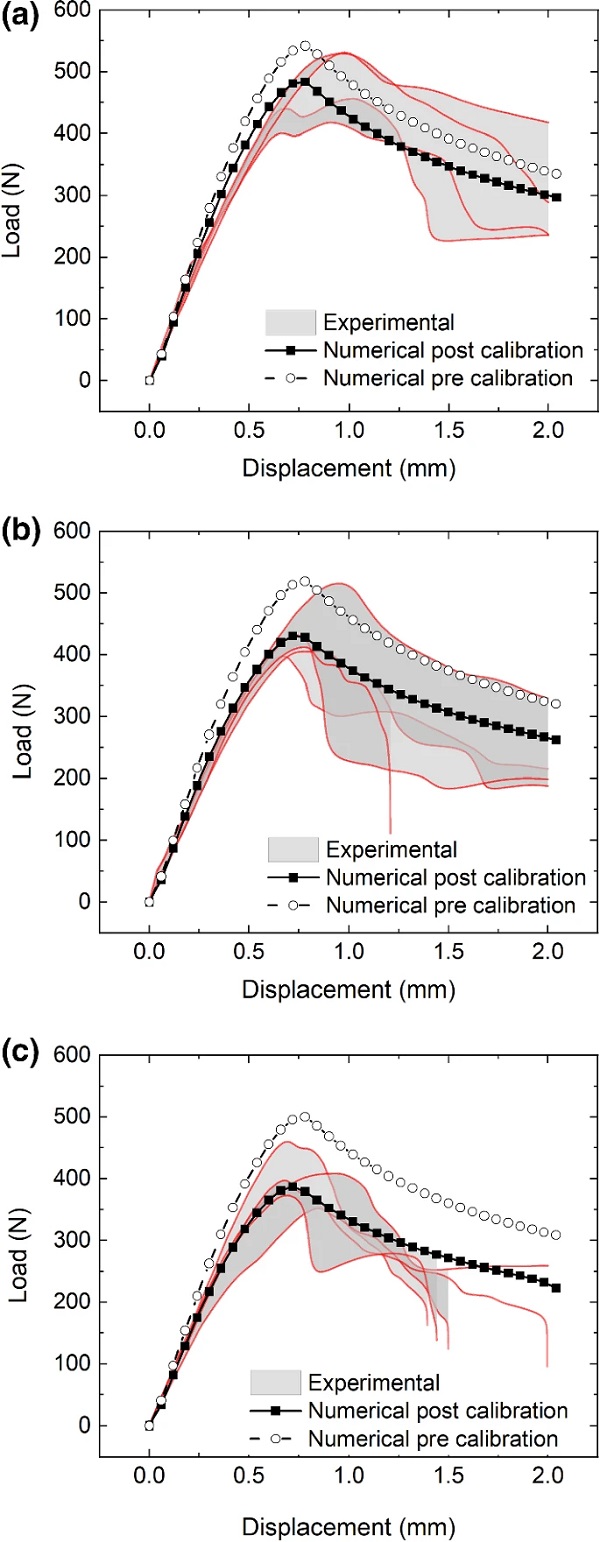
Table 4 Predicted peak load of the DCB specimen before and after the calibration of the diffusion coefficient. Values in bold represent significantly improved simulation outcomes - Full size table
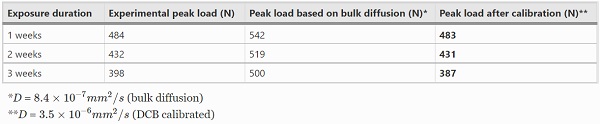
Several researchers have noted that the diffusion coefficient in a joint is typically higher than the diffusion coefficient measured for the bulk adhesive due to a fast diffusion path existing in the joint interface (Viana et al. 2016, 2017). It was therefore decided to calibrate the value of DD based on the available experimental data for the hybrid DCB specimens. The calibration was achieved by minimising the differences between the experimental and numerical characteristic peak load on the load–displacement curve of the DCB specimens. Figure 7 also shows the load–displacement curves of the DCB specimen after 1, 2 and 3 weeks of exposure with the calibrated value of the diffusion coefficient, D=3.5×10⁻⁶mm²/s. The calibrated value is almost 4 times higher compared to the measured value highlighting that an accelerated diffusion path is shown to exist at the glass/adhesive interface. It is shown that the stiffness prediction is also significantly improved following calibration of the diffusion coefficient based on characteristic peak load.
Table 4 shows the predicted peak loads of the DCB specimen after the calibration of the diffusion coefficient and highlights the improvement of the predictions. There is further experimental evidence for this proposed accelerated interface diffusion given that all exposed joints were shown to fail at the glass/adhesive interface rather than at the steel/adhesive interface (Katsivalis et al. 2020b). It is furthermore well known that glass / polymer surfaces are susceptible to moisture ingress (Van Lancker et al. 2016; Machalicka and Eliasova 2017).
Figure 8 compares the moisture concentration profiles after 1, 2 and 3 weeks of exposure as observed experimentally by stress whitening after testing (left) and predicted by Fickian diffusion analysis via numerical FE simulations (right). Both experimental and numerical observations show an increase in the diffusion distance from the surrounding joint edges with increasing exposure time, hence validating the numerical boundary conditions.
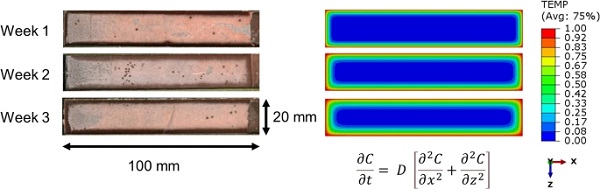
The experimental data provides valuable insight regarding the underlying moisture diffusion and interface degradation mechanisms. Figure 9 shows the moisture-affected areas of the bondline in detail as observed experimentally and predicted numerically after 3 weeks of exposure. The active bonded area is calculated after the failure of the specimens by quantifying the percentage of the adhesive layer that develops stress whitening during loading and deformation. Stress whitening can be observed by comparing the colour along the edges of the bondline with the colour in the central parts of the specimen.
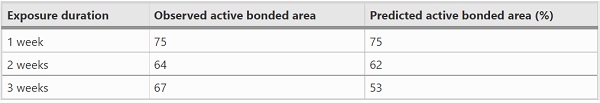
The ring forming with the darker colour toward the bond zone edges can be interpreted as the area affected by moisture ingress, which does not resist crack growth, while the area with the lighter colour is representative of the adhesive that yields and develops stress whitening while resisting crack growth due to its remaining strong interface bond. ImageJ software (Schneider et al. 2012) was used to calculate the experimentally active bonded area as 67%, while the corresponding numerical prediction was 53%. Table 5 summarises the observed and predicted active bonded areas after 1, 2 and 3 weeks of exposure. It can be seen that the agreement between numerical and experimental analysis can be considered as good in the first two weeks, while it reduces significantly for week 3.
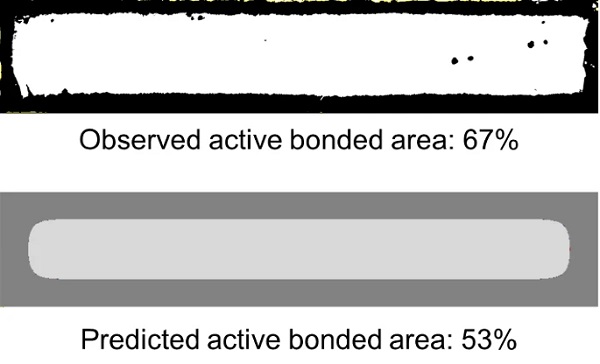
Table 5 Observed and predicted active bonded areas for the DCB specimen at different time intervals - Full size table
The difference between the experimental and numerical data indicates that the change between the aged/unaged state does not abruptly change as per our numerical assumption in Fig. 5, but instead occurs more gradually. As a result, it is speculated that as the diffusion event progresses, even areas which develop stress whitening are affected by moisture ingress and contribute less to the crack propagation. Therefore, the accurate size of the affected bonded area cannot be easily determined experimentally from this approach of image analysis, hence complimentary numerical analysis is required.
Figure 10 shows the stress distribution in the adhesive layer at peak load based on the numerical predictions after 1, 2 and 3 weeks of exposure. Figure 11 shows the stress distribution in the adhesive layer in various intervals during the loading stage after 3 weeks of exposure. Both figures show that the central parts of the joint resist the loading, while the elements that are found at the edges have been affected by the step function and do not resist the crack propagation. The affected area increases with exposure time. Once the peak load is reached, elements are removed from the analysis simulating the crack growth that is taking place.
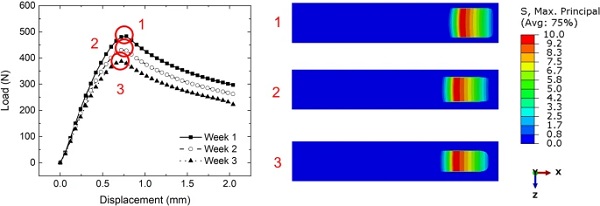
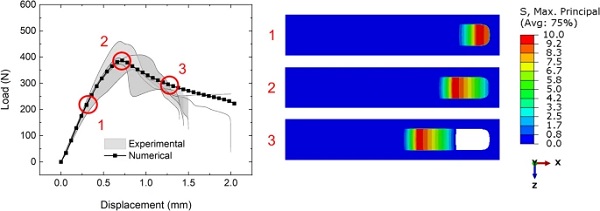
Lastly, Fig. 12 presents the peak load predicted for the DCB specimen as a function of exposure time. A single calibration process is conducted for the three different exposure times to achieve best fit, with the numerical predictions shown to fall within the standard deviations of the experimental measurements. The agreement reinforces the validity behind using the step function, which simplifies the underlying physical diffusion and damage phenomena. The figure shows that the diffusion zone increases until about 7 weeks, when most of the DCB bonded area is affected and the numerical load drop rate accelerates due to the 2-D nature of the diffusion problem. It is worth noting that a similar effect was observed experimentally as additional DCB specimens were prepared for testing after 6 weeks of exposure but did not retain sufficient strength to allow for handling and testing. This shows that experimental moisture diffusion led to complete interface degradation as predicted by the numerical model for a similar time frame.
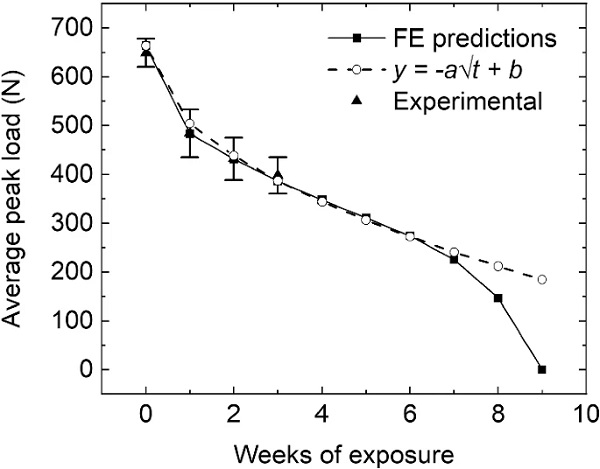
In addition, Fig. 12 shows the strength degradation trend as a function of the exposure time and shows that the peak load drop has a linear relationship with the square root of time as shown by the parabolic 1-D function fitted in the graph. The parameter a in the parabolic function is related to the diffusion coefficient and the geometry of the specimen, while the parameter b is related to the unaged strength of the specimen. It is noted that the good agreement with the 1D diffusion prediction allows for the analytical prediction of the performance of any joint design after different exposure times by having just two experimental data points for fitting of the two unknown parameters a and b (i.e., unaged strength and strength after a given exposure time).
Moisture diffusion evaluation and failure prediction of the Double Lap Joint
The multi-physics approach calibrated in the previous section on the hybrid DCB specimens is further validated by comparing numerical and experimental results for the double lap shear joints under tension. The experimental test set-up was described in Sect. 2.2. The double lap shear joint experienced the same exposure conditions as the bulk adhesive and the hybrid DCB specimens. It is worth noting that the bonded area size for the double lap shear joint is 50 × 50 mm2, which is a significantly different bond area geometry and size compared to the hybrid DCB specimens.
The comparison of the experimental and numerical data is based on the predicted and recorded failure load. The modelling methodology remains unchanged as the moisture diffusion analysis generates the concentration profile for the present joint geometry, which then again acts as the predefined field in the mechanical deformation stage. The same calibrated diffusion coefficient as per Table 4 was applied.
Figure 13 shows the moisture distribution profile of the adhesive layer after 3 weeks as predicted numerically and compares the profile with the experimental observations. The actively bonded area during testing is again calculated via image analysis by observing the parts of the joint with stress whitening development, while excluding the outer edges that have not undergone plastic straining. The difference in the observed and predicted active bonded area size for the double lap shear joints is highlighted via image analysis using imageJ to enhance the contrast of the experimentally failed interface. The numerical prediction was 67%, while the experimental measurement was 79%. It is noted that the presence of excess adhesive on the edges of the joint area generated during the manufacturing process is assumed to contribute to the uneven moisture ingress progression from the edges.
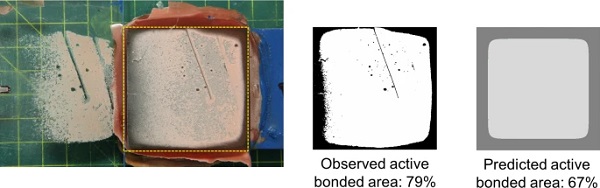
Figure 14 shows the load–displacement curve of the double lap shear joint under tensile loading. Both the unaged and aged responses are presented, while the figure also shows the distribution of stresses in the adhesive layer of the aged joint at various loading intervals. The reduced stiffness and peak load are both well captured based on the earlier parameter calibration.
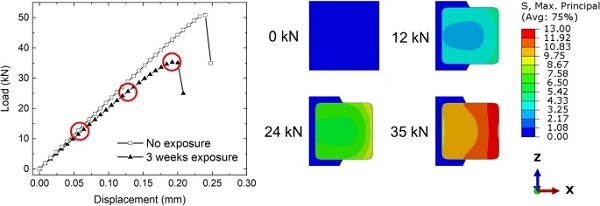
As before, the moisture-affected interface elements do not resist loading as they are either deleted early in the analysis or their stress is close to zero. The central parts of the adhesive layer resist loading in a ductile manner as defined by the cohesive interface law. Damage initiates from the corners of the joint as there are initial stress concentrations present in these locations, which get redistributed to the load-bearing central areas of the joint. Similar observations about the interface damage progression were reported by the authors for the unaged joints, showing that the change in failure load due to moisture diffusion is only due to the reduced size of the active bonded area, which resists loading, but not due to changes in the damage progression itself.
In addition, as shown in Sect. 3.1, the simple analytical solution based on a parabolic diffusion function can be used to predict the strength of a given joint design after any exposure time. Its two unknown parameters (a and b) can be calibrated via two experimental data points. Figure 15 compares the analytical and numerical predictions for the double lap shear joint under tension. The two experimental data points (no exposure and 3 weeks of exposure) are used to calibrate the analytical solution, which results in very good agreement with the numerical predictions, thereby validating the predictive analytical approach.
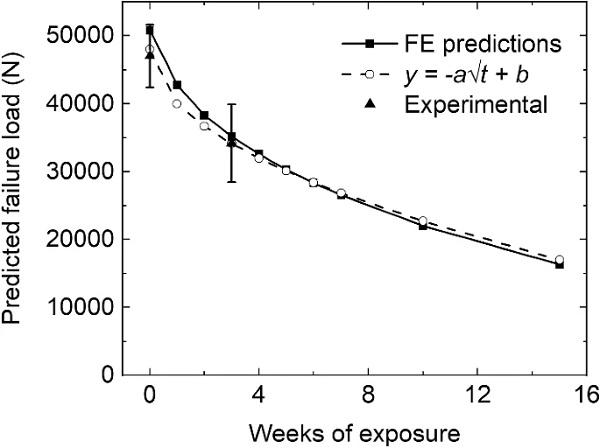
Table 6 compares the experimental observations with the numerical predictions utilising the multi-physics methodology and with the numerical predictive methodology developed earlier in (Katsivalis et al. 2020b), showing significant improvements in the failure prediction of the joints under uniaxial loading (presented in detail in this paper). In our earlier work, each exposure time needed the characterisation of a new cohesive law through the calibration of DCB and SLB specimens, while the method proved to be inherently dependent on bondline size and geometry as the damage was assumed to be uniform throughout the bonded area. The current modelling approach couples the cohesive laws at virgin state (no exposure time) with the diffusion process and therefore provides a more robust methodology, which can predict the joint degradation more accurately with reduced DCB/SLB testing and calibration requirements.
Table 6 Experimental and numerical failure loads for double lap shear joints under different load cases after 3 weeks of exposure. Values in bold represent significantly improved simulation outcomes - Full size table
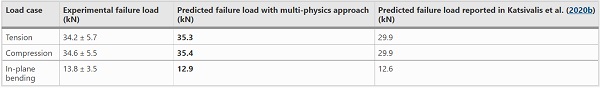
Using the same calibrated parameters of the FE modelling approach as derived for the DCB specimens, the numerical methodology was further validated by comparing experimental observations and numerical predictions on the two other previously reported load cases (compression and in-plane bending) resulting in adhesive failure following moisture degradation. For brevity, these load-cases are not discussed here in detail; all required details on the respective test set-up details can be found in Katsivalis et al. (2019). It is worth noting that these predictions are considered independent validation data points as the calibration took place on a different geometry (DCB specimens). The improvement in prediction (as shown in Table 6) is due to the consideration of different moisture diffusion areas for a) the DCB tests used for calibration and derivation of the cohesive zone interface laws and b) the double lap shear joint geometry used for validation as outlined in Sect. 3.2.
4. Discussion
The paper demonstrated that the multi-physics modelling approach produced more accurate predictions compared to previous modelling methods introduced by the authors. The reason behind the prediction improvement is that this model can accurately estimate the size of the active bonded area (based on the calibrated combination of D and C∗ diffusion parameters) and is therefore not sensitive to the size of the bond area.
This addresses the limitations of the previous modelling approach, in which the accuracy of predictions depended on the size of the bonded area when compared to the hybrid DCB specimens utilized to derive the averaged interface laws. It is therefore shown that adding or calibrating a single value (the diffusion coefficient of the adhesive) can lead to the development of more robust and accurate numerical models able to predict the degradation of any size of adhesively bonded hybrid glass/steel joints.
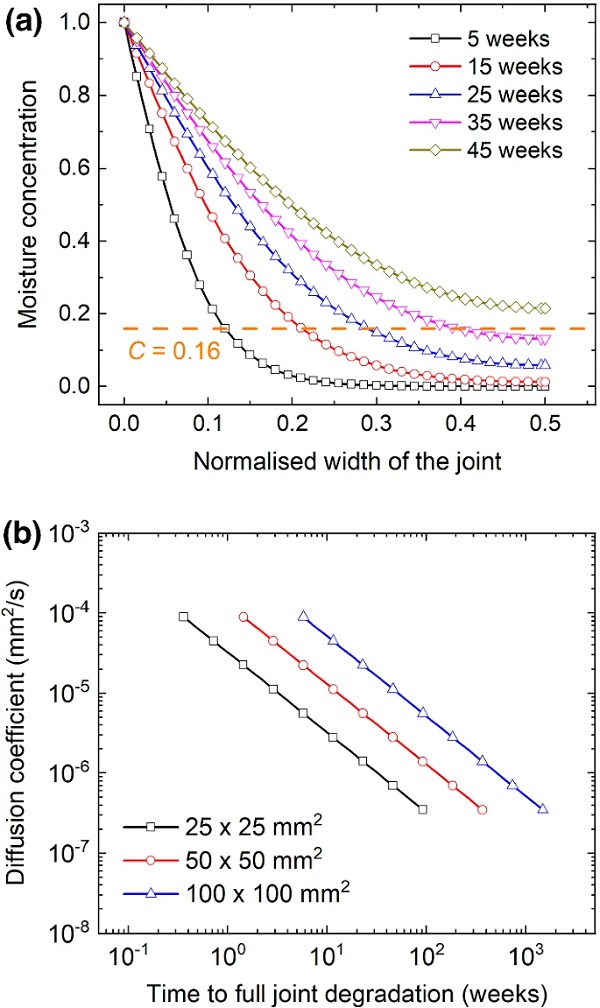
The model can furthermore be utilized to determine the exposure time causing partial or complete joint failure based on the moisture ingress simulation hence allowing for life-time prediction. The double lap shear joint studied in this work was used as a simple example. Figure 16a shows the moisture concentration along the normalised width of the adhesive layer. Considering the joint design and the estimates made in this paper, it can easily be assessed that the joint after 35 weeks of exposure will lose all load bearing ability as all elements will have exceeded the critical concentration and thus will not resist the loading.
However, it is worth noting that the moisture exposure conditions in this paper are based on accelerated testing protocols with much harsher conditions than the ones normally experienced by adhesive joints in engineering structures (especially buildings). Following the same principle, Fig. 16b plots the time required for the complete bondline of the joint to be affected by the moisture ingress, as a function of both the diffusion coefficient and the size of the joint. Such a plot can be used for the life-time prediction of simple adhesive joint designs. A measurement of the diffusion coefficient (as it will be temperature dependent) for operational conditions and the implementation of the presented methodology will then result in a realistic indicator for the life prediction of a given joint design.
It is worth noting that the modelling methodology also has a few limitations. Firstly, it was assumed that the properties of the cohesive elements degrade following a step function at a specific critical concentration of moisture. Realistically, the properties are expected to degrade gradually following a gradient from full capacity to zero capacity. Open faced DCB/ENF specimens could be used to measure the degradation of the interfacial properties at regular intervals and produce a more precise modelling methodology. Nevertheless, it was demonstrated in this paper that a step function is a good approximation of the physical phenomena happening in the joint.
It was also assumed that the moisture diffusion continues uninterrupted until the full saturation of the joints is achieved. However, the steel substrates are susceptible to corrosion in the presence of water. The corrosion process utilises part of the diffusing moisture creating an outgoing flux in the joint. Therefore, at a critical length from the edges of the joint, the incoming moisture flux (due to the water ingress on the edges) will be equal to the outgoing moisture flux (which corrodes the steel substrates). At this point, the diffusion of the moisture slows down and ultimately stops, and the remainder of the adhesive central area is expected to remain unaffected by moisture ingress. The corrosion build-up and estimation of the maximum diffusion zone is considered outside the scope of this study as additional experimental data is required for validation. This is expected to be more relevant in shipbuilding applications, where longer adhesive joints are used which also experience significantly harsher environmental conditions.
Finally, it is worth noting that adhesives are viscoelastic materials and thus their property degradation response is also susceptible to fatigue and creep loading, especially after long exposure and/or loading periods. In addition, the temperature and the strain rate variation are also expected to affect the mechanical properties of the adhesives and ultimately the joint performance. Adhesives generally behave in a more brittle manner at lower temperatures/higher strain rates and in a more ductile manner at higher temperatures/lower strain rates (Siviour and Jordan 2016). However, the stiffness and ductility of the adhesive has been shown to play a critical role in the performance of the joints (Katsivalis et al. 2019). Characterising the viscoelastic effects and implementing those in the presented numerical model was considered outside the scope of this work as all testing was reported under quasi-static, ambient conditions. Nevertheless, it is expected that the presented multi-physics approach is well suited to provide a suitable numerical framework for the consideration of viscoelastic changes following moisture diffusion.
Conclusions
The main conclusions are summarised as follows:
- A combination of the diffusion coefficient D and the critical concentration C∗ can be used to introduce concentration-dependent properties in an adhesive layer. Numerically, the moisture diffusion is modelled with a heat transfer analysis taking advantage of the direct analogy between heat transfer and mass diffusion to facilitate transfer of degradation variables between the two analysis steps.
- The diffusion coefficient of most adhesives for full immersion and temperatures between 40-50 °C is in the region of 3×10⁻⁷ mm²/s. The gravimetric measurements performed in this paper for Araldite 2047-1 indicated that the diffusion coefficient was in the same range, but slightly higher at 8.4×10⁻⁷ mm²/s. However, the calibration on the DCB specimens revealed that the diffusion process in the hybrid joint is about 4 times faster, indicating that an accelerated diffusion path along the glass/adhesive interface is most likely present. It is therefore crucial that the hybrid DCB specimens mimic the same interface conditions as present in the hybrid joint design to correctly predict the interface-related diffusion acceleration.
- After the calibration of the diffusion coefficient and the critical concentration, excellent agreement was achieved during the calibration stage of the DCB specimen for 1,2 and 3 weeks of exposure based on peak load and overall load-displacement traces. The extension of the developed approach and its calibration for varying environmental exposure conditions is easily possible.
- It was shown that the numerically predicted active bond area was generally smaller than the one observed experimentally, especially for longer exposure periods. This indicates that a few areas of the joint might develop stress whitening, but still have some reduced capacity in terms of resisting crack propagation. Therefore, the change of the material properties is assumed to take place gradually and not abruptly as modelled with the current step function.
- The predictive methodology was evaluated on large double lap shear joint specimens with significantly different bond area dimensions for different load cases. The multi-physics modelling methodology led to improved agreement compared to the size-sensitive predictive method that the authors utilized in their previous work.
- The diffusion zone appeared to have a linear relationship with the square root of time for the exposure times investigated. Therefore, a parabolic 1D diffusion function was fitted and was used to predict the performance of the joint designs after different exposure times. The only requirement was to calibrate the two parameters of the parabolic function which were found to be related to a) the diffusion coefficient and joint geometry and b) the initial strength of the joint.
- The multi-physics modelling approach presented above can be used for a detailed life-time prediction of any given adhesive joint design assuming that a) the diffusion coefficient can be calculated and b) the interfacial properties can be established at the virgin state. It is also shown, that by only using a single value for the diffusion coefficient, an estimation for the life-time prediction of any joint geometry can be provided.
References
Acknowledgements
The principal author gratefully acknowledges the funding from the Agency of Science, Technology and Research (A*STAR), Singapore, and the University of Southampton, United Kingdom, that has enabled the conduction of the experimental research data reported.
Funding
Open Access funding provided by the IReL Consortium.
Author information
Authors and Affiliations
School of Engineering, University of Limerick, Limerick, Ireland
Ioannis Katsivalis
School of Engineering and Built Environment, Griffith University, Gold Coast, Australia
Stefanie Feih
Corresponding authors
Correspondence to Ioannis Katsivalis or Stefanie Feih.
Ethics declarations
Conflict of interest
On behalf of all authors, the corresponding author states that there is no conflict of interest.