This paper was first presented at GPD 2019 by Reijo Karvinen and Antti Aronen.
In addition, heat transfer should be locally uniform on both sides of the glass, which is difficult in practice to fulfill. Cooling is the most critical phase: it gives compression in the surface and tension in the mid-region. Arrays of impinging jets are usually utilized for cooling. With this arrangement, the local heat transfer depends on the location of jets and distances between them. Because heat transfer is not uniform over the surface it can cause notable stress differences which are the main reasons for visual faults in glass called anisotropy.
In the paper, the local residual stresses created by impinging jets are solved numerically using the commercial Ansys software. Distributions of heat transfer coefficients are solved with OpenFOAM CFD software. Stress distributions of glasses with different thickness are also compared to measured values of the optical measurement device SCALP in order to check the accuracy of the calculation model. We have noticed that the stress distribution of tempered glass has a similar type of distribution as optical anisotropies stripes or spots. In order to study this connection in more detail anisotropy patterns of a plane polariscope are presented and compared with local retardation values which are calculated by using numerically calculated residual stresses.
Introduction
In a glass tempering process glass is first heated up above the glass transition temperature and then quenched below its glass transition temperature to get residual stresses in the glass. Glass with residual stress is composed of compressive stress in the glass surface and tensile stress in the core of the glass. The glass temperature before quenching must be at a suitable level for quenching: high enough to avoid the breakage of the glass in quenching and low enough to avoid distortions in the glass during heating. This is achieved by proper control of heat transfer.
For the residual stresses, the cooling rate of the glass is important. Typically, the cooling rate is on the level which causes the temperature difference 120-150 °C between the surface and middle plane of the glass at the beginning of the cooling. To get this high cooling rate energy efficiently for different glass thicknesses, the cooling has traditionally been arranged with air jets. Heat transfer of these cooling impinging jets is not uniform but depends on the distance from the jet stagnation point [1,2,3].
This kind of non-uniform heat transfer causes a non-uniform stress pattern to the glass. The stress differences are the reason for the change of the refractive index of the glass which causes visual faults [4]. Recently this so-called anisotropy has been of interest. We can observe stripes or spots in tempered glass in polarized natural light from the clear blue sky.
The main reason is that the stress distribution in glass varies also in other directions as in the thickness direction. This is due to non-uniform convective heat transfer on the glass surface made by impinging jets. The same phenomenon can be used in the inspection of glasses with a plane polariscope, but the evaluation of stresses from polariscope figures is difficult. Similarities between stress variations measured with SCALP and visual observations have been found [5].
The anisotropy of the tempered glass can be seen with the polarized light. If the level of the anisotropy is high the stress pattern can be seen even with the naked eye. This shows that there is polarized light in nature. The polarized light appears in nature due to reflection or scattering of the light [4]. The anisotropy in tempered glass can be also observed by using polarized filters. With filters, even very small anisotropies can be seen. Because the high anisotropy can be seen with the naked eye, it is important to avoid anisotropy in the windows or facades where all visual defects should be avoided.
Importance of heat transfer control of a tempering furnace to glass quality has been observed earlier as anisotropy problems when the low-emissivity glass hit to the market [6,7]. Unsymmetrical heating between the coated side with low-emissivity and another surface can be avoided by using a jet arrangement on the coated side in a heating section. Even if heating is symmetric, too low or high temperature of the glass before the cooling section can create faults such as convex shapes, roller waves, optical failures, and edge bending. During post-processing of float glass, in cooling these distortions are added even heat transfer in cooling is uniform. However, high enough glass temperature is needed to get good residual stresses to tempered glass.
When the glass temperature history, which we can calculate quite reliably assuming that the heat transfer coefficient is correct, is known we can predict also the formation of residual stresses. Because the theoretical models of residual stresses require many experimental material properties [8], the residual stress results are not as reliable as temperature values. The effect of those property uncertainties on stresses is presented in the literature [9]. The same model has also been applied to study the heat soak process [10].
As mentioned above jet arrays are used in order to get high enough average heat transfer coefficients to form required residual stresses. Unfortunately, the heat transfer coefficient of impinging submerged jets is far from a constant value at the surface but varies very much as a function of distance from the stagnation point. Heat transfer is best at the stagnation point but there can be also another peak when a laminar-turbulent boundary layer transition happens. In the literature is plenty of texts dealing with single jets or jet arrays.
Heat transfer depends on many factors such as the Reynolds and Prandtl numbers, the relative nozzle distance to the surface, turbulence level at the nozzle outlet and the nozzle shape, etc. Experiments are mainly made using long tubes with a jet a fully developed velocity profile at the outlet or well-designed short nozzles and the surface temperature is constant or there is a constant heat flux boundary condition. In practical applications, nozzles are usually sharp edge holes in a thin plate. In numerical modeling with CFD, different types of turbulence models have been tested but there does not exist any model which is valid in every case.
Explanation of anisotropy in glass
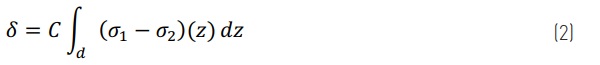
The anisotropy of the refractive index can be explained with the principal stress differences. The main measuring value for the anisotropy is the retardation which is in connection with principal refractive indices ni. Refractive index is also stress σ dependent. According to Wertheim´s law, the relative retardation δ in the two-dimensional problem is
![]()
where C is the photoelastic constant and d is the glass thickness [11]. The photoelastic constant for soda-lime glass is 2.5∙10-12 Pa-1. When the stress distribution changes over the thickness the relative retardation can be integrated over the thickness
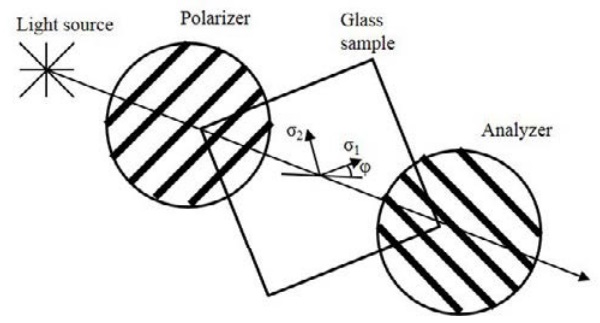
The plane polariscope, the principle of which is presented in Fig. 1, can be used to see the colorful anisotropy pattern when white light is used. In the plane polariscope light is first polarized at the polarization filter. Polarized light passes through the glass with residual stresses where the relative phase shift of components of polarized light forms. Finally, when polarized light with relative phase shift passes through the second polarization filter, which is rotated 90° compared to the first filter, this colorful anisotropy pattern can be seen.
This is called dark-field polariscope. The color depends on the principal stress difference σ1 – σ2 and the angle φ which presents the relative angle between polariscope and the principal stresses. Intensities as a function of wavelengths are obtained from equation
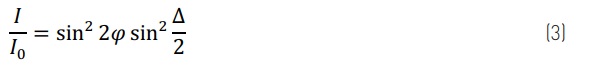
In the above equation, the phase difference
![]()
and λ is the light wavelength [11]. The light intensities are calculated with different wavelengths and the sum of wavelengths with high intensities will show the light color. The different colors for different retardation values are shown e.g. by Aben and Guillemet [11].
Circular polariscope can also be used to see the anisotropy pattern. The circular polariscope is similar to the plane polariscope, but two quarter-wave plates are added between linear polarizers. With circular polariscope, the level of the local principal stress difference can be seen independent of the plate orientation relative to polariscope.
Computational and experimental results of tempered glass
It is a fact that residual stress variation causes colorful spots and stripes in tempered glass. As mentioned above we can calculate residual stress distribution numerically if the variation of heat transfer coefficients is known. The next step is to find the connection between residual stress distribution and anisotropy figures. A more difficult problem, even impossible, is to evaluate residual stresses on the basis of colorful anisotropy figures at the center area of the glass.
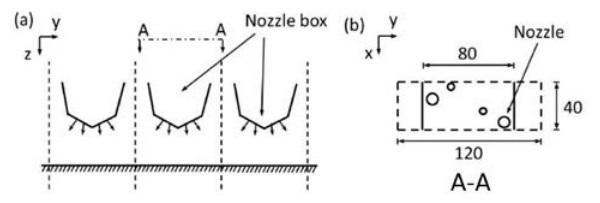
In order to evaluate the validity of calculations, measurements were made in two tempering cases: tempering of 4 mm moving glass and a stationary 8 mm glass under nozzles, which are heated and cooled in a real process furnace. The sizes of the plates were 500 x 500 mm². The nozzle arrangement is shown in Fig. 2. The diameter of smaller nozzles is 4.5 mm and that of larger ones 6 mm.
The over-pressure in air boxes is 880 Pa for 8 mm glass and 7000 Pa for 4 mm glass. The distribution of the heat transfer coefficients is solved with OpenFOAM CFD (Computational Fluid Dynamics) software as in ref. [12]. The ratio of the nozzle-to-plate distance and nozzle diameter is in both cases about 4. It must be noted that in our tempering furnace the nozzles were sharp-edged holes and they were slightly inclined as shown in Fig. 2. The glass moves in the y-direction in Fig. 2.
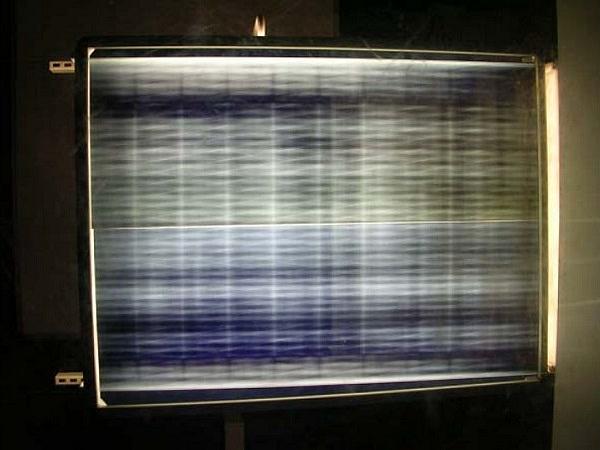
The final anisotropy pattern of the 4 mm and 8 mm glasses are shown in Figs. 3 and 4, respectively. The pattern is the result of the dark-field polariscope. The anisotropy pattern of 4 mm glass in Fig. 3. is quite uniform. There are just dark and some grey areas, except at the edge area where we can see very light areas. The maximum retardation is close to δ = 50 nm. For 8 mm stationary glass in Fig. 4. the anisotropy pattern is much more colorful. The nozzle layout can be seen in Fig. 2. It can be seen from the pattern that the highest retardation values (yellow color) are between the nozzle boxes where the wall jets of adjacent nozzles impinge each other. The highest retardation values are for brown yellow areas where the value of δ is about 430 nm.
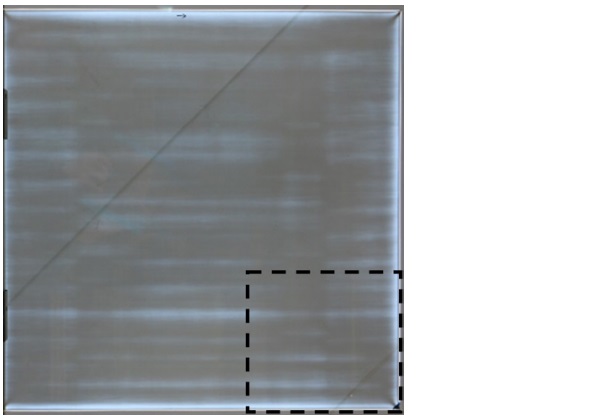
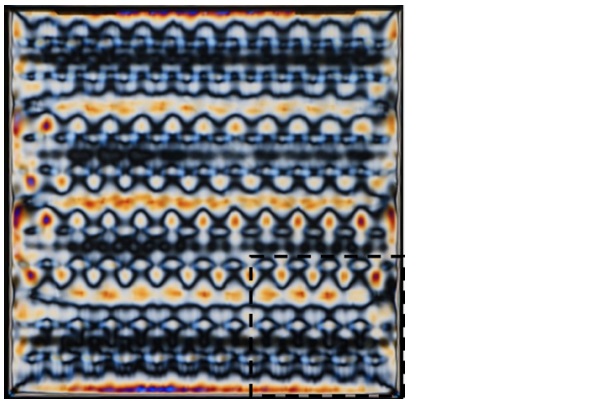
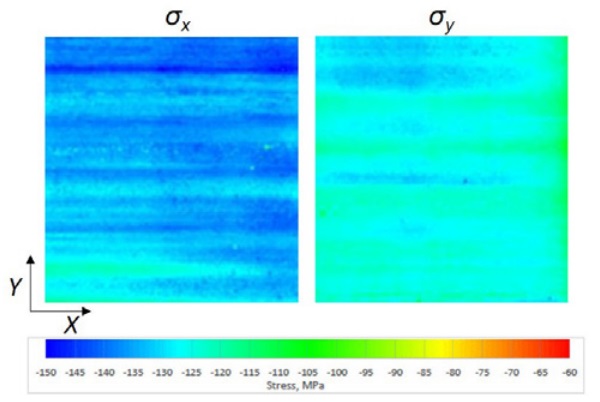
To compare the anisotropy pattern and the stress levels the scattered light polariscope SCALP was used together with CNC coordinate device to measure the stresses in several points of the glass. The measured area was 190x200 mm² at the bottom right corner of the glasses shown in Figs. 3 and 4 with dashed lines. The surface stress pattern of a 4 mm thick glass in the x- and y-directions are shown in Fig. 5.
The stress levels over the glass surface are relatively uniform. There are always small variations due to the non-uniformity of the heating and cooling. For the anisotropy the stress difference between the x- and y- directions is important. For example, the constant 5 MPa stress difference of principal stresses in the plane direction over a 4 mm thick glass gives the retardation value 50 nm. Typically, the highest local stress differences of principal stresses are in the surface, because over the glass thickness there the absolute value of the stress is highest.
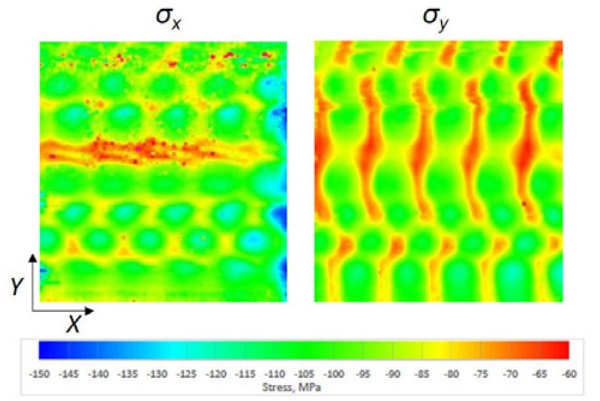
The surface stress patterns for an 8 mm stationary cooled glass are shown in Fig. 6. In these results, similar patterns as the anisotropy patterns in Fig. 4 can be seen. The highest stress differences between the x- and y-directions are around 40 MPa on the glass surface. In the core of the glass, the stress difference is always smaller.
In order to reduce the anisotropy more isotropic the numerical modeling can be used to solve the stress distribution of the glass and then the anisotropy pattern of the glass. To test the modeling approach above two cases were modeled and the surface stress pattern and the anisotropy pattern are compared to the results shown above. The previous studies show that the average stress level is possible to model with numerical methods [9].
First, the distribution of the heat transfer coefficient was modeled by using CFD. The heat transfer model was for the unit area of the nozzle box as shown in Fig. 2b. The physical model is the same as in ref. [12]. Distributions of heat transfer coefficients for single jets were in a reasonable agreement with the results in the literature [1,2,3].
The heat transfer modeling was applied to the surface area below the cooling box in Fig. 2b. Using the obtained heat transfer coefficient distribution, the transient temperature field of the glass was calculated. The solved temperatures were then used to solve the residual stress distributions with FEM (Finite Element Method) using the model in refs. [8,12].
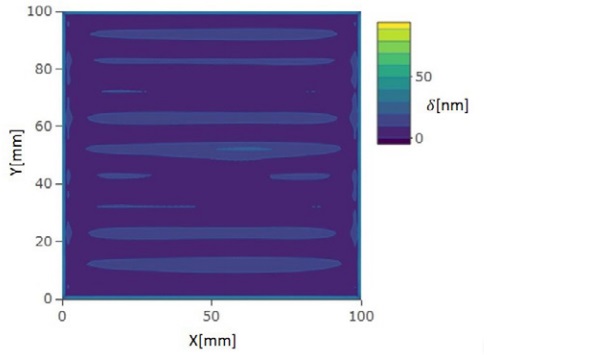
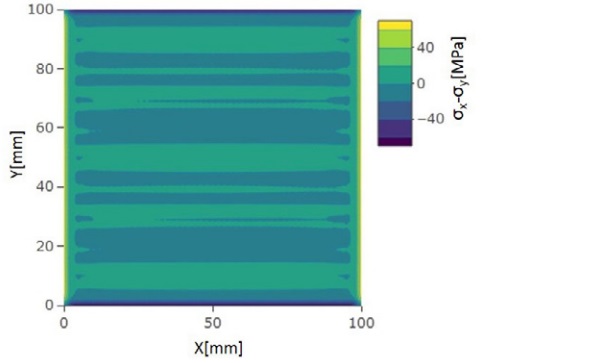
The calculated retardation pattern for the 4 mm glass is in Fig. 7. The maximum values are 20-30 nm which are lower than measured by the polariscope. The highest stress differences in the x- and y- directional stresses (Fig. 8.) are about 2 MPa, which is also smaller than the measured results. However, the calculated anisotropy pattern looks similar to the pattern measured with the plane polariscope.
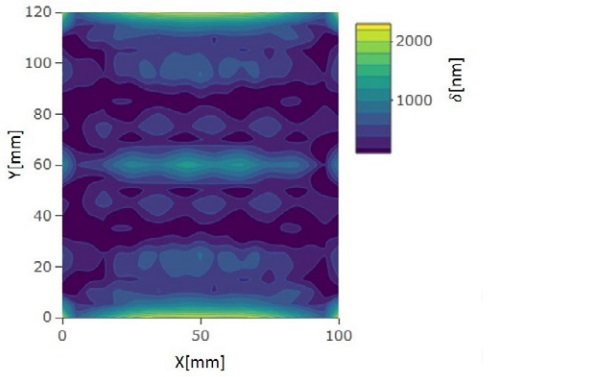
Similar results are also seen with 8 mm stationary thick glass. The calculated local retardation values are shown in Fig. 9. The accuracy of the result for 8 mm case is lower than for 4 mm case because the in x- and y-direction the element size for 8 mm glass is 5 mm comparing to element size in 4 mm case where the element size is 1 mm. Despite the large element size, the anisotropy pattern is similar to plane polariscope measured pattern.
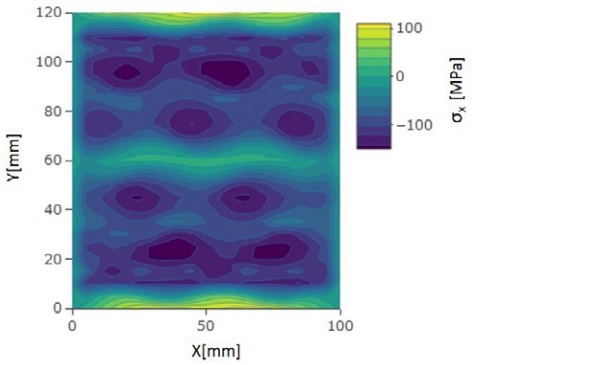
However, the peak retardation values are much higher than measured with plane polariscope. The presented results for 8 mm are shown over the unit length in the y-direction when larger glass plate is modeled. The high retardation values at the y-location 0 mm and 120 mm are due to the low heat transfer area between nozzle boxes. The same phenomenon can be seen also in Fig. 10, where the stresses in the x-direction are presented.
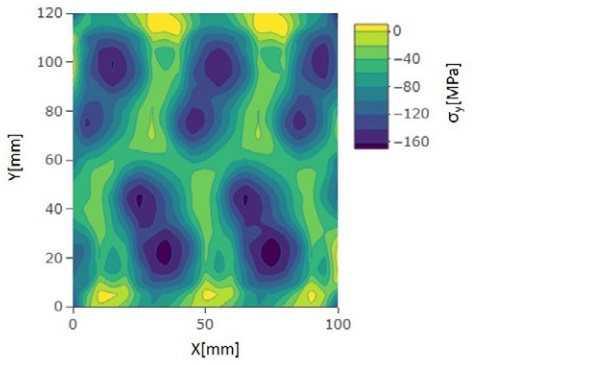
There the high compressive stresses are at the nozzle jet impact area. Between the nozzle boxes stresses in the x-direction are turning more tensile. The stresses in the y-direction are shown in Fig. 11. There the stresses between jets are formed by adding tension. The stress pattern in Figs. 10 and 11 are comparable to measured stress patterns in Fig. 6. so that highest compression zones are coming on the same areas.
Conclusions
In a glass tempering process, heating and especially rapid cooling create residual stresses which differ from each other in different directions. In order to achieve high heat transfer coefficients jet arrays, where jet outlets are near the glass, must be used. The main reason is that in the cooling section convective heat transfer between the air and glass surface is not uniform which gives also non-isotopic stress distribution inside the glass. Depending on the environment, blue sky is one example, harmful faults called anisotropy are seen in tempered glass panes.
Stresses in the glass can be measured but it takes plenty of time. By using a polarized light anisotropy can be observed rapidly but it does not give exact stress values. In the design of an energy efficient cooling system, numerical modeling of heat transfer and residual stresses can be used.
However, there are some shortages when the results of the modeling are evaluated: exact modeling of impinging jets heat transfer is very challenging, and the theory of residual stresses involves many experimental parameters. In addition, very many calculation points are needed because we have hundreds of jets. It is not enough to study only the behavior of a single jet because in the array they effect on each other.
In the paper different methods to understand anisotropy are applied. We have observed that stress measurements with SCALP, anisotropy patterns by a plane polariscope and numerical modeling of residual stresses give similar types of results. The understanding of the process from cooling to anisotropy needs a good understanding from four different fields of physics: fluid dynamics, heat transfer, mechanics and optics.
However, it is difficult to get a reasonable agreement between numerical values of different methods even the distributions are similar. Two observations are sure: the continuous moving of the glass relative to nozzles gives more isotropic stresses and the highest anisotropy for stationary glass is created between nozzles but not at the jet stagnation point where heat transfer is best.
Acknowledgements
The authors acknowledge the GlasStress Ltd for SCALP stress measurements presented within this paper. The authors also acknowledge the Sydney Informatics Hub and the University of Sydney’s high performance computing cluster Artemis for providing the high performance computing resources that have contributed to the research results reported within this paper.
References
[1] Martin, H., Heat and Mass Transfer Between Impinging Gas Jets and Solid Surfaces. Advances in Heat Transfer. 13. Academic Press. New York., pp. 1-59, 1977. doi:10.1016/S0065-2717(08)70221-1
[2] Alimohammadi, S., Murray, D., Persoons, T., Experimental Validation of a Computational Fluid Dynamics Methodology for Transitional Flow Heat Transfer Characteristics of a Steady Impinging Jet. Journal of Heat Transfer, Vol. 136, 2014.doi:10.1115/1.4027840.
[3] Lemanow, V.V., Terekhov, V.I., Terekhov, V.V., Heat Transfer of Impinging Jet at Low Reynolds Number. IHTC-16, August 10-15, 2018, Beijing, China, 2018.
[4] Illguth, M., Schuler, C., Bucak, Ö., The Effect of Optical Anisotropies on Building Glass Façades and its Measurement Methods, Frontiers of Architectural Research, Vol. 4, pp. 119-126, 2015. doi: 10.1016/j.foar.2015.01.004
[5] Chen, Y., Lochegnies, D., Defontaine, R., Anton, J., Aben, H., & Langlais, R., Measuring the 2D Residual Surface Stress Mapping in Tempered Glass under the Cooling Jets: The Influence of Process Parameters on the Stress Homogeneity and Isotropy. Strain, Vol. 49, pp. 60–67, 2013. doi:10.1111/str.120136.
[6] Vitkala, J., Karvinen, R., How to Temper Low-E Glass. 38th Annual Technical Conference Proceedings, Society of Vacuum Coaters, pp. 261-267, 1995.
[7] Karvinen, R., Adaption of Tempering Furnaces to Coated Glass. Industrial Ceramics, No.936, pp.222-229, 1998.
[8] Narayanaswamy, O. S., Stress and Structural Relaxation in Tempered Glass. J. Am. Ceram. Soc. Vol. 61, pp. 146-152, 1978. doi: 10.1111/j.1151-2916.1978.tb09259.x
[9] Aronen, A., Karvinen, R., Effect of Glass Temperature Before Cooling and Cooling Rate on Residual Stresses in Tempering. Glass Structures & Engineering, Vol. 3, pp. 3-15, 2018. doi:10.1007/s40940-017-0053-6
[10] Schneider, J., Hilcken, J., Aronen, A., Karvinen, R., Olesen, J., F., Nielsen, J., Stress Relaxation in Tempered Glass Caused by Heat Soak Testing. Engineering Structures, Vol. 122, pp. 423-449, 2016. doi:10.1016/j.engstruct.2016.04.024
[11] Aben, H., Guillemet, C., Photoelasticity of Glass. Springer-Verlag, Germany, 1993.
[12] Mikkonen, A., Aronen, A., Rantala, M. & Karvinen, R., Effects of Non-Uniform Heat Transfer in a Tempering Process on Glass Quality. GPD Glass Performance Days 2017, pp. 161-166, 2017.