Article Information
- Digital Object Identifier (DOI): 10.47982/cgc.10.727
- Published by Challenging Glass, on behalf of the author(s), at Stichting OpenAccess.
- Published as part of the peer-reviewed Challenging Glass Conference Proceedings, Volume 10, June 2026, 10.47982/cgc.10
- Editors: Christian Louter, Freek Bos & Jan Belis
- This work is licensed under a Creative Commons Attribution 4.0 International (CC BY 4.0) license.
- Copyright © 2026 with the author(s)
Authors:
Jackson Jewett a, Faidra Oikonomopoulou b, Telesilla Bristogianni b, Josephine V Carstensen a
a MIT, USA
b Delft University of Technology, The Netherlands

Abstract
Cast glass offers vast forming potential, enabling the creation of expressive three-dimensional structural components that can effectively exploit the material’s high compressive strength. Yet, despite these advantages, massive cast glass elements remain largely unexplored in architecture. The primary obstacle lies in the exceptionally long annealing times required, which increase exponentially with the thickness and mass of the components, rendering them in turn economically unfeasible for architectural use. Topology optimization has been suggested as a computational design method to minimize mass in cast glass structures, reducing annealing time and allowing for larger cast glass elements. Topology optimization algorithms must be modified to account for the unique behaviour of glass, particularly its low tensile capacity compared to its high compressive strength. This research analyses beams designed with a novel topology optimization framework for cast glass structures that is focused on reducing tension stresses. Maximum and minimum length scales are also controlled using a 2.5D design framework to ensure manufacturability. It is found that the glass-specific optimization as minimal impact on the tensile stresses within the beams. However, the optimized beams show material savings of over 31%-38% compared to conventional prismatic designs with the same maximum tension stresses. This work establishes the expected material savings using topology optimization, and acts as a useful benchmark for future physical experimentation.
1. Introduction
Load-bearing glass structures employ glass not only to resist wind pressures, as in conventional façade systems, but also as components of the primary load-resisting system. In such applications, glass is designed to withstand actions arising from gravity, wind, snow, and seismic loading. Some famous examples of structural glass buildings are the Apple Store at 767 Fifth Avenue in New York City, and the Steve Jobs theatre on Apple campus in Cupertino, California. The practice is used in many applications all over the world.
In most cases, structural glass construction uses laminated float glass, in either planar or curved elements. However, a body of research in recent years has contributed to the use of cast glass in structural engineering applications. Cast glass is a manufacturing method in which molten glass is poured into molds before cooling. Examples include the Qaammat Pavilion [1], and the Crystal House façade in Amsterdam [2].
Owing to its manufacturing process, cast glass can achieve more complex 3D geometries than conventional float glass. However, a key challenge in cast glass fabrication lies in the annealing process, during which the material must be carefully cooled in a controlled manner to prevent excessive temperature gradients and residual stresses within the material. The size, especially the thickness and overall mass, of a cast glass piece significantly influences its annealing time [3]. As the cross-sectional dimensions increase, the required annealing time grows exponentially, rendering large solid cast glass elements economically unfeasible for architectural applications [4]. This effect is illustrated by large-scale glass castings for telescope mirror blanks. For example, the mirror blank of the Hooker Observatory, cast as a solid glass disk with a diameter of 2.5m and a mass of circa 4 tonnes, required approximately 12 months of annealing [5]. By contrast, the mirror blank of the Giant Magellan Telescope, despite being more than three times larger with a diameter of 8.4 m and a mass of 16 tonnes, required only 3 months of annealing due to its optimized honeycomb internal structure [6].
Following this principle, topology optimization (TO) has been suggested as a method for designing architectural-scale cast glass structures of a high stiffness to weight ratio, offering considerably shorter annealing times [6], [7], [8]. TO is a computational design method in which a limited amount of material is freely placed within a design space to resist a set of loads on the system. By using this technique to reduce the material volume and feature sizes in a cast glass structure, the annealing time can be significantly reduced [4].
However, previous work has shown the importance of adapting TO for the specific application of structural glass design [7]. Most critically, the optimization system must be able to account for the relative weakness of glass in tension – particularly when compared to its compressive strength, which is at least an order of magnitude higher [5]. Some examples in the literature have already explored how TO can integrate this specific material behavior of structural glass in 2D. There are two primary approaches in the field. The first is to use a stress-based optimization, in which the Drucker-Prager stresses are minimized in the system [9], or the maximum stress in the structure is limited as a constraint in the optimization [8], [10], [11]. However, stress-based TO is a highly non-linear problem [12], making these optimizations slower to solve, and more prone to converge on a low-performing local minimum. As an alternative, a stiffness-based approach has also been used, in which a force-dependent stiffness penalization method encourages the optimizer to place more material in the tension zones of structures [9]. Although this method can be faster and easier to solve, it is an indirect approach to reducing tension in a structure, as it does not seek to directly control the stresses in the system during the optimization. Preliminary experimental work by the authors has suggested that the stiffness-based approach can produce better structural performance than stress-based methods [9].
However, more work is required in this field to further strengthen these findings. An additional shortcoming of previous work is that it has focused on 2D design fields. To take full advantage of the design freedom afforded by cast glass fabrication, it is necessary to develop TO methods that can generate 3D shaped glass structures.
Thus, this research builds on previous work by the authors using the stiffness-based method for cast glass design optimization. In this work, a 2.5D structural glass optimization system is introduced, which utilizes a Variable Thickness Sheet (VTS) design method [13]. A 2.5D design defines varying structural thicknesses in a 2D design space, rather than extruding a 2D design out-of-plane at a predefined thickness to create a 3D object. This technique allows for shaped 3D geometries to be developed without introducing prohibitive computational expense. A minimum feature thickness is also enforced on structural designs wherever material is placed in the system to ensure the geometries can be manufactured with cast glass. As in previous work, a stiffness-penalization scheme is used to encourage the algorithm to allocate more material to the tension zones of the structures, accounting for the material behavior of glass.
A key focus of this research is to quantify the efficacy of the stiffness penalization method for cast glass design. To improve the understanding of the method, the parameters of the stiffness penalization are systematically varied, so the impact of the technique on structural performance can be quantified using finite element analysis of optimized structures. All generated structures considered herein are simply supported beams subjected to a central point load (three-point bending). For comparison, two different span lengths are considered. The designs are analyzed using commercial finite element analysis (FEA) software to evaluate their structural performance and to enable comparison, in terms of resulting glass volume, with traditional prismatic beams exhibiting same maximum stress response under identical loading conditions.
2. Methods
This research employs a novel 2.5D topology optimization framework for the design of cast glass structural components, based on a Variable Thickness Sheet (VTS) method. In this system, a force-dependent stiffness scheme is imposed on the finite elements, so that the elements are stiffer when acting in compression than in tension. Although this is not an accurate reflection of glass behaviour, which is in fact an isotropic material [14], this method has the potential to act as a useful heuristic for TO of glass structures. By reducing the stiffness in the tension zones of the structure, the optimizer is encouraged to place more material in the tension zones to compensate for the reduced performance. This technique has been implemented in other TO works [15], [16], [17], and has also been outlined in a previous publication by the authors [9]. The stiffness ratio in tension and compression is herein referred to as the optimization stiffness ratio, or 𝐸𝑡 ⁄𝐸𝑐.
This work seeks to quantify how the selection of the optimization stiffness ratio affects the performance of the optimized structures. Beam designs with three distinct tension-to-compression stiffness ratios (1/1, 1/4, and 1/10) are generated for simply supported configurations with two different spans (400 mm and 700 mm), subjected to a central point load of 12 kN (three-point bending). The optimizer defines where material should be included and where it should be removed to minimize the compliance of the element. Where material is included, minimum and maximum thickness constraints are imposed to account for manufacturing limitations and feasible annealing requirements of the cast glass. The topology optimization is implemented in MATLAB, after which the optimized geometries are developed in Rhino 3D and subsequently exported to Strand7 for structural analysis.
Finite element simulations are conducted to evaluate the structural performance of the optimized designs. To enable a quantitative comparison in terms of material efficiency, the optimized beams are also compared against conventional prismatic beams which are designed to exhibit the same maximum stress response under identical loading conditions. Each step of the methodology is explained in detail in the following sections.
2.1. Optimization
The optimization algorithm is written in Matlab, building on the 88-Line Code [18], an educational Matlab code that is published open-source. However, this code is significantly modified to be used for structural cast glass design. The code follows the density-based approach for TO [19] with filtering to avoid numerical instabilities, and penalization of intermediate densities using SIMP [20]. The Method of Moving Asymptotes [21] is used as the optimizer.
This work builds on previous examples by using the Variable Thickness Sheet (VTS) method for design [13]. VTS optimization relaxes a constraint that is usually imposed to generate binary design outputs in TO of 0 and 1, which signify where material should be added or taken away in a structural system. When relaxing this constraint, continuous values between 0 and 1 are permitted in the final result, and interpreted as varying thicknesses in the structure [13], [22], [23]. This method allows for shaped 3D geometries to be generated, so long as the internal forces of the structural system are planar.
However, a pure VTS approach would present difficulties in producing manufacturable designs for cast glass. This is because the algorithm often generates large areas with very thin sections that would not be manufacturable in glass [24]. The molten glass requires a significantly wide channel through which to flow before the glass starts to cool. Therefor, a minimum thickness is imposed in the design space, so the optimizer may choose any thickness value between the maximum and minimum set by the user, or place no material at all, following the density approach [24].
With these specifications for cast glass optimization in place, the optimization formulation is as follows:
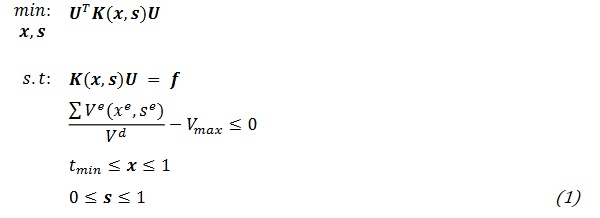
Where K is the stiffness matrix, U is the displacements, f is the applied force, 𝑉𝑒 is the material volume of element e, 𝑉𝑑 is the volume of the design space, and 𝑉𝑚ax is the maximum allowable material volume as a ratio of the design space, which is chosen by the user. The minimum thickness of the structure is defined by 𝑡𝑚in , and the design variables are x and s, where x is the set of variables controlling the thickness of the beam at each point, and s is the set of variables that determines if material is placed or not at each point. These two variable sets define the densities of the elements, 𝝆, such that:
![]()
The density of the element, 𝜌𝑒, defines the thickness of the beam at that element’s location. The design variables also influence the element’s volume, 𝑉𝑒, and the element’s stiffness, 𝐸𝑒, as follows:
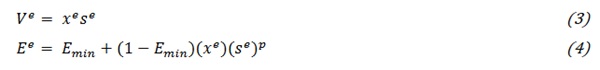
Where p is a penalization variable that encourages values of s to be either 0 or 1 when 𝑝 > 1. Emin is a very small number, 10⁻⁴ in this case, which ensures that FEA can be performed without singularities occurring during matrix inversions due values of identically zero in the stiffness matrix.
2.2. Problem setup
This work is focused on comparing the performance of several different beam designs. The intention is to understand how the internal stresses in the structures under the same loading compare to one another. For this reason, a load of 12 kN is placed at midspan of the beams, and the resulting values and distribution of 𝑠₁ and 𝜎ₓₓ are compared. This work seeks to compare the relative performance of various designs, and thus it is not within the scope to predict failure loads of specific designs for a chosen type of material.
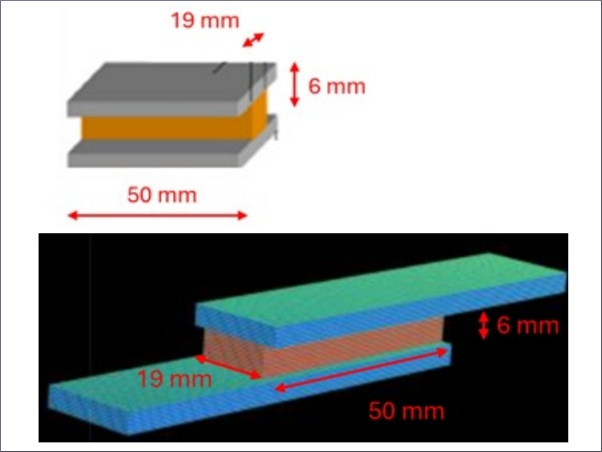
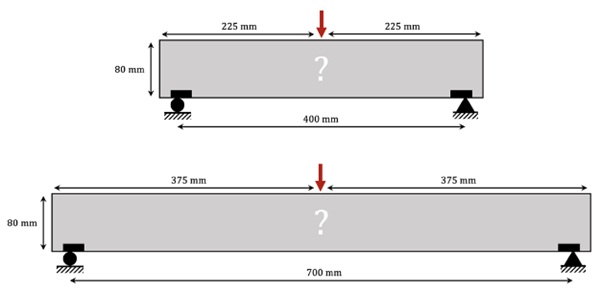
In this work, it is necessary that generated geometries be manufacturable in cast glass, and perform well during structural loading. A key aspect for the manufacturability of these designs is enforcing a minimum thickness that is large enough for molten glass to flow through. Two loading conditions are developed to evaluate the efficacy of the TO framework, and the consequences of changing various parameters. In both case, beams are in 3-point bending, with a unit load applied at midspan on the top of the beam. The design spaces are 80 mm height and 60 mm in thickness. In the first condition, a design space of 450 mm in length with a 400 mm structural span and a 20 mm minimum thickness is used, while the second has a design space of 750 mm in length with a 700 mm structural span and a 15 mm minimum thickness. Both design spaces are visualized in Figure 1. During the optimization, material can be placed within the grey rectangle shown, but only 50% of the design space is allowed to be filled. Material is forced to be placed above the supports to ensure there is adequate surface area for contact with the testing apparatus, which is indicated by the black areas in the figure.
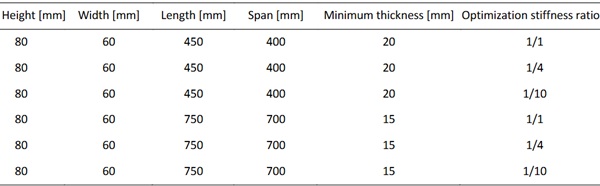
Each loading condition is run in three different optimization stiffness ratios to help understand which parameter is best for reducing the tensions stresses in the structures. In the first, it is assumed that the structural material behaves isotropicly, with the same stiffness in both tension and compression. In the second, the tensile stiffness is reduced to 1/4 of the stiffness in compression, and in the third case it is reduced to 1/10. The parameters for each of the 6 beam design are summarized in Table 1.
Table 1: The dimensions and optimization stiffness ratios of all 6 beam designs are summarized
2.3. Modelling and Analysis
The optimization results are generated as 2D matrices with values referring to the varying thickness of the structure at each point. To convert these matrices into 3D geometries, a Matlab code is used to create STL files that are compatible with the modelling software, Rhino 3D. The STL files are imported to Rhino 3D, and the parametric design plug-in tool called Grasshopper is used to remove any sharp edges of the geometries that are leftover artefacts from the optimization process.
After the geometry files have been developed, they are imported to the FEA software Strand7 for analysis. To take advantage of symmetry and reduce computation time, only 1/4 of the beam is analysed, with symmetry restraints imposed on the relevant nodes within the model. The material is treated as linear and isotropic, because this most accurately reflects the behaviour of glass before cracking and failure occur. A Young’s modulus of 70000 MPa is used for the glass material, with a Poisson’s ratio of 0.21 [14]. The specific geometries and meshing are described in the Results section.
3. Results
In this section, the resulting geometries from the cast glass topology optimization framework are discussed, as well as the results from the FEA after they have been rationalized into 3D structures.
3.1. Optimization results
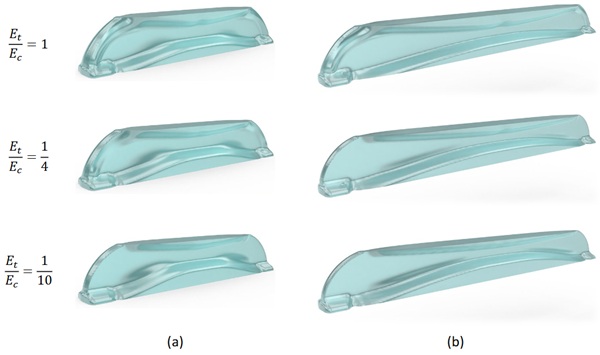
The optimization outputs of all 6 beam designs are shown in Figure 3. The varying shades of grey in the results refer to different thicknesses of the beam. White regions have no material, black regions use the full thickness of the design space, and the grey values are linear interpolations in-between. The black line along the outside delineates the boundary of where material is placed, and where there is void in the design space. Figure 4 shows the optimization results rationalized into 3D structures resembling a glass material.
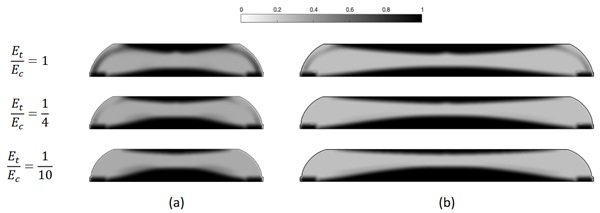
It can be seen that the optimization is able to successfully maintain the defined minimum thicknesses within the beam designs. There are substantial similarities in the designs, even as the tensile stiffness is reduced. The key differences occur in how much material is massed in the tension and compression zones near the middle of the beam, and the thickness of the glass in the region above the supports, in which the compression chord curves down to bring the applied forces from the top of the beam into the supports at either end.
After the geometries have been generated, they are imported into Strand7, a commercial FEA software, for analysis. A 3D mesh of tetrahedral 4-node elements is used. Very fine elements with edge lengths of 1 mm are used along the shaped surfaces to ensure high fidelity in the results. To take advantage of symmetry, only one quarter of the beam is analysed, with symmetry restraints placed on the nodes along the symmetry planes. A unit load of 3 kN is applied as a normal pressure on the surface of the brick elements across the top of the beam at midspan on an area of 1 mm by 30 mm. Because only one quarter of the beam is modelled, this is equivalent to a force of 12 kN across a strip that is 60 mm by 2 mm, or 100 MPa, for the full beam. A face support is applied 200 mm away from midspan to replicate the conditions of the optimization.
3.2. 400mm span beam analysis
Images of the meshes with applied loads and supports are shown in Figure 5a.
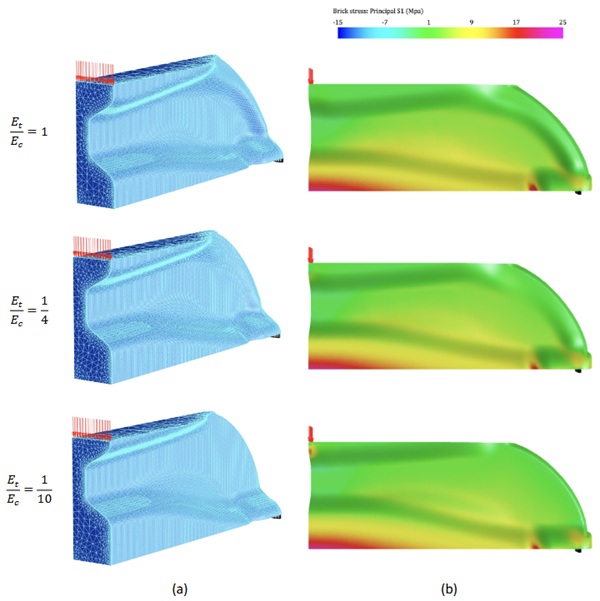
Figure 5b shows the first principal stresses, 𝑠₁, in all three beam designs. As can be seen, there is little variation in the maximum principal stress at midspan, which are summarized in Table 2. In addition to the peak midspan stresses, the beams also have a stress concentration near the support, where the tension material narrows at the bottom of the beam. However, the magnitude of these stresses is less than the stress values at midspan.
There some are notable differences between the behaviours of the beams. As the optimization stiffness ratio is lowered, the tension stresses in the beam are concentrated lower and lower in the beam. This is particularly observable in Figure 6a, which only shows colour in the regions in which the first principal stress is tensile. The areas in which the first principal stress is compressive are shown as grey. This effect is even clearer in Figure 6b, which shows the XX stresses, or the normal stresses in the elements in the direction of the length of the beam. Although the maximum stress value is not lowered, tensile stresses are present in smaller regions of the beam.
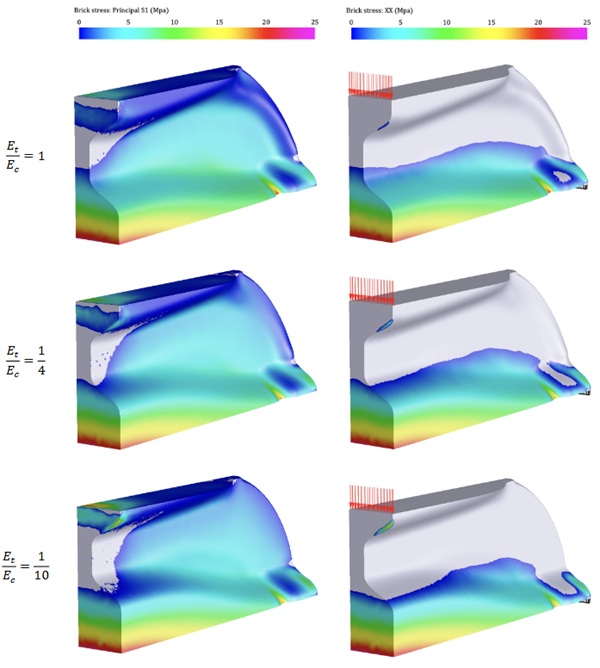
It was expected that adding more material to the tension zone of the beam would reduce the maximum tension stresses. However, this analysis finds that the maximum principal stresses in all 3 designs, which are shown in Table 2, are almost identical. One potential explanation for these results is that, in the isotropic material system, adding more material to the tension zone of the beam increases the stiffness in that region, which attracts more force. Thus, the reduction in stress that might come from adding material is counterbalanced by the increased local forces in the region. This shows a potential limitation of this technique for structural glass design. It is also notable that as the stiffness ratio is reduced, a stress concentration appears in the top flange of the beam at midspan. This suggests that imposing very low stiffness ratios on the system could introduce new failure modes in the system and reduce overall structural integrity.
3.3. 700 mm span beam analysis
To investigate the robustness of these findings, the 700 mm span beam is also analysed. The minimum thickness in these designs is reduced to 15 mm instead of 20 mm. The optimized geometries are generated and analysed following the same method as is used above. The FEA meshes and resulting positive first principal stresses are shown in Figure 7.
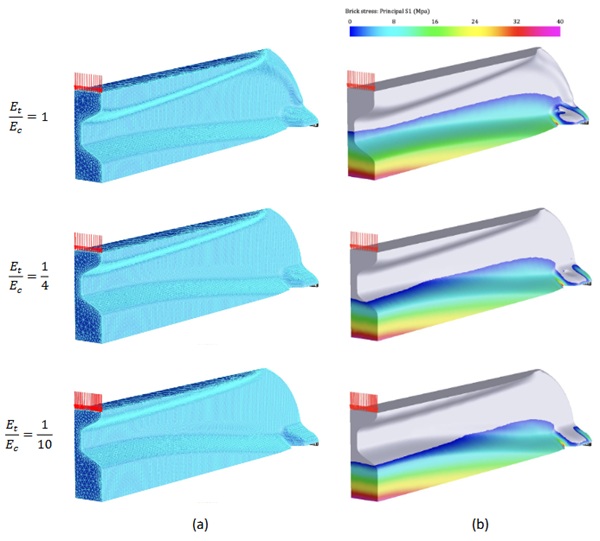
It can be seen that these beams have a similar structural response as the previous examples. The maximum midspan stresses are not reduced as the optimization stiffness ratio is decreased, but the tension zones of 𝑠𝑠1 move lower down the beam, as shown in Figure 7b. A notable difference is that the stress concentration near the supports reaches values similar to those of the midspan, and sometimes slightly greater. Unlike the 400 mm span beams, there is no observable stress spike in the compression strut as the optimization stiffness ratio is reduced.
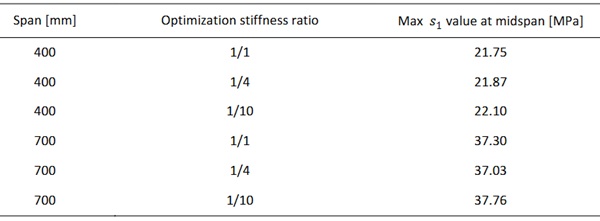
To compare the performance of each beam discussed in this section, Table 2 summarizes the maximum principal stresses at midspan of each case. As stated, the differences are insignificant across designs of the same span for different optimization stiffness ratios.
Table 2: Summary of max first principal stress values at midspan in all beams, organized by span and optimization stiffness ratio
3.4. Comparison to prismatic design
This research investigates the potential for volume reduction in cast glass structures enabled by topology optimization. To evaluate this, a reference prismatic beam is designed such as it exhibits the same maximum stress response under identical loading conditions. For the 400 mm span beam, a stress value of 23 MPa is targeted. This is conservative, as all the optimized beams achieved lower maximum principal stresses. The optimized beams have material volumes of 1080 cm³, which corresponds to half of the design space (450 mm x 80 mm x 60 mm). The maximum stress of a prismatic beam in 3-point bending, 𝜎𝑚ax , is calculated as:

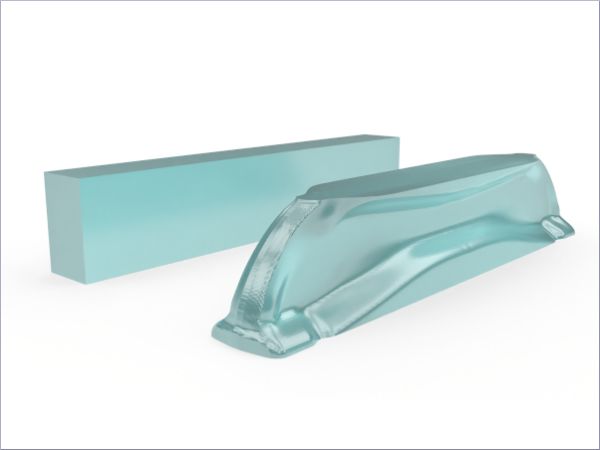
Where 𝜎𝑚ax is the maximum stress, F is the applied load, L is the span, b is the thickness, and d is the depth. Following this equation, a thickness of 48.9 mm would be required for a rectangular beam to have 𝜎𝑚ax ≤ 23 MPa. Assuming the beam is only 400 mm long, which would allow for no material overhang, this beam would have a volume of 1565.2 cm³. Therefore, by this conservative estimate, the optimized beams have only 69% of the material volume of a prismatic beam, representing a substantial material saving of 31% for the same structural depth. Examples of the optimized and prismatic geometries with the same max principal stress values are shown in Figure 8. Following the same calculation method for the 700 mm span beam with a target stress of 38 MPa yields an even higher materials saving of 38%. The higher efficiency is due to the relaxation of the enforced minimum thickness imposed on the system, from 20 mm to 15 mm in this case.
4. Conclusion
This research sought to evaluate the efficacy of a novel topology optimization approach for design of cast glass structures. The work uses a 2.5D optimization approach to develop shaped 3D geometries, with a minimum structural thickness imposed for improved manufacturability in cast glass. The optimization also seeks to place more material in the tension zones of the structures to account for glass’s weakness in tension by reducing the stiffness of elements in tension during the optimization. It is found that reducing the optimization stiffness ratio does not have significant impact on the maximum first principal stresses in the beams under 3-point bending. However, it is found that the regions of the beams in tension are smaller as the optimization stiffness ratio is reduced. Additionally, the volume of material needed to achieve the same maximum principal stress as a prismatic beam is 31%-38% lower for the optimized beams, depending on the specific constraints that are imposed on the optimization.
It is recommended that physical testing be performed to further evaluate the efficacy of this design method. Glass failure is a complex phenomenon, and linear FEA can only provide a rough estimate of how glass would behave in real-world applications. Future work in glass optimization could also focus on minimizing volume with a constraint on maximum principal stresses, rather than using the optimization stiffness ratio as a heuristic. Further, a 3D optimization environment would allow for even more expressive structures than the 2.5D optimization method used herein.
Acknowledgements
The authors would like to thank Ethan Townsend and Wilfried Damen for their advisement regarding cast glass manufacturability and analysis.
References
[1] F. Oikonomopoulou, T. Bristogianni, M. Van Der Velden, and K. Ikonomidis, “The adhesively-bonded glass brick system of the Qaammat Pavilion in Greenland: From research to realization,” Archit. Struct. Constr., vol. 2, no. 1, pp. 39–62, May 2022, doi: 10.1007/s44150-022-00031-2.
[2] F. Oikonomopoulou, T. Bristogianni, F. A. Veer, and R. Nijsse, “The construction of the Crystal Houses façade: challenges and innovations,” Glass Struct. Eng., vol. 3, no. 1, pp. 87–108, Mar. 2018, doi: 10.1007/s40940-017-0039-4.
[3] E. B. Shand and W. H. Armistead, Glass engineering handbook, 2d ed. in McGraw-Hill handbooks. New York: McGraw-Hill, 1958.
[4] F. Oikonomopoulou, T. Bristogianni, L. Barou, F. A. Veer, and R. Nijsse, “The potential of cast glass in structural applications. Lessons learned from large-scale castings and state-of-the art load-bearing cast glass in architecture,” J. Build. Eng., vol. 20, pp. 213–234, Nov. 2018, doi: 10.1016/j.jobe.2018.07.014.
[5] F. Oikonomopoulou, Unveiling the third dimension of glass: solid cast glass components and assemblies for structural applications. Delft: A+BE Architecture and the Built Environment, 2019.
[6] F. Oikonomopoulou, A. M. Koniari, W. Damen, D. Koopman, I. M. Stefanaki, and T. Bristogianni, “Topologically optimized structural glass megaliths: Potential, challenges and guidelines for stretching the mass limits of structural cast glass.,” 2022.
[7] W. Damen, F. Oikonomopoulou, T. Bristogianni, and M. Turrin, “Topologically optimized cast glass: a new design approach for loadbearing monolithic glass components of reduced annealing time,” Glass Struct. Eng., vol. 7, no. 2, pp. 267–291, Aug. 2022, doi: 10.1007/s40940-022-00181-1.
[8] A. M. Koniari, C. Andriotis, and F. Oikonomopoulou, “Minimum Mass Cast Glass Structures Under Performance and Manufacturability Constraints,” in Computer-Aided Architectural Design. INTERCONNECTIONS: Co-computing Beyond Boundaries, M. Turrin, C. Andriotis, and A. Rafiee, Eds., Cham: Springer Nature Switzerland, 2023, pp. 437–451.
[9] J. L. Jewett, A. M. Koniari, C. P. Andriotis, F. Oikonomopoulou, T. Bristogianni, and J. V. Carstensen, “More with less: topology optimization strategies for structural glass design,” Glass Struct. Eng., vol. 10, no. 2, p. 12, Jun. 2025, doi: 10.1007/s40940-025-00294-3.
[10] K. Heng, M. Vassaux, R. Hin, S. Chansopheak, and J.-C. Sangleboeuf, “Topology Optimization of Structural Glass Beams: Design, Fabrication, and Validation,” 2025.
[11] K. Heng, M. Vassaux, R. Hin, C. Seang, E. Robin, and J.-C. Sangleboeuf, “Structural Topology Optimization for Abrasive Water-Jet Fabricated Glass”.
[12] C. Le, J. Norato, T. Bruns, C. Ha, and D. Tortorelli, “Stress-based topology optimization for continua,” Struct. Multidiscip. Optim., vol. 41, no. 4, pp. 605–620, Apr. 2010, doi: 10.1007/s00158-009-0440-y.
[13] M. P. Rossow and J. E. Taylor, “A Finite Element Method for the Optimal Design of Variable Thickness Sheets,” AIAA J., vol. 11, no. 11, pp. 1566–1569, Nov. 1973, doi: 10.2514/3.50631.
[14] T. Bristogianni, “Anatomy of cast glass: The effect of casting parameters on the meso-level structure and macro-level structural performance of cast glass components,” Delft University of Technology, 2022. doi: 10.4233/UUID:8A12D0B1-FEE2-47F1-9FA9-FF56AB2E84C1.
[15] K. Cai, “A simple approach to find optimal topology of a continuum with tension-only or compression-only material,” Struct. Multidiscip. Optim., vol. 43, no. 6, pp. 827–835, Jun. 2011, doi: 10.1007/s00158-010-0614-7.
[16] O. M. Querin, M. Victoria, and P. Martí, “Topology optimization of truss-like continua with different material properties in tension and compression,” Struct. Multidiscip. Optim., vol. 42, no. 1, pp. 25–32, Jul. 2010, doi: 10.1007/s00158-009-0473-2.
[17] Z. Du, W. Zhang, Y. Zhang, R. Xue, and X. Guo, “Structural topology optimization involving bi-modulus materials with asymmetric properties in tension and compression,” Comput. Mech., vol. 63, no. 2, pp. 335–363, Feb. 2019, doi: 10.1007/s00466-018-1597-2.
[18] E. Andreassen, A. Clausen, M. Schevenels, B. S. Lazarov, and O. Sigmund, “Efficient topology optimization in MATLAB using 88 lines of code,” Struct. Multidiscip. Optim., vol. 43, no. 1, pp. 1–16, Jan. 2011, doi: 10.1007/s00158-010-0594-7.
[19] M. P. Bendsøe and O. Sigmund, Topology Optimization. Berlin, Heidelberg: Springer Berlin Heidelberg, 2004. doi: 10.1007/978-3-662-05086-6.
[20] M. P. Bendsøe, “Optimal shape design as a material distribution problem,” Struct. Optim., 1989.
[21] K. Svanberg, “The method of moving asymptotes—a new method for structural optimization,” Int. J. Numer. Methods Eng., vol. 24, no. 2, pp. 359–373, Feb. 1987, doi: 10.1002/nme.1620240207.
[22] S. Pozo, T. Golecki, F. Gomez, J. Carrion, and B. F. Spencer, “Minimum-thickness method for 2.5D topology optimization applied to structural design,” Eng. Struct., vol. 286, p. 116065, Jul. 2023, doi: 10.1016/j.engstruct.2023.116065.
[23] J. Petersson, “On stiffness maximization of variable thickness sheet with unilateral contact,” Q. Appl. Math., vol. 54, no. 3, pp. 541–550, Sep. 1996, doi: 10.1090/qam/1402408.
[24] R. Giele, J. Groen, N. Aage, C. S. Andreasen, and O. Sigmund, “On approaches for avoiding low-stiffness regions in variable thickness sheet and homogenization-based topology optimization,” Struct. Multidiscip. Optim., vol. 64, no. 1, pp. 39–52, Jul. 2021, doi: 10.1007/s00158-021-02933-z.


 demonstrator at Glass Technology Live during Glasstec 2024 (© Cas Maertens).")