This paper was first presented at GPD 2025.
Link to the full GPD 2025 conference book: GPD_2025_ConferenceProceedingsBook.pdf

Authors: Cenk Kocer a, Antti Aronen b, Christian Alter c
a. University of Sydney, Australia
b. Glaston, Finland
c. Technische Hochschule Mittelhessen, Germany
Abstract
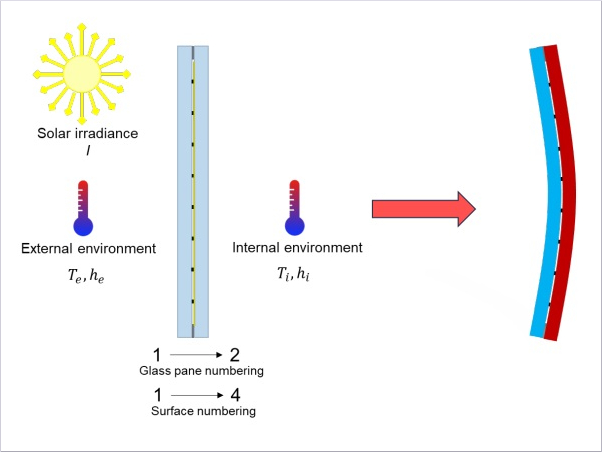
The Vacuum Insulated Glass (VIG) device consists of two panes of glass, hermetically sealed around the perimeter. An array of pillar elements (well-known as pillars) is placed between the glass panes, to maintain separation under atmospheric pressure. These pillars are typically 0.5 mm in size and can be of various shapes. The pillars strongly contribute to heat flow since each pillar is a thermal bridge. Furthermore, due to their small size, the contact pressure on the glass can be quite high because of atmospheric and other external loads. This paper presents the known processes that dictate the thermal and mechanical outcomes of pillar contact on glass, with respect to their size, shape, and the underlying material they are made from. Analytical formulas are presented to provide a means to determine, with reasonable accuracy, their overall impact on the design outcomes of a VIG unit. It is found that there is a performance balance between the required thermal resistance and the mechanical strength. A design process for the VIG is presented, considering pillar performance.
Article Information
- Published by Glass Performance Days, on behalf of the author(s)
- Published as part of the Glass Performance Conference Proceedings, June 2025
- Editors: Jan Belis, Christian Louter & Marko Mökkönen
- This work is licensed under a Creative Commons Attribution 4.0 International (CC BY 4.0) license.
- Copyright © 2025 with the author(s)
1.Introduction
Vacuum Insulated Glass (VIG) technology represents a significant advancement in building envelope performance, providing excellent thermal insulation while maintaining a relative thin profile. The critical engineering challenge in the design of the VIG is to limit the potential fracture processes in the glass panes, while minimizing the thermal contribution from the pillars.
Pillars serve as the fundamental structural elements that maintain the glass panes under atmospheric pressure—approximately 10 kN/m² acting continuously over the glass surface. These small, precisely positioned supports maintain the vacuum gap, typically measuring just 0.1 to 0.2 mm in width. Without these pillars, the glass panes would inevitably bow inward and make contact, eliminating the insulating vacuum space.
However, each pillar creates a direct thermal bridge between the inner and outer glass panes, providing a conductive pathway for thermal heat transfer. This is inherently a design conflict: too few pillars risk mechanical failure under atmospheric loading, while too many pillars degrade thermal performance.
The optimization of VIG pillar design requires careful consideration of the two competing performance criteria. From a mechanical perspective, pillars must be sufficiently numerous and positioned to distribute the atmospheric loads, and other external loads, safely across the glass surface, preventing stress concentrations that could result in glass failure. The spacing, diameter, and height of the pillars directly influence the VIG’s ability to withstand not only static atmospheric pressure but also dynamic loads from wind, thermal expansion, and handling stresses.
Conversely, higher thermal resistance demands minimizing the number, thermal conductivity, and/or size of the pillars to reduce the thermal contribution. Each pillar represents a compromise in the VIG's design, as it provides a direct conductive path that allows heat to bypass the vacuum gap. The thermal impact becomes particularly significant given that pillars typically account for the dominant heat transfer mechanism in well-designed and highly insulating VIG units.
This report presents a comprehensive analysis of pillar design options and their performance implications for VIG systems. Through detailed mechanical and thermal calculations, we examine how different pillar configurations—including variations in material properties, geometric parameters, and spatial arrangements—affect overall VIG performance.
Understanding the trade-offs in the design of the VIG is essential for advancing VIG applications and improving building energy efficiency, while maintaining a focus on safety and durability required in our dwellings.
2. The performance of Vacuum Insulated Glass
This section examines both the thermal and mechanical performance of pillars. These sub-millimeter scale pillars, positioned between the glass panes to resist atmospheric pressure, must be carefully designed to balance the undesirable contact stresses on the glass and compressive stress in the pillar, with the minimal thermal bridging of the pillar. Here the analytical and numerical models used to evaluate the stress and heat transfer through individual pillars are presented and discussed, considering factors such as pillar size and geometry, pillar material, and applied load. These performance models provide the foundation for optimizing pillar performance to meet desired VIG window performance.
2.1. Thermal performance
The gap between the glass panes in a VIG is maintained through the regular array of pillars, which are typically 0.5 mm in diameter, 0.2 mm in height and cylindrical in shape. Over an array spacing, λ, (the distance between pillars) each pillar is represented as a thermal bridge between two λ² areas of glass (for a regular array shape, square). The resistance to heat flow through each pillar is due to two heat flow pathways; the first, due to the constrained flow that occurs because of the relative size difference between the characteristic length of the supported glass, λ, and the radius of the pillar, r — this term is known as the spreading/constriction resistance — and only depends on the pillar size and the thermal conductivity of the glass. The second, is the thermal resistance of the pillar material, and is determined from the length, area, and thermal conductivity of the pillar material (Collins et al, 1995, Simko et al, 1998, Collins & Robinson 1991, Collins & Simko 1998). A good estimate of the total thermal resistance of a pillar is the series sum of these two terms and is expressed as,
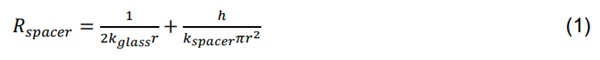
where r is the radius of the pillar, h is the height of the pillar, kglass and kpillar are the thermal conductivities of the glass and pillar, respectively. Note that the spreading resistance, by definition, includes the thermal resistance due to the glass, where the pillar conduction term does not. Furthermore, the first term in equation (1) is the addition of both the constriction (heat flowing into the pillar) and spreading (heat flowing out of the pillar) resistance, which are equal for geometrically symmetric pillars, such as the cylindrical pillar. The error that results in equation (1), because the glass contribution is not included in each term, is less than 2-3% and considered in all cases to be negligible, and is therefore, ignored.
Since in most cases a regular square array of pillars is placed between the glass panes, where the spacing is λ, the total thermal resistance of the whole array is then written as,
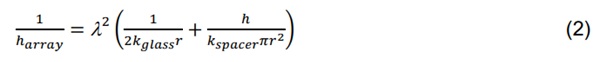
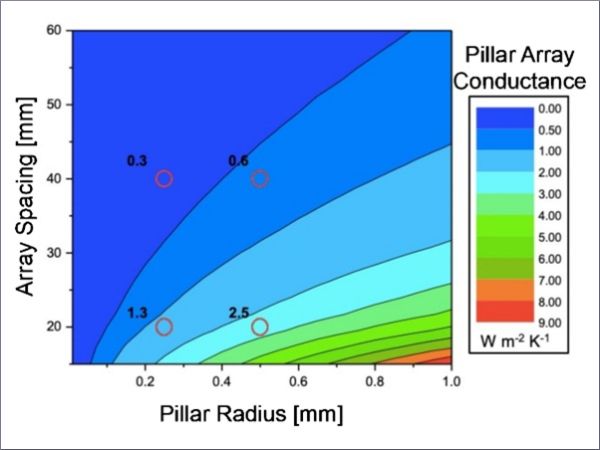
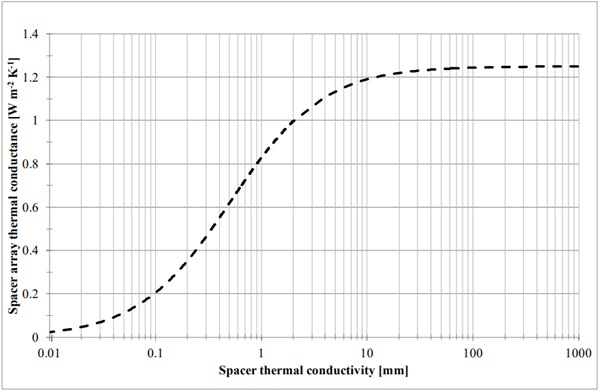
The questions of interest are, which term will dominate the overall thermal resistance of the array? and what will be the total thermal resistance with respect to the design parameters of the pillar and the array? Figure 1 is a plot of the pillar array thermal conductance, which clearly shows how the dominant effect, spreading/constriction, or conduction, shifts when the thermal conductivity of the pillar is closer to the thermal conductivity of the glass. This means that apart from changing the size of the pillar, or the spacing of the array, the thermal conductance of the array can be lowered by using a low conductivity material, such as a ceramic or glass pillar, instead of a metal pillar, which is the typical material of choice. Increasing the height of the pillar will also increase the thermal resistance; however, the increased resistance to be gained is not significant. Furthermore, there are issues related to the potential buckling failure of the pillar, the issues in producing such a pillar, and the undesirable increase in the overall thickness of the VIG unit.
The number and spacing of the pillars in a VIG unit have a significant influence on thermal performance, because of the thermal bridging effect they introduce. In most commercial designs, the pillars are arranged in a square grid, and the total heat transfer through them scales with the number of pillars per unit area. This is a square-law relationship: doubling the distance between pillars in both x and y directions reduces the number of pillars—and therefore their total thermal contribution—by a factor of four. As a result, the overall thermal conductance attributable to the pillar array can be greatly reduced by modest increases in pillar spacing.
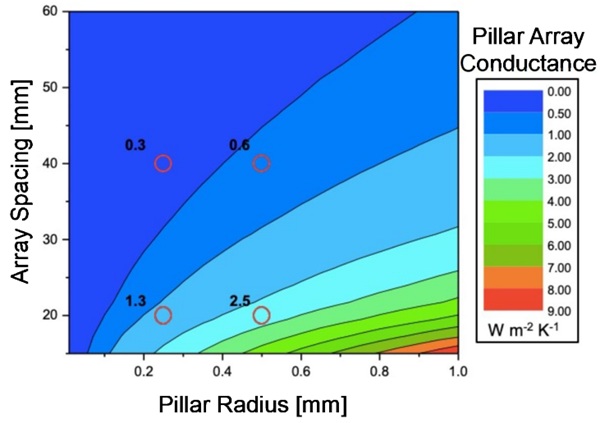
For example, a typical VIG design with 20 mm pillar spacing results in approximately 2,500 pillars per square meter. If the spacing is increased to 40 mm, this number drops to 625 pillars per square meter. Assuming the same material and geometry, this would reduce the heat conducted through the pillars by 75%, representing a substantial improvement in insulation performance. Figure 2 is a contour plot which highlights the reduction in thermal conductance to be gained by reducing the number of pillars per m2, and highlights the relative limited advantage gained by reducing the size of the cylindrical pillar. This data overall highlights the strong potential of advanced designs that minimize pillar density while still maintaining structural integrity. Achieving this requires careful engineering of pillar material, shape, and mechanical support characteristics to ensure that the glass panes can safely withstand atmospheric pressure with a reduced support network.
In addition to pillar spacing and size, several other factors significantly influence the total thermal conductance through the pillar array. One such factor is the surface roughness of the pillar ends, which directly affects the nature of the thermal contact with the adjacent glass panes. Smoother contact surfaces promote more efficient transfer across the interface, potentially increasing thermal conductance. Conversely, microscale (0.001 mm) surface contact protrusions can reduce effective contact area, introducing discrete point contacts which result in increased thermal resistance — although they must be managed carefully to avoid stress concentration and mechanical failure. All of these effects have been investigated using measurement methods that are well established (Kocer et al, 2023).
Pillar geometry also plays a crucial role. While cylindrical pillars are common due to ease of fabrication, alternative shapes such as conical, tapered, or hourglass designs can alter the thermal path length or reduce the cross-sectional area of heat flow, subsequently lowering conductance without compromising load-bearing capacity. Furthermore, material selection and coatings offer additional control. Other emerging approaches include micro-structured pillars, which aim to maintain mechanical support while disrupting heat flow. These options are not discussed in detail here, as a matter of brevity. There are tools, such as the software platform WINDOW, from Lawrence Berkeley National Labs, USA, which now offer the options for detailed pillar design when calculating the overall thermal conductance of a VIG design (WINDOW 2025).
2.2. Mechanical performance
In a VIG one of the critical mechanical issues is the stress induced at the contact between support pillars and the glass panes. Since the gap between the glass panes is under vacuum, atmospheric pressure exerts a uniform load across the external surfaces of the glass. This force is mechanically supported by the pillar array, with each pillar bearing a share of the load. As a result, each individual pillar transfers a contact load to the glass surfaces. This is a classic contact mechanics problem, where the stress distribution is highly localized and depends on both the magnitude of the applied force and the geometry of the contact interface.
The force on each pillar is directly related to the spacing between pillars. For a uniform grid, wider spacing results in fewer pillars per unit area, meaning each pillar must carry more of the atmospheric load. Atmospheric pressure is 0.1 MPa, and thus, if the pillar array spacing is λ, then the force on a pillar, in the square array, is F = 0.1*λ²; for example, increasing the pillar spacing from 20 mm to 40 mm increases the contact force on a pillar from 40 N to 160 N. However, the stress in the glass at each pillar location is not only a function of this force—it is also highly sensitive to the contact area and shape of the pillar contact. For the typical cylindrical contact, it is found that the mean contact pressure/stress will be σm = (0.1 * λ2) / πr²; which means for the pillar spacing from 20 mm to 40 mm, the mean contact pressure will increase from about 203 to 815 MPa (for a pillar of diameter 0.25 mm).
The small contact area between a pillar and the glass surface lead to a high contact pressure, which produces localised stress on the glass, Hertzian-type indentation, and potential initiation of cone cracks—a typical mode of brittle failure in glass under concentrated loads (Mouginot & Maugis 1985). These localized tensile stresses, at the edge of the contact zone, can exceed the strength of the glass, especially due to surface flaws or residual defects, leading to fracture. As a result, the geometry and size of the pillar are critical design parameters in determining the mechanical durability of a VIG unit.
However, there are notable advantages inherent to the VIG construction that mitigate some of the risks. Most importantly, the glass–pillar interface is enclosed within a dry, hermetically sealed vacuum cavity, which drastically reduces the presence of moisture. This is significant because stress corrosion cracking, a key mechanism of environmentally assisted crack growth in glass, requires the presence of water molecules to facilitate subcritical crack propagation (Wiederhorn 1967). In the absence of humidity, the cracks initiated by contact stress are less likely to extend under sustained loading, thus improving the mechanical reliability of the structure.
Moreover, the Hertzian cone cracks that do form as a result of indentation are generally in a stable mode of fracture. The associated strain energy release rate is low, and the stress field induced by the pillar is highly localized and decays rapidly with distance from the point of contact. This means that, under static atmospheric loading, the cone cracks tend to arrest naturally after short propagation and do not continue growing unless additional strain is applied. These characteristics, combined with the dry internal environment, allow VIG designs to operate with relatively high local stresses at the pillar– glass interface without compromising long-term mechanical performance—provided the pillar geometry, spacing, and material are carefully engineered. Figure 3 is a plot of the normalised stress profile, beneath and around a cylindrical contact. The stress is normalised using the mean contact pressure and spatially normalised using the radius of the circular contact on the glass.
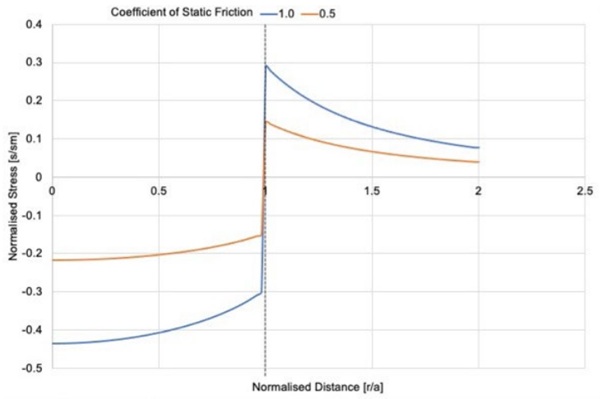
There is an effective analytical solution for the contact stress, which is given in Figure 3. This is a solution based on the Hertzian contact theory and also includes the effect of the surface contact friction. It is only for the stress due to the normal load applied on the pillar, where an additional component should be added to account for shear, or translational, loads that may be applied on a pillar. This shearing of the pillar occurs when the glass panes of the VIG are subjected to loads, such as wind or impact, which result in bending. In bending, the two glass panes, on either side of the mid-plane symmetry, will be in opposite directions, this results in a shear load over the pillars. Equation (3) and (4) are the analytical solution for the contact stresses, due to normal and shear loading, respectively, and includes a factor which is effectively surface contact friction.
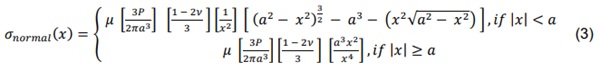
where x = radial position [mm], a = radius of contact area [mm], µ = coefficient of static friction, P = applied normal load [N], ν = Poisson’s ratio.
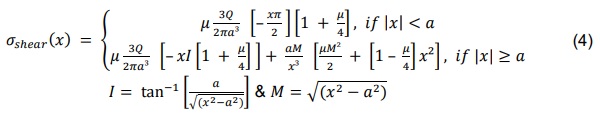
where x = radial position [mm], a = radius of contact area [mm], µ = coefficient of static friction, Q = applied shear load [N], ν = Poisson’s ratio. The total stress field on the glass surface is then equal to the addition of the normal and shear stress components.
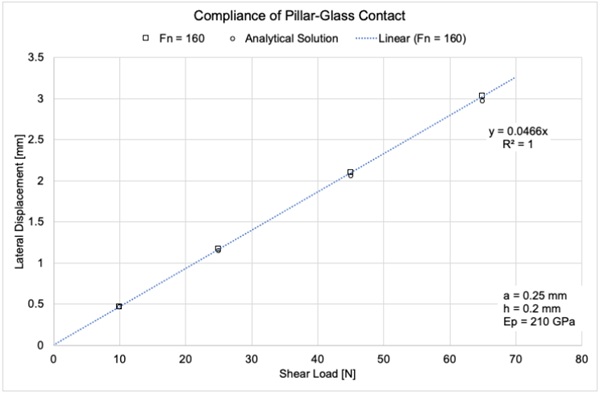
As mentioned, from external loads the VIG unit will experience overall bending, which produces a shearing load on the pillar-glass contact. For a cylindrical pillar, where the pillar is not extensively deformed under shear, there is compliance (and as such a local contact deformation) in the contact which is due to the deformation of the glass. Figure 4 is a plot of the relative lateral displacement of the surfaces on the ends of a pillar, for a cylindrical pillar under 160N of normal load (equivalent to atmospheric pressure and an array separation of 40 mm), as a function of the shear load. It is clear that the compliance of the pillar-glass contact is about 0.047 µm N⁻¹.
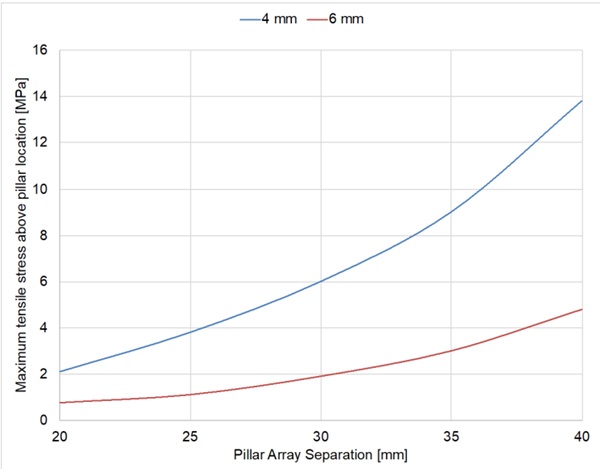
Additionally, atmospheric pressure produces bending of the glass between pillars which contributes to the mechanical deformation of the glass panes. This is influenced primarily by the spacing of the pillars and the thickness of the glass and is largely independent of the pillar shape or size, because the area of glass supported by a single pillar is much larger than the pillar size. The bending creates an isotropic distribution of tensile and compressive stresses, in the regions between pillars, over the glass. Even though the contact stress at the pillar–glass interface is often critical, the tensile stress resulting from the local stress above a pillar on the outer surfaces of the glass panes, usually labelled as surfaces 1 and 4, will dominate the design durability of the VIG unit. This is because the stresses on the external surface are exposed to the ambient environment, which is favourable to glass fracture.
If we take a single pillar as supporting a unit cell of glass, which is λ2 in area, then by using a simple periodic boundary condition at the edges of the glass, a simple analytical solution for the deformation of the glass under atmospheric pressure can be found. Equation (5) is a simple solution for this VIG unit cell case. However, this equation cannot fully include the effect of shear deformation in bending, which results in an undesirably high error. The most effective method of determining the deflection and stress is to solve the unit cell case using a finite element simulation. Nevertheless, equation (5) does highlight the physics of the problem and highlights the effect of the thickness of the glass.

where t = glass thickness [mm], λ = array spacing [mm], P = applied pressure [MPa], ν = Poisson’s ratio.
3. VIG design optimisation
In the previous sections the thermal and mechanical performance of the VIG was discussed. In this following discussion these values to brought together to determine a design optimum for the VIG design. This, however, is difficult to characterise since the design required is usually different because of application demands and user preference. Instead, here the data will be place together for user to make a final decision.
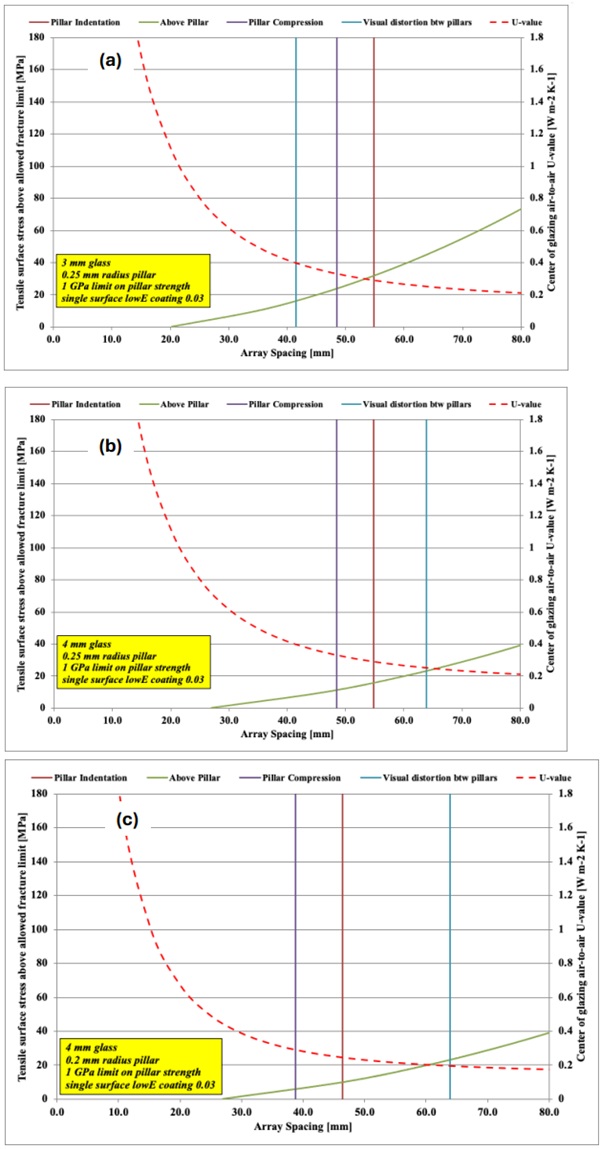
In terms of the mechanical performance, we will assume that only atmospheric pressure is acting on the VIG unit. In addition, we will assume that the long term loading limit for float glass is about 5 MPa. Figure 6 is a set of design plots for the VIG, with the glass thickness and other specifications as labelled in the plot. Right axis, and the dotted red line, is the plot of the air-to-air U-value, centre-of-glass. The left axis, green, red and purple solid lines, is the maximum tensile stress in the glass. The blue solid line is a plot to define the visual distortion that would occur because of the glass. This design plot is to be interpreted in the following way,
- The U-value is simply obtained from the red dotted curve, right axis,
- The limit for fracture due to tensile stresses on the external glass surfaces is given by the green solid curve, left axis. Where this curve crosses the x-axis is the maximum array spacing allowed, where the glass stress will be maximum 5 MPa. Any increase in array spacing will produce a higher stress, which is given by the green curve.
- For each of the vertical solid lines, as long as the array spacing required is to the left of these lines, then the limit for cone crack initiation (red line), pillar compressive failure (purple line), and the acceptable limit of visual distortion (blue line), will not be exceeded.
For example, the data in Figure 6a suggests that the pillar separation should not exceed 20 mm. If it does then there is a high probability of glass fracture because of the external surface tensile stresses above the pillars. Which in turn leads to a U-value of about 1 W m⁻² K⁻¹. Figure 6b is for the same VIG design, except that the glass panes are now 4 mm thick. Of course a thicker glass panes means that a higher stress can be sustained. This data now suggests that the array spacing limit is 27 mm, and a U-value of 0.7 W m⁻² K⁻¹ is possible. Of course a reduction in pillar size and thermal conductivity (from a metal to a ceramic) will reduce the U-value, which we see in Figure 8, where all parameters are the same as Figure 6b, with the pillar diameter smaller and the thermal conductivity now at 1 W m-1 K⁻¹, instead of 15 W m⁻¹ K⁻¹. Figure 6c suggests that the U-value can be as low as 0.4 W m⁻² K⁻¹, with no issues with conical cracks, or visual distortions.
It is also clear from these data that lower U-values could be reached if the glass strength could be increased. If we keep the limits of cone cracks, compresssive strength and visual distortions, then we see that in the three cases the U-value could be 0.4, 0.35, and 0.35 W m⁻² K⁻¹, respectively, where the pillar compression strength limits any further reduction in the U-value. What is interesting is that the glass would only need to be heat treated (strengthened) to about 20 MPa, to provide more than the needed prestress as a strength increase.
4. Conclusions
Work outlines the fundamental background for the thermal and mechanical performance of the pillars in a VIG unit. There is a critical balance between the thermal impact of heat flow through the pillars, and the mechanical strength required to provide the durability for the VIG. The design plots presented show that a choice can be made which will provide the desired U-value, while clearly highlighting the limits in the shape, size, number, and material properties, of the pillars. Clearly, it is possible to design a VIG unit as a highly insulating device which will be durable. With the available options to strengthen the glass panes, the U-value could be as low as 0.35 W m⁻² K⁻¹.
Acknowledgements
The authors acknowledge the Sydney Informatics Hub and the use of University of Sydney’s high performance computing cluster, Artemis, and the high-performance computing cluster at the School of Physics.
References
Collins, R. E., & Robinson, S. J. (1991). Evacuated glazing. Solar Energy, 47(1), 27-38.
Collins, R. E., & Simko, T. M. (1998). Current status of the science and technology of vacuum glazing. Solar Energy, 62(3), 189-213.
Collins, R. E., Turner, G. M., Fischer-Cripps, A. C., Tang, J. Z., Simko, T. M., Dey, C. J., ... & Garrison, J. D. (1995). Vacuum glazing—a new component for insulating windows. Building and Environment, 30(4), 459-492.
Kocer, C., Aronen, A., Collins, R., Asano, O., & Ogiso, Y. (2023). Measurement of heat flow through vacuum insulating glass part 1: measurement area in direct thermal contact with specimen. Glass Structures & Engineering, 8(1), 3-18.
Kocer, C., Aronen, A., Collins, R., Asano, O., & Ogiso, Y. (2023). Measurement of heat flow through vacuum insulating glass part 2: measurement area separated from glass sheets with buffer plates. Glass Structures & Engineering, 8(1), 19-39.
Simko, T. M., Fischer-Cripps, A. C., & Collins, R. E. (1998). Temperature-induced stresses in vacuum glazing: Modelling and experimental validation. Solar energy, 63(1), 1-21.
Mouginot, R., & Maugis, D. (1985). Fracture indentation beneath flat and spherical punches. Journal of materials science, 20, 4354-4376.
Wiederhorn, S. M. (1967). Influence of water vapor on crack propagation in soda‐lime glass. Journal of the American Ceramic Society, 50(8), 407-414.
WINDOW, The software platform and manuals can be obtained at; https://windows.lbl.gov/software-tools#windowheading


")