
Authors: Sneha Jain, Jan Wienold, Maxime Lagier, Andreas Schueler & Marilyne Andersen
Source: Building and Environment, Volume 234, ScienceDirect, Elsevier
DOI: https://doi.org/10.1016/j.buildenv.2023.110146
Abstract
While the influence of a glare source's spectrum on sensitivity to discomfort glare has been demonstrated repeatedly under electric light conditions, it has not yet been studied under actual daylit conditions. To investigate the influence of spectral alterations of the sun disc on glare perception when seen behind a colored glazing, we performed a cross-evaluation of occupants' visual comfort in a space either daylit through blue-tinted electrochromic (EC) glazing (20 participants) or through color-neutral glazing (55 participants), having selected two types of glazing that are widely employed in commercial buildings. Under both types of glazing, participants experienced four glare scenarios presenting different glazing transmittances (from low to extremely low) in which the sun was the only glare source visible.
Comparing the participants' responses to glare, we found that participants experienced discomfort more often in blue-tinted glazing compared to color-neutral glazing, even though glare metrics would have predicted higher levels of discomfort in these latter cases. This indicates that participants basically tolerated glare better under color-neutral daylit conditions compared to blue-colored conditions. To explain our findings, we considered four spectral discomfort glare sensitivity functions that have previously been proposed to replace the standard CIE V2°(λ) and applied them to the DGP and CGI glare metrics. However, none of these adjustments to glare metrics made any difference to our findings, which consistently showed an increased glare sensitivity under shorter wavelengths, indicating that its cause should be sought elsewhere. Some hypotheses are formulated at the end of the paper in this regard.
1. Introduction
Windows in a workplace environment are desirable for their many proven physiological, psychological and economic benefits such as provision of daylight, access to outdoor views and increasing the rental value of the space [[1], [2], [3]]. Daylight from windows can also help in improving health, productivity, and overall well-being [4,5]. However, daylight could also be responsible for discomfort glare which can cause occupants to block daylight out by closing the blinds for instance Ref. [6]. Therefore, reducing the likelihood of discomfort is essential to maximize the potential of windows for adequate daylight provision. A window's glazing properties play a key role in defining the quality and quantity of transmitted daylight in a space.
The switchable electrochromic (EC) glazing technology, for instance, allows to choose from a range of transmittance levels and can act as a glare protection at very low transmittance levels while still maintaining some view to the outside. Both simulation- and measurement-based analyses have been conducted in the past by research and industry groups, alongside multiple user assessment studies, to evaluate the potential of EC glazing in controlling comfort without blocking parts of the view [[7], [8], [9], [10], [11], [12]].
What has been less investigated is the effect, on visual discomfort, of the spectral shift towards the short wavelength range that commercially available EC glazing material typically exhibit in their darkened state, causing them to appear blue in color and resulting in a distortion of the daylight spectrum inside the space [13]. While a few studies have looked at the effect of that shift on ipRGC-induced effects of light [[14], [15], [16]], no study has yet focused on the effect of glazing color (or transmitted spectrum) on glare perception for colored or tinted glazing like EC glazing. In parallel, previous research conducted with electric light, mainly in the context of vehicular headlamps, has demonstrated that colored LEDs actually induce more discomfort glare than white LEDs. And among the colored LEDs, the blue ones gave the highest glare complaints [[17], [18], [19], [20], [21], [22]]. Note that since the daylit spectrum filtered through blue EC glazing is different from the one generated by blue LEDs, it is not known yet whether the higher sensitivity to glare observed with blue headlamps would hold true in colored daylit spaces with chromatic glazing.
Since multiple types of glazing – from solar-protective glazing to colored PV panels, dye-sensitized solar cells (or simply the glazing chosen to be colored for aesthetic purposes) – can alter the SPD of transmitted daylight (that is in fact also changing as a function of weather and time of day), it is worth studying the influence of a glare source's spectrum (once altered by a colored glazing) on the perception of discomfort glare. To investigate this, visual scenarios with neutral glazing should be compared to the scenarios with colored glazing that would alter the spectrum of the daylight glare source while keeping the perceived glare within similar range.
We should note that recently published studies on next-generation EC materials have demonstrated that broadband modulation of spectral transmission was made possible by the incorporation of molybdenum into the tungsten trioxide thin films (WO3:Mo), which allows to improve significantly the color-neutrality of the EC glazing in the dark state while further reducing the transmittance for glare control [23,24]. Although these types of glazing are not yet commercially available, they offer great promise when it comes to occupant satisfaction, as visual comfort research has pointed out repeatedly that occupants generally prefer color-neutral illumination as it allows more natural looking environments [25,26]. Furthermore, recent studies on thermochromic windows have also indicated that blue tinted glazing were least acceptable among the occupants [27,28].
Based on these findings, the present study aims to compare glare responses from space occupants under blue versus color-neutral scenarios by performing a cross-evaluation of two controlled lab studies conducted in the same office-like environment under blue-tinted EC glazing and color-neutral glazing respectively. To the best of our knowledge, the present study is the only one that investigates the influence of broadband blue light source spectrum (sun disc altered through colored glazing) on glare perception in a workplace environment with daylight as the only light source.
2. Background
As per the definition provided by the International Commission on Illumination (CIE), discomfort glare causes visual irritation or annoyance without necessarily impairing the vision [29]. A majority of discomfort glare metrics quantifies glare in human visual field by evaluating photometric and geometric quantities including: 1) luminance of the glare source, 2) adaptation level (luminance of background or vertical illuminance at the eye), 3) size of the glare source, and 4) position index. In these glare metrics, photometric properties represented by luminance and illuminance are characterised by photopic luminous efficiency function V(λ), which is unanimously used in majority of the lighting applications.
2.1. Photometric considerations when evaluating glare
V(λ) is the spectral weighting function that defines the relative visual effectiveness of light of different wavelength [30]. It was first proposed by CIE in 1924 for 2° visual field (V2°(λ) or simply V(λ)), which continues to be the basis of all the photometric measurements [31]. Since then, there have been several revisions to the V2°(λ) function, specifically to improve the sensitivity in the short-wavelength region (modification by Judd-Vos [33,34] adapted by CIE 1988 as VM(λ) [34]). The most recent one has been published by CIE TC 170–2 in 2015 [35], based on the physiologically derived cone-fundamentals by Sharpe and Stockman [36] as a linear function of L and M cones. Typical methods to derive V(λ) include side-by-side matching task or flicker photometry to determine relative brightness perception at the different wavelengths of the visible spectrum under constant and neutral (achromatic) adaptation [32,34].
V(λ) has a utility over a range of practical visual tasks for characterising luminous stimulus as reviewed by Lennie et al. [37]. However, several previous research has shown that the V(λ) function has limited applicability in conditions that fall outside those in which the function has been developed, whether these “new” conditions are: conditions involving chromatic and colored background adaptation [31,39,40], conditions including large-sized stimuli [40], stimuli which are off-axis [41] or long duration stimuli with short wavelength targets [[38], [42]] or even age-related reduction in efficiency [43]. Moreover, it has become well known that the spectral sensitivity of the human eye changes from the fovea towards the perifovea of the retina, which is attributed to the density of the cones and presence of blue-light filtering macular pigments in the macula [44].
Most of the real-world daylight discomfort glare scenarios actually do include conditions with large field, off-axis and longer duration stimuli, and/or non-neutral adaptation, which therefore all represent conditions where the classical V(λ) falls short in predicting luminance. In addition, studies have shown that photopic luminance may not necessarily predict the brightness perception [[45], [46], [47]] which is closely associated with glare perception since glare can occur due to excess of brightness [17,48]. Previous literature has also shown several times that the iso-luminant glare sources of different SPDs and correlated color temperature create different perception of discomfort glare [19,20,22,49]. This further indicates that V(λ) might not be the correct weighting function to derive luminance in such cases. As V2°(λ) is only applicable when the light source lies in fovea and within 2° visual field, CIE has adopted an alternative function called V10°(λ), defined by Stiles and Burch [44] that quantifies photopic sensitivity of eye for 10° visual fields [50]. Since oftentimes glare source lies outside the fovea, V10°(λ) represents a physiologically more accurate quantification of luminance in parafoveal field. Therefore V10°(λ) is used as one of the functions for quantifying photometry of the glare scenes in this study (see section 2.2, Eq. (4)).
2.2. Influence of color on glare perception
Discomfort glare studies conducted with colored electric light sources in the context of automotive applications have shown that the color or spectrum of the glare source can influence discomfort glare perception. Flannagan et al. [51] evaluated glare response from 16 subjects for monochromatic light sources of equal illuminance at six wavelengths on a 9-point response scale and showed that the lowest glare perception was at 577 nm stimulus and highest at 480 nm. Another study by the same authors showed that the High intensity discharge lamps with more blue light evoked higher estimates of discomfort glare than the Tungsten Halogen lamps [21]. Similar results were demonstrated by Sivak et al. [18], where the discomfort glare ratings were linearly related to the amount of blue content in LEDs as weighted by the S-cone sensitivity function. Bullough [52] published experiments where participants evaluated glare from near-monochromatic light sources from 450 nm to 700 nm at 5° and 10° field, and found consistent results of higher glare perception at shorter wavelengths.
The same author also proposed a new V(λ) function for discomfort glare (referred to as VDG1(λ), see Eq. (1)), hypothesizing that S-cone response have a higher contribution in discomfort glare mechanism. However, this model failed to predict the data from Fekete et al. [19] who proposed another model based on their findings. Their model includes the contribution of two chromatic channels (L-M and the (L + M)-S cone inputs) and of the achromatic channel (L + M), as shown in equation (2) with the best-fitted scaling factors. Kimura-Minoda and Ayama [53], on the other hand, tested six colored LEDs from 459 nm to 620 nm of two red, green, blue, amber, white color and a tungsten-halogen bulb and found that blue LED caused most discomfort while the other LEDs produced a similarly lower discomfort. Based on their own findings, they proposed the luminous efficiency function shown in equation (3) and based on spectral sensitivities of the red-green and yellow-blue opponent chromatic channels.
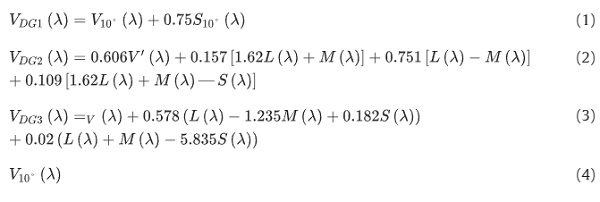
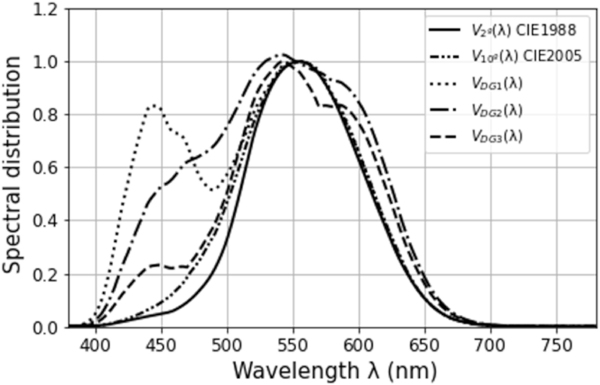
A comprehensive review and assessment of these different photopic luminous efficiency functions has been conducted by Yang et al. [17]. The authors have shown that the glare metrics based on these functions can better account for the effect of color on glare perception and work better in comparison to the Unified Glare Rating (UGR) metric (that is based on V(λ)). Fig. 1 plots these functions across the visible range and compare them to the CIE V2°(λ) and V10°(λ) functions. It can be observed from the figure that all of these functions have higher variance in spectral sensitivities under shorter wavelength region compared to longer wavelength region.
While several studies consistently indicate the presence of an effect of color on glare perception for electric light sources, there are no studies found in literature that investigate the effect of color on one's perception of glare when dealing with daylight-induced glare sources. Furthermore, none of the daylight discomfort glare metrics have ever implemented previously proposed spectral discomfort glare sensitivity functions VDG(λ) to extend their applicability under colored daylit scenarios. To address this gap, we will investigate the effect of color on glare perception under exclusively daylit environments in office settings and compare how well glare metrics will be able to anticipate perceived glare in blue versus color-neutral daylit conditions once they have been modified based on the three VDG(λ) functions (Eq. (1) to Eq. (3)) as well based on the V10°(λ) (Eq. (4)) compared to the standard metrics (i.e. using V2° (λ)).
3. Objectives
This study is articulated in two phases:
1) First, we compare the glare responses and derived glare metrics thresholds from the participants survey answers under blue-tinted (n = 20) versus color-neutral glazing (n = 55) exhibiting different transmittances (all low). The goal is to determine whether their glare perception and thresholds varies as a result of changing the glare source's color under specific viewing position when sun is in the field of view (FOV). Two discomfort glare metrics were chosen and evaluated to derive glare thresholds: Daylight Glare probability (DGP) [54] and CIE Glare Index (CGI) [55], both identified as reliable and robust glare metrics in past studies [7,56,57].
2) If the effect of spectrum is found, we re-calculate those same glare metrics but using the four proposed spectral discomfort glare sensitivity functions listed in section 2.2 (Equations (1), (2), (3), (4)) and as per the method described in section 4.6. The idea here is to determine if any of these functions can improve the reliability of the glare metrics when it comes to anticipating how people actually perceive glare by allowing to include the effect of the glare source's spectrum.
4. Method
4.1. Experimental setup
4.1.1. Study design
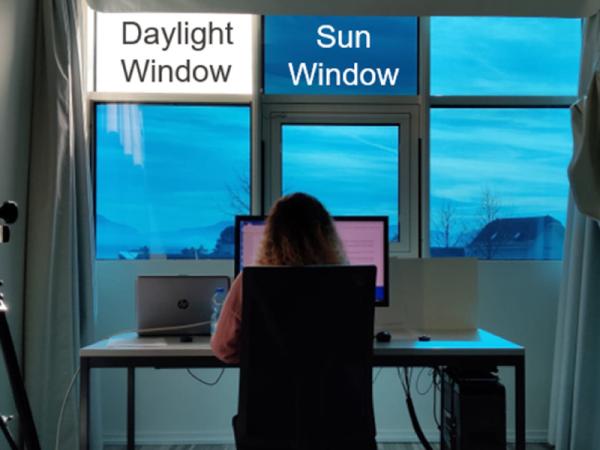
We cross-evaluated the data from two controlled user studies conducted in an office-like setup (Fig. 2) with total 75 participants: the first study involved 20 participants and included blue-tinted EC glazing in the façade, the second study involved 55 participants and color-neutral glazing. The only glazed façade in the test room was south facing. These two studies were conducted in winter months (November 2018 through March 2019 and November 2020 through March 2021) in Lausanne, Switzerland under sunny conditions to benefit from low sun angles (view was unobstructed towards the sun). Experiments were conducted for one participant at a time coming for 2 h between 09:00 to 14:30. In each of the studies, participants provided their visual comfort perception under four pre-defined experimental glare conditions, each of which had the sun disc as the only glare source. Both studies were similar in terms of study protocol and procedure, participants’ demographics, experiment duration, survey questionnaires, test room and equipment settings and differed only on the following key aspects:
i) Sample size: while the number of participants differed between the studies, the lower sample size (n = 20, blue EC glazing study) was still sufficient based on an a priori analysis using G Power tool [7,58]; furthermore, we performed a relative rather than absolute comparison due to the imbalanced samples which allowed us to evaluate interesting statistics between the studies, further discussed in sections 4.7 and 5.3.
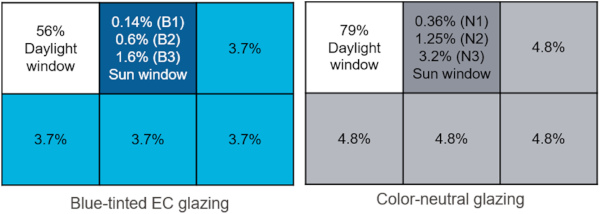
ii) Glazing color: the blue vs. color-neutral tint of the glazing, depicted in Fig. 2 was the main independent variable; we investigated its effect on our dependent variable, namely glare perception.
iii) Glazing transmittance: the visible light transmittance of the glazings, provided in Fig. 3, were initially planned to be similar between the two studies so as to only have a color variation; however, due to wrong manufacturer data, slightly higher transmittances were ultimately reached in the color-neutral glazing compared to blue-tinted glazing. In our analysis, we will therefore consider the impact of glazing transmittance as well.
4.1.2. Participants
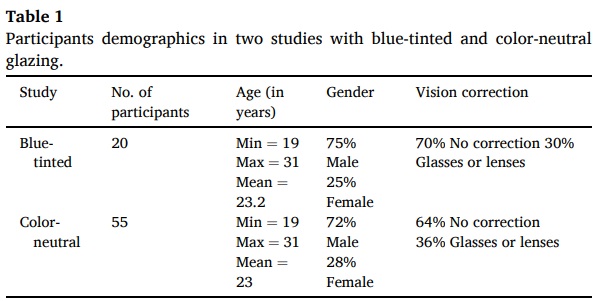
Participants were university students aged 18 to 31 (mean age = 23yrs). The requirements for selection were to be in healthy conditions, have a normal color vision (tested using Ishihara and D-15 disc arrangement CVD tests [59,60]), no other visual impairment, have a BMI within the normal range, an English proficiency level C1 or higher, not to use drugs or have an excessive consumption of alcohol, and abstain from alcohol before the experiment day. To avoid any response bias, another exclusion criterion was to be from a discipline related to the investigated field (i.e., architecture or civil engineering) or to have any link to the researchers' topic or the laboratory. Participants were compensated as per local regulations. The project protocols were approved by the Human Research Ethics Committee at EPFL (ref. No. HREC 035–2019) and by the cantonal ethics commission of canton Vaud, Switzerland (ref. No. CER-VD 2020–00667). Table 1 summarizes the participants’ demographics (age, gender and vision correction) for both studies: we can see that all the participants come from a similar sampling population, making the two studies comparable with each other from that perspective.
4.1.3. Test room and equipment description
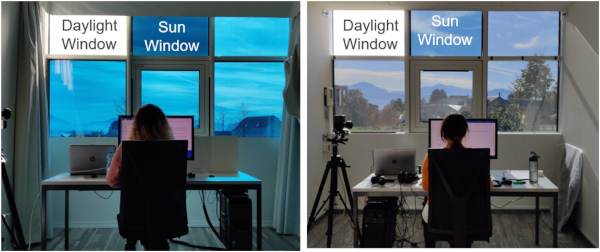
The two test rooms (one used for the blue-tinted scenarios, using EC glazing, the other for the color-neutral scenarios, using films applied on standard glazing) are shown in Fig. 2 (left and right, respectively). They are located on the EPFL campus (46°31′00.4″N 6°33′47.1″E) in Lausanne, Switzerland. During all experimental sessions, the thermal (room temperature, humidity, CO2) and visual parameters (horizontal illuminance at desk, vertical illuminance at eye level, daylight spectrum at eye level) of the room were measured every 30 s throughout the experiments. Thermal parameters were kept within comfortable levels to avoid any confounding effect. We measured global (total) and diffuse solar irradiance (W/m2) with an SPN1 Pyranometer (wavelength range: 400 nm–2700nm) installed near the test room location to monitor weather conditions and utilize these measurements to define sun as described later in section 4.6.
We used a calibrated luminance camera LMK 98-4 by TechnoTeam [61] with a fisheye lens (type Dörr Digital Professional DHG, equidistant projection) to capture high dynamic range (HDR) images of all the experimental conditions at participant's eye position before and after their exposure to the condition. The LMK luminance camera is an absolute-calibrated Image Luminance Measuring Device (ILMD) equipped with a V(λ) filter to accurately measure the luminance of each pixel in the captured scene [62]. To capture the sun without any pixel overflow, we used Neutral Density (ND) filters ND3 (factor 1112) for blue-tinted glazing and ND4 (factor 9366) for color-neutral glazing. The ND filters provided by the camera manufacturer exhibit a nearly constant spectral transmission in the visible range. A handheld illuminance sensor was mounted below the lens of camera to compare illuminance values derived from HDR images. Images were captured using the Labsoft software available for the LMK camera. Further details about the test room and the specifics of the installed equipment can also be found in Section 2.2 of Jain et al. [7].
4.2. Experimental conditions
Each participant experienced four experimental conditions in randomized order, with the sun close to their central FOV as the only glare source, in the presence of either blue-tinted (study 1) or color-neutral glazing (study 2) without any electric light. The four experimental conditions were created by varying the transmittance of the windowpane from where the sun was visible for the participant (“sun window” in Fig. 2, Fig. 3). For the blue-tinted conditions, commercially available EC glazing was resorted to, which allows the transmittance of each windowpane to be individually controlled by a digital interface (Fig. 2 left). Whereas color-neutral conditions were achieved by attaching the color-neutral window films with low transmittances on the clear acrylic panels fixed to a double-pane glazing and these acrylic panes were manually changed during the experiment to vary the transmittance (Fig. 2 right).
Participants were seated in a way to have the “sun window” always in their central field of view: to achieve this throughout the 09:00 to 14:30 time window, the participant's desk was always placed in order to face the window and was rotated as per the sun position throughout the experiment duration to maintain the same viewing direction towards the sun. We acknowledge that while this viewing direction is not recommended for office environments, it provided the most critical condition for glare evaluation, which was the point of the study.
As far as the other windowpanes are concerned, one, labelled as “Daylight Window” in Fig. 2, Fig. 3, was always kept at the maximum transmittance possible for its respective façade system (EC glazing vs clear glazing) to allow sufficient daylight in the room and to minimize the effect of low color-rendering inside the room: this was a choice based on the recommendations from previous studies to maintain the neutral illumination inside the room [26,63,64] that additionally allowed to minimize any confounding effect on glare perception that would be due to a distorted color perception inside the room (cf. section 5.1 for more details). The position of the “Daylight Window” itself (either upper left or upper right position) was chosen with the aim to minimize the risk of direct sun patches close to the desk. The rest of the windowpanes were kept at the same level of low transmittances within each study as shown in Fig. 3 to avoid glare from these panes.
For this article, we selected and evaluated three experimental conditions from each of the studies: the excluded condition under blue-tinted glazing is the one where the sun was in peripheral FOV of the observer and under color-neutral glazing the one where the sun window transmittance was of 4.8%. The reason for this exclusion in both cases was to ensure comparability between the two types of glazing, whether in terms of viewing direction towards the sun or too high transmittance, respectively. The three experimental conditions analysed in this paper from each of the two studies are referred to as B1, B2 and B3 for the blue-tinted EC glazing and as N1, N2, and N3 for the color-neutral scenarios in Fig. 3, numbered in increasing order of the sun window transmittance. These conditions are further exemplified in Fig. 4 as falsecolor luminance images captured using the LMK camera and later processed in Radiance lighting simulation tool. It can be observed from Fig. 4 that the intensity and size of the sun is increasing as the sun window transmittances are increasing.

As our initial design intention was to keep the color-neutral and blue-tinted glazing at the same level of transmittance, we made sure to order color-neutral window films with similar transmittance values as the blue EC glazing values reported by the manufacturer. However, when confronted with our findings, we measured the spectral transmittances of the EC glazing in a professionally equipped laboratory specialized in nanotechnology as per the procedure described by Steiner et al. and found the measured transmittance values to be substantially lower than the ones reported from the EC manufacturers, as briefly mentioned earlier (section 4.1.1). This explains the difference in τv values between the two experiments seen in Fig. 3.
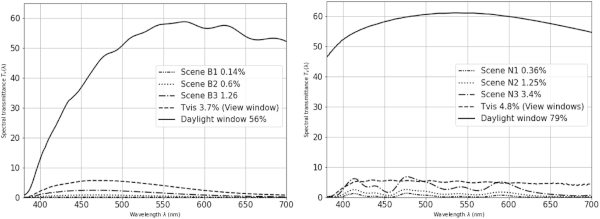
The measured spectral transmittances of the glazings are shown in Fig. 5. We compared the color quality rendered by the color-neutral films (CRI 98.6) to the D65 illuminant (CRI 100) and found them very close to each other. This was done to ensure that the neutral films preserve the naturalness of the perceived colors. The measurement procedure and setup are described by Steiner et al. [65]. We report the normal-hemispherical visible light transmittance (τv,n-h) for all the windowpanes used in our experiments in Fig. 3. The measurement uncertainty of a τv,n-h measurement is less than 0.001 [65].
As shown in Fig. 3, we evaluated three levels of sun window transmittance for blue-tinted EC glazing (τv = 0.14%, 0.6%, 1.6%) and for the color-neutral glazing as well (τv = 0.36%, 1.25%, 3.4%). The top-right (or top-left, depending on the time of experiment) windowpane was kept at maximum transmittance of τv = 56% for blue glazing and τv = 79% for color-neutral glazing, to allow sufficient daylight (“Daylight window” in Fig. 2, Fig. 3). The remaining window panes were kept at constant transmittance of 3.7% for blue-tinted glazing and 4.8% for color-neutral glazing. Fig. 5 shows the measured spectral transmittance under visible range for blue-tinted (τv = 1.6%) and color-neutral (τv = 1.25%) glazing.
4.3. Experiment procedure
After entering the test room, participants were first briefed about the experiment by the researcher in electric lighting setting with closed window shades, following a single blind procedure, i.e., not revealing the true hypothesis of study which could potentially lead to demand characteristics bias [66]. After the briefing, the participants answered some background survey questions about their demographics, mood, and indoor environmental preferences. This phase was followed by a break in which the participants wore an eye mask and listened to music to allow dark adaptation, while the researcher prepared the room for exposing the participant to a first experimental condition. Each participant was exposed to four experimental conditions, experienced one by one in a randomized order to avoid anchor point bias [67]. Under each condition, the participants performed a pre-defined typing task for about 8 min to allow adaption to the experimental condition and simulate an office environment.
After the completion of task, they filled in an online survey reporting their level of visual and thermal (dis)comfort and satisfaction, discomfort glare, color perception of outdoor and indoor environment. Each condition was followed by a dark-adapted break. During the break, the researcher captured the HDR image of the preceding condition from the participant's eye position and measured the associated vertical illuminance value. Afterwards, the researcher changed the ‘sun window’ transmittance to set the upcoming condition and rotated the desk position to have sun visible through the ‘sun window’ close to the participant's central FOV. Following this, the HDR capture and illuminance measurements were repeated. At the end of the experiment, the participants filled out a debriefing questionnaire to report their overall experience regarding the comfort. The entire experiment lasted about 2 h for a given participant.
4.4. Survey questionnaires
Participants answered several questions reporting their visual and thermal comfort, color perception, view out perception and satisfaction during their exposure to each condition. In this section, we detail out only the questions pertaining to discomfort glare that were asked in both the studies, listed in Table 2.
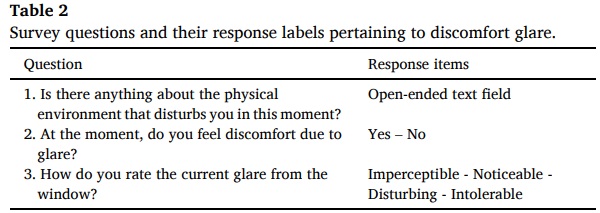
An open-ended question (question 1 in Table 2) was asked in the beginning of the survey. Its aim was to allow participants to report any disturbance due to physical environment of the room without drawing attention to any specific comfort parameter such as glare, while at the same time evaluate if the participants mention glare in their answers since this was the only independent variable in the tested conditions. Questions 2 and 3 from Table 1, which were answered on the binary and Likert (ordinal) response labels respectively, were adapted from previous visual comfort studies [[68], [69], [70]]. As further analysed in section 5, their objective was to inform on the participants’ glare perception in all experimental conditions and, more specifically, to compare the responses between the blue-colored and color-neutral daylit conditions to determine differences in glare perception owing to the influence of color.
4.5. Data cleansing and post-processing of HDR images
We applied specific data cleansing rules on the collected data to maximize their reliability and robustness: 1) we discarded the test cases where the deviation in measured global horizontal irradiance (GHI) was more than 25% ((GHImax-GHImin)/GHImean) to ensure stable weather conditions over the duration of participants' exposure time; 2) whenever the sun was hidden by the window frame or any other object within the participants' FOV (based on the visual inspection of the collected HDR images of all the test conditions), the associated data were discarded; 3) whenever the HDR images were found overexposed due to a camera error that couldn't be resolved to obtain accurate luminance maps, the associated data were discarded.
Using the LMK camera, scene images were captured in “.pf” (picture float) format and were converted to “.hdr” format which is required to run evalglare [71] to derive photometric quantities and glare metrics from the images. All the images were analysed for pixel overflow, which was found in 20 cases for which measured vertical illuminance values were substantially higher (>25%) than the image-derived vertical illuminance values. In these cases, the associated images were corrected, rather than discarded, by replacing the overflow pixels matching the measured vertical illuminance.
4.6. Glare metrics derivation from the HDR images
4.6.1. Based on standard CIE V2°(λ)
Standard glare metrics CGI and DGP based on V2°(λ) were derived from the HDR images of the experimental scene using zonal method of Evalglare [71] tool in radiance lighting simulation engine. The default glare source detection method in Evalglare uses an absolute threshold of 50,000 cd/m2, i.e., every pixel above this value is regarded as a glare source. However, applying this method will indeed lead to different sizes of glare sources (colored sun disc) seen through blue-tinted and color-neutral glazing due to the differences in the visual transmittances of glazing being tested between both cases. Therefore, to remove this bias we implement zonal calculation method in Evalglare by specifying a zone of 5.8° diameter (opening angle = 0.101229, ω = 0.00804651 sr) around the sun position and calculate average zonal luminance integrated over this 5.8° zone. This method would ensure that the glare sources of the same size are evaluated in the two studies, and can thus be compared. This choice of glare source size (∅ = 5.8°) was based on the fact that the FOV of the pyranometer measuring the DNI of the circumsolar region uses a 2.9° half aperture angle [72] (i.e. a 5.8° diameter too) and that ASTM G173 standards [73] define the standard sun spectra also for a 5.8° diameter around the sun.
Note that most of the devices measure ranges that are approximately 10 times larger than the solar disc angle (annual average approximately 0.533°). Using a 5.8° cone therefore leads to an increase of the considered solid angle by a factor of about a hundred compared to the solid angle of the sun itself (8.05e-3 sr <−> 6.797e-5 sr). Due to energy conservation, the luminance of the glare source is therefore reduced also by factor of approximately 100 – leading to a much lower impact of the sun region on perceived glare due to the proportionality between glare and log L2·ω. For that reason, the calculated thresholds for glare metrics in this study cannot be compared to other studies or to existing standards. However, since we are conducting a comparison between discomfort perception towards blue and color-neutral glare sources on a relative basis, the absolute thresholds are not of concern. Furthermore, there are no studies to the best of our knowledge that investigated the thresholds relevant to (or the algorithms applicable to) determining glare source sizes.
4.6.2. Based on additional four spectral discomfort glare sensitivity functions
Similar to standard metrics calculations, to derive the modified glare metrics, we first calculated the 5.8° zonal sun luminance weighted over four VDG(λ) functions (eq. (1) to eq. (4)) that was previously discussed in section 2.2, made explicit in Equation (5). Since the measuring equipment used in this study employ a V2°(λ) function to measure illuminance and capture HDR imaging, a reference standard solar spectra provided by ASTM G173-03 [73] was used to create the sun spectrum. This sun spectrum was scaled to match the on-site measured DNI averaged over the duration of each experimental exposure resulting in Ελ used in Eq. (5). Ελ was integrated with the measured spectral transmittances (Τλ) of the blue and neutral glazing used in the six considered experimental conditions. The photopic luminance efficacy equivalent value (Km) for α-opic functions was based on the “CIE metrology system of optical radiation for ipRGC-influenced responses to light” [74] and we used the libraries from the open-source “color” package in python to derive α-opic weighted glare source luminance over 5.8° zone.
![]()
where LDG is the luminance of glare source weighted by VDG(λ), Km is the photopic luminance efficacy equivalent value for VDG(λ) function, Eλ is the scaled spectral irradiance of sun for 5.8° diameter, Tλ is the measured spectral transmittance of the glazing, and VDG(λ) is the luminous efficiency function for discomfort glare as defined in Eqs. (1), (2), (3), (4)).
Similarly, we calculated the vertical illuminance at eye level weighted by the four VDG(λ) functions (eq. (1) to eq. (4)). For calculating the direct part of vertical illuminance (Edir) which is contributed solely by the sun, we followed similar approach as mentioned above for the adjusted sun luminance calculation. For the total vertical illuminance at eye level (Ev), we incorporated measured spectral irradiance profile at eye level for all the glazing configurations using the spectrophotometer data and weighted the total spectral irradiance by VDG (λ) and scaled it to match the measured vertical illuminance at eye.
These modified luminance and vertical illuminance values were used in glare equations (6), (7)) to calculate modified DGP and CGI metrics.
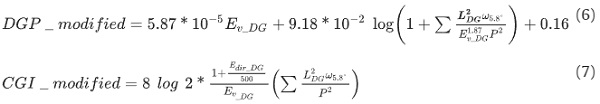
where LDG is the luminance of the glare source weighted by VDG(λ) (eq. (1) to eq. (4)), Ev-DG is the total vertical illuminance at eye level and Edir-DG is the direct component of vertical illuminance adjusted as per VDG(λ) (eq. (1) to eq. (4)), w5.8° is the solid angle of the glare source (=0.00804651 sr), and P is the position index of the glare source.
4.7. Statistical methods
Descriptive statistics and boxplots were used to understand the distribution of the photometric characteristics of the experimental conditions and compare the blue-colored and color-neutral daylit conditions. We further used bar plots to compare the discomfort glare perception reported by participants under blue and color-neutral glazing.
In our analyses, we implemented two additional diagnostic tools, the ROC curves (receiver operating characteristic curve) and the PR curves (Precision-recall operative curves) to evaluate the performance of glare metrics in discriminating comfort and discomfort situations and to calculate the glare threshold distinguishing comfort from discomfort. We used a bootstrap approach for robust calculations of AUCs (area under the curve) and optimal glare thresholds, using the package cutpointr in R software [75]. Higher AUCs here indicate better prediction models: Hosmer-Lemeshow [76] categorizes values > 0.7 as acceptable, values > 0.8 as excellent and Safari et al. [77] describe values between 0.6 and 0.7 as poor.
A ROC curve plots the true positive rates (TPR) on the y-axis and the false positive rates (FPR) on the x-axis for each glare metric value, which varies between 0 and 1. On the other hand, a PR curve plots the positive predictive power or Precision on the y-axis (expressed as the ratio between true positives and the sum of true and false positives i.e. how good a model is at predicting the positive class) and true positive rates (TPR or recall) on the x-axis. It should be noted that PR curves tend to be more informative and robust when evaluating imbalanced datasets compared to ROC curves, which can be rather optimistic on imbalanced data with fewer samples of the minority class [78].
In glare studies, the balance of binary classification data depends on the stimuli range shown to the participants and on the questionnaires used to create the binary classification. To counter this, we checked for a balance between glare and no glare cases in our dataset to implement ROC and PR curves methods accordingly. In the case of ROC curves, to obtain the optimal glare threshold, we used the point on the curve that has the minimum distance from the (0,1) i.e. the point closest to the top left corner of the curve. For the PR curves, it was instead the point closest to (1,1) or closest to top right corner of the curve that was taken as the optimal threshold. These glare thresholds were used as an indicator to compare under which glazing the participants were better able to tolerate glare. We also used the Spearman rank correlation [79], a non-parametric test, to check the ability of the chosen glare metrics to predict the participants’ glare discomfort votes on ordinal response labels for the given sample size.
5. Results
A total of 210 datapoints (60 from the blue-tinted and 150 from the color-neutral studies when including the three considered experimental conditions seen by each participant) were gathered from a total 75 participants. After applying the data cleaning rules described in section 4.5, we had to discard 7 datapoints from the blue-tinted study and 18 datapoints from the color-neutral study, resulting in a total of 185 datapoints (53 datapoints in blue-tinted and 132 in color-neutral glazing conditions). In this section, we will present the statistical analyses performed on the clean dataset only.
5.1. Spectral and photometric characteristics of the experimental conditions
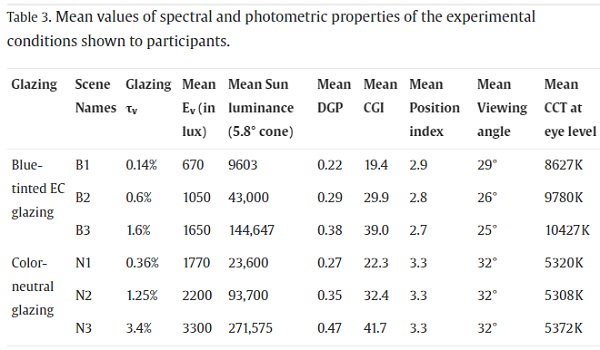
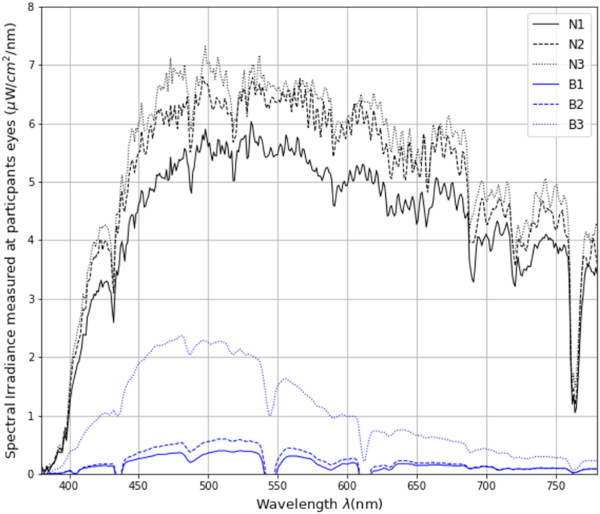
In this section, we compare six experimental conditions, for which, beyond the glazing transmittance of the sun window, several other attributes have been measured or can be inferred. As shown in Table 3, these include: the measured vertical illuminance at the eye (Ev), the HDR image-derived sun luminance, the glare metrics DGP and CGI (calculated as per the method described in section 4.6.1), the position index of the glare source, the viewing angle between the sun and the observer, and the mean CCT measured at participants' eye level. Fig. 6 plots the spectral irradiance measured at the participants’ eye level with blue and neutral glazing. It can be seen from the figure that with the blue glazing, we were able to minimize the domination of the blue tint inside the room, hence preserving the naturalness of indoor elements by having the daylight window. As a result, the color inside the room were rated as natural by a majority of the participants (76%).
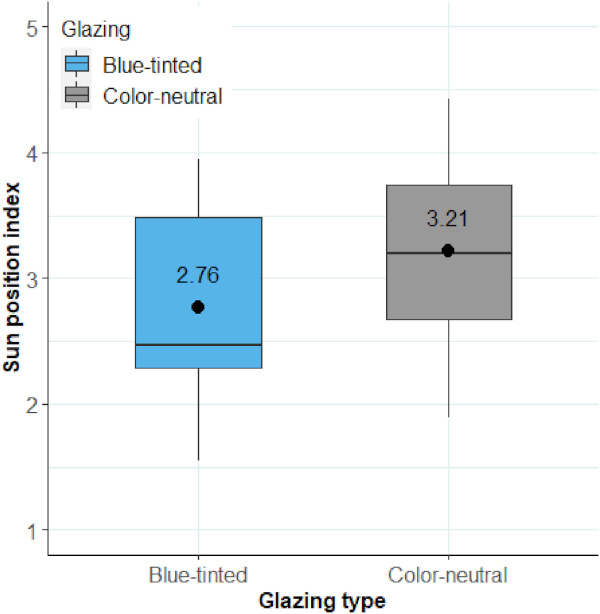
Regarding the photometric properties, we can observe large differences between the six experimental conditions when it comes to glare source luminance or vertical illuminance at the eye – which were expected given how much the glazing transmittances differed between the conditions. We can also note that the position index (Fig. 7) and viewing angle towards the glare source are very similar within the blue and color-neutral conditions but not between these conditions: this can be explained by the fact that the lower windowpane had to be used as the sun window (i.e. containing the glare source) in a few instances in the blue glazing conditions and a larger number of experiments happen to have been conducted with higher sun positions under color-neutral glazing, which in combination resulted in smaller position indices for the blue-tinted conditions as seen in Fig. 6. Despite these variations in position index, it should be noted that the sun disc was consistently seen within the central FOV of the participants in all the situations.
To validate the accuracy of the collected HDR images, the vertical illuminance calculated from the images were compared to the vertical illuminance measured using a hand-held illuminance-meter during the experiments. The scatter plot in Fig. 8 shows that the measured and image-derived Ev have a strong correlation (Pearson's r = 0.98) and the normalised RSME between the measured and image-derived values is 7%, and the normalised bias is 1.3%.
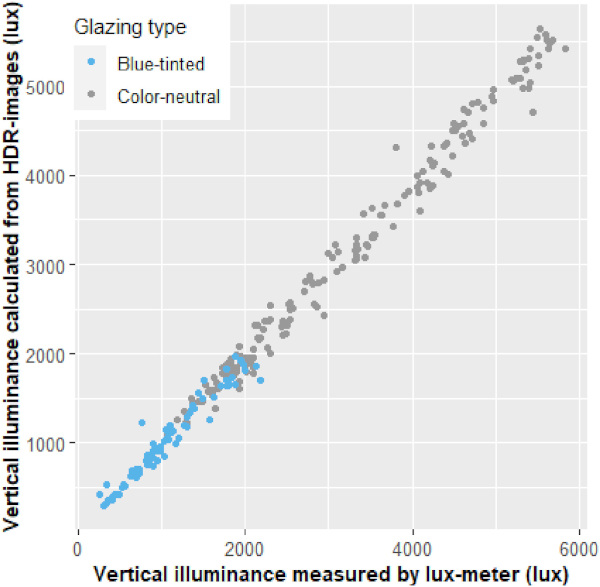
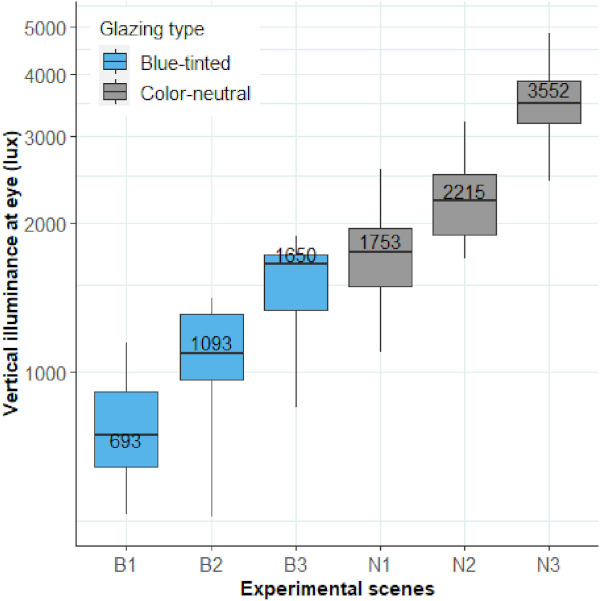
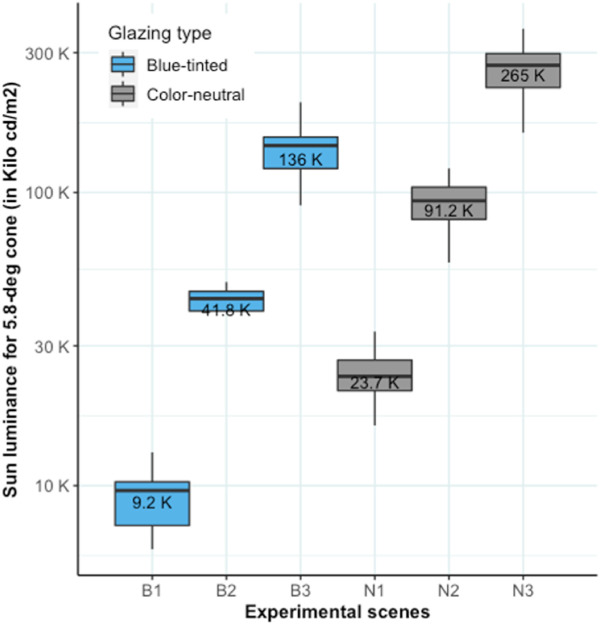
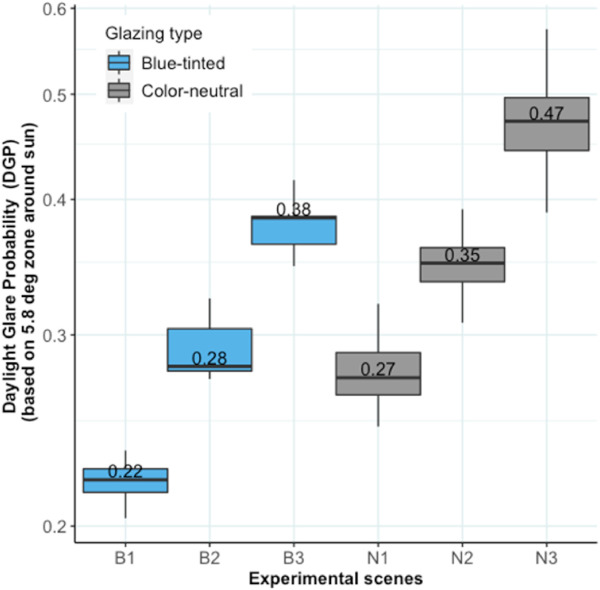
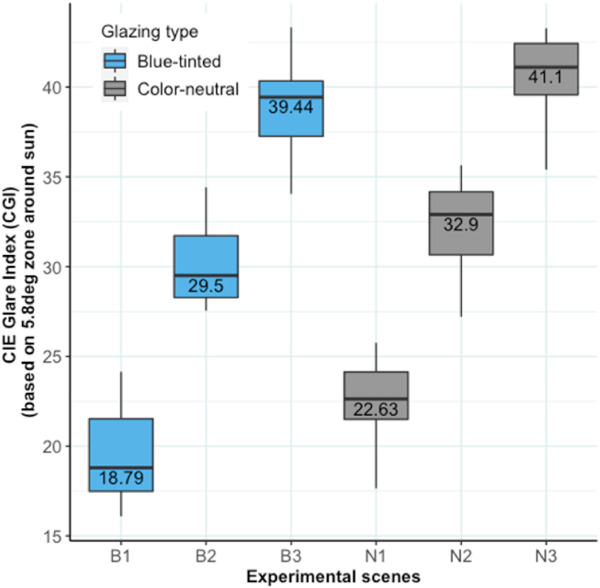
Fig. 9, Fig. 10, Fig. 11, Fig. 12 depict the distribution of Ev, of the sun luminance over the 5.8° zone around the sun, and of the DGP and CGI metrics for the six considered experimental cases, in the form of boxplots with median values. The sun luminance, CGI and DGP values are directly proportional to the ‘sun window’ glazing transmittance in the increasing order of B1, N1, B2, N2, B3 and N3 experimental scenes as seen in Fig. 10, Fig. 11, Fig. 12. We can also observe that glare metrics of all the categories have higher values in color-neutral scenarios compared to blue-tinted scenarios. While the Ev values are always higher for the color-neutral scenes compared to blue-tinted scenes and proportional to the overall glazing transmittance of all the six glazing panes combined (cf. Fig. 9).
This also indicate the inability of Ev to capture the extreme luminance of the sun and its position index in participant's FOV, and thereby making Ev less reliable as a glare metric in our study. For this reason, instead of relying on solely saturation based metrics (Ev and sun luminance), we use contrast (CGI) and hybrid (DGP) glare metrics due to their higher predictive power and correlation with the subjective perception of glare as reported by several previous studies [7,56]. When we compare blue-tinted and color-neutral conditions based on the derived DGP and CGI metric values (cf. Fig. 11, Fig. 12), we can see that blue and color-neutral cases seem to differ more when using DGP to evaluate them, due to its strong linear dependence on Ev (cf. Eq. (5)), which is quite a bit higher for color-neutral cases, as shown in Fig. 9.
5.2. Comparison of glare perception under blue and neutral glazing
As described in section 4.4, we first analysed the answers from the open-ended questions and compared them with the responses to the binary glare questions, to determine whether the participants were bothered by glare even when it wasn't asked specifically in the question. We found that amongst the participants who reported “Yes” to the binary question in color-neutral conditions, 83% of them had actually written either glare or sun or bright light as a disturbing factor in their answers to the open-ended question. Similarly, under blue-tinted glazing, 82% of the participants had mentioned sun or glare or bright light as disturbing factors, which seems, in both cases, to confirm that glare was the primary experimental variable in both the studies.
Fig. 13, Fig. 14 show the percentage of participants experiencing discomfort from glare, represented as bar plots on a binary “Yes/No” scale and on a four-point ordinal scale, respectively. The distribution of votes from both scales follow a similar trend, therefore indicating a consistency in the participants' answers and a reliability of asked questions. Overall, participants experienced discomfort more often in blue-tinted glazing (52% voted ‘Yes’) compared to color-neutral glazing (42% voted ‘Yes’) even though the calculated glare metrics were higher in color-neutral glazing conditions: based on these predictions, the probability of experiencing glare would be expected to be higher in color-neutral cases, which was not proved to be true. From Fig. 13, Fig. 14, it can, on the contrary, be inferred that participants were tolerating glare better in color-neutral glazing compared to blue glazing despite the conditions being a priori more prone to glare (higher glare metric values).
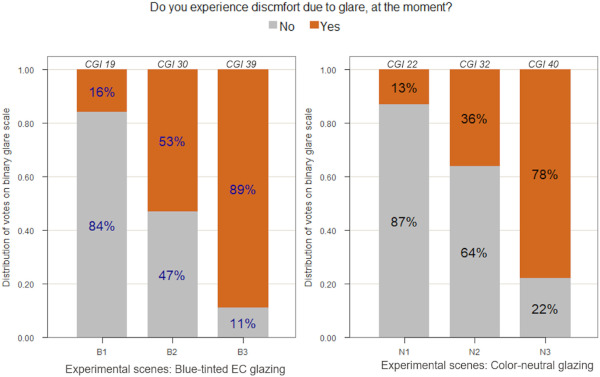
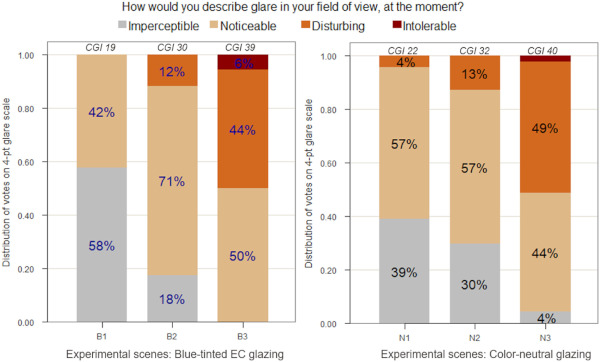
Comparing conditions B1 to N1 in Fig. 13, which are the two best performing conditions in terms of controlling glare within each study, the percentage of participants experiencing discomfort are 3% lower in N1 (color-neutral glazing) compared to B1 (blue glazing), 13% versus 16% respectively, even though the mean CGI and DGP values are higher for N1 compared to B1. Similarly, comparing B2 to N2, a higher percentage (17% higher) of participants report being comfortable under N2 (64%) compared to B2 (47%), whereas glare metrics are lower for B2. Likewise, condition N3 (22%) has a 11% lower ratio of participants experiencing glare compared to B3 (11%). Fig. 14 with the four-point response labels presents a similar distribution of votes and a higher percentage of participants reporting glare in blue-tinted glazing compared to color-neutral glazing.
In summary, we compared glare conditions shown to participants with all three types of metrics: contrast driven metrics (CGI, Fig. 12), hybrid metrics (DGP, Fig. 11) and solely saturation (adaptation) based metrics (Ev, Fig. 9). In all the cases, glare metrics always had higher values in case of color-neutral glazing indicating that both the contrast and saturation effects are higher under color-neutral scenarios. However, deriving from participants’ subjective responses (Fig. 13, Fig. 14), they were better able to tolerate these higher predicted glare values in color-neutral scenarios.
5.3. Comparison of discomfort glare thresholds between blue and neutral glazing
To further quantify the descriptive analysis shown in the previous section, that seems to indicate a higher glare tolerance for neutral glazing compared to blue glazing, we determined the glare metrics thresholds at which participants report discomfort under blue and color-neutral conditions. We applied ROC and PR-curve methods on the binary responses as described in section 4.7 to derive optimal thresholds.
First, we established the effectiveness of the chosen glare metrics (DGP and CGI) in predicting participants' perception of discomfort glare by applying a Spearman's rank correlation and an AUC analysis, as reported in Table 4. The Spearman's rank correlation between the glare metrics DGP and CGI and the glare responses on four-point ordinal labels were found to be between 0.67–0.63 for the blue-tinted glazing and 0.62 for the color-neutral glazing. As per Cohen's effect size thresholds [80], ρ > 0.5 are classified as a strong effect. AUCs from the ROC analysis inform on the metrics' ability to distinguish between comfort and discomfort glare scenarios. Table 4 reports the AUCs for DGP and CGI for blue-tinted and color-neutral glazing between 0.80 and 0.88. As per Hosmer-Lemeshow [81], AUC >0.8 are categorized as an excellent discriminator of the binary classification model. Therefore, both the performance evaluation show that the glare metrics based on contrast and hybrid effects are reliable in predicting glare.
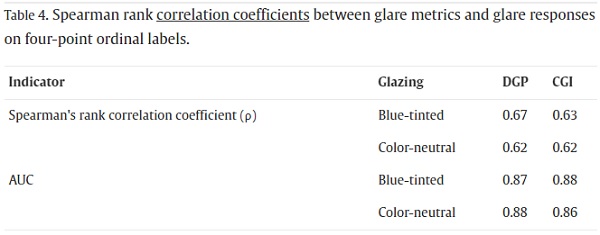
Table 5 reports the optimal glare thresholds between the comfort and discomfort glare based on binary “Yes/No” questions calculated using ROC and PR-curve methods. The distribution of binary answers for blue-tinted glazing is 47%-No and 53%-Yes responses whereas for the color-neutral glazing is 56%-No and 44%-Yes responses. As shown in Table 5, we calculated these thresholds first on the original dataset, then on two subsamples of the original dataset for further validation. This subsampling was performed for a more careful and strict evaluation of the data.
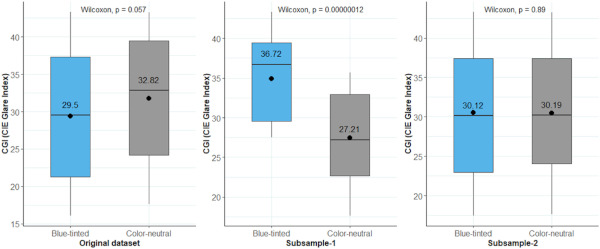
We made sure that the calculated glare thresholds were not affected by the range of conditions shown to the participants by correcting for the higher stimuli in the original color-neutral dataset that may drive higher glare thresholds. In the subsample-1, we recalculated glare thresholds over a subsample of the data with conditions B2, B3 and N1, N2. In these selected conditions, the stimuli were higher for blue-tinted glazing compared to color-neutral glazing. In the subsample-2, we extracted a random subsample (70 datapoints) of color-neutral dataset with 1000 iterations, which has a similar distribution to the blue-tinted dataset. Fig. 15 shows the boxplot comparison of these three samples with median values and mean location.
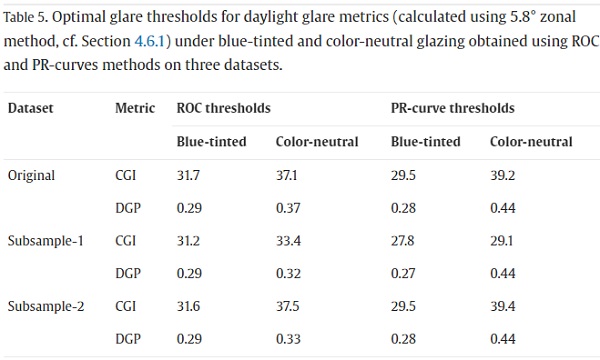
From Table 5, it is clear that glare thresholds are always higher for the color-neutral cases compared to blue-tinted cases using both ROC and PR-curve methods for the original dataset and for the two subsamples as well. These findings hold true for all the chosen glare metrics, indicating higher tolerance of glare in color-neutral and therefore confirming a strong influence of the glazing spectrum on glare perception.
5.4. Comparing modified glare metrics between blue and neutral glazing
In this section, we compare the modified glare metrics calculated as per the method described in section 4.6.2. Our hypothesis is that the modified glare metrics values should be higher for the blue-tinted glazing compared to the color-neutral glazing for the experimental conditions where the discomfort responses were also higher for the blue-tinted glazing. In other words, to be able to explain the effect of spectrum revealed in this study, the spectral discomfort glare sensitivity functions should result in higher glare metrics values for blue-tinted glazing between scenes B1 and N1, B2 and N2, and B3 and N3. We modified the CGI and DGP metrics as per eqs. (6), (7)) based on the four spectral discomfort glare sensitivity functions listed in Eqs. (1), (2), (3), (4)). For the sake of brevity, in this section we only present modified-CGI metric comparison between the scenes B2 and N2, as shown in Fig. 16. Remaining scenes which are not presented here follow a similar trend.
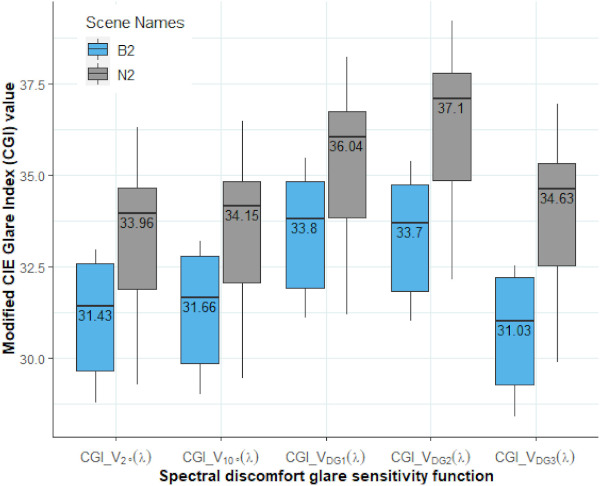
Comparing the standard CGI metric weighted by CIE V2°(λ) with the ones weighted by CIE V10°(λ), VDG1(λ), VDG2(λ) and VDG3(λ), the mean CGI difference between blue and neutral cases tends to decrease most in cases where the VDG1(λ) function is used, as it includes a substantial contribution from S-cone fundamentals (cf. Equation (1)). This is coherent with blue glazing transmitting more in the S-cone sensitive region and hence the increase in CGI value is higher for blue glazing compared to neutral glazing. For the VDG2(λ) and VDG3(λ), the difference between the blue and neutral datasets increases further due to the higher weighting of the L and M cones (cf. Eqs. (2), (3))). Nevertheless, all the implemented functions are unable to provide higher CGI values for B2 experimental condition compared to N2 condition where the participants experienced stronger glare sensation. Since these functions were developed based on the experiments done under monochromatic electric light sources, there application under broad spectrum daylight glare sources seems to be limited.
6. Discussion
The focus of this study was to determine the difference in glare perception when comparing a glare source (namely the sun disc) visible through blue-tinted versus color-neutral glazing. The focus is therefore not to validate the performance of glare metrics in predicting glare in such scenarios, nor to derive glare thresholds for practical applications. We should thus note that the glare metrics thresholds reported in this study are not be directly compared in absolute terms to the previous studies [7,56] or to the ones reported in building standards such as EN17037 [82], due to the zonal calculation method used in this study unlike other studies. The same applies for the implementing sun window transmittances in controlling glare for façade design applications: the threshold transmittances to control glare can vary when there is similar level of adaptation between blue and color-neutral glazing unlike in this study. However, in order to have a sense of glare conditions to which participants were exposed to and compare them between the two glazing types, it was necessary to first evaluate whether the glare metrics were applicable to such scenarios (i.e., can be expected to reliably predict glare).
One limitation of this study comes from the difference in stimuli between the blue-tinted and the color-neutral glazing conditions owing to the differences in their glazing transmittances. Due to this, the adaptation levels are higher in color-neutral glazing. Since DGP could overestimate the adaptation effect as discussed in previous studies [57,83,84], CGI is relied upon to compare the glare metrics between the two studies. We account for the stimuli differences by performing an additional analysis on a subsample of similar stimuli distribution (cf. section 5.3). Another limitation of this study is that due to the lack of measurement instruments to measure sun spectra and the limited availability of spectral measurements, we had to implement a calculation method that uses standard sun spectra, which could differ from actual onsite sun spectra due to the atmospheric conditions and this can create discrepancies to some extent in the calculated glare metric values using this method.
However, since we performed a relative comparison between the modified glare metrics, these discrepancies can be ignored. We also made sure to conduct the measurements only during stable weather conditions with clear sky. We also acknowledge that we have slightly higher position indices in color-neutral glazing compared to blue glazing (Fig. 7), that can therefore create lower glare levels. To overcome this, we conducted an additional evaluation on a subsample of color-neutral glazing which has similar distribution of position indices in comparison to blue glazing, we again found higher glare thresholds (neutral-CGI = 36.5, blue-CGI = 31) for color-neutral conditions. It should also be noted that the results found in this study are only valid for the lighting intensity and spectrum being tested.
These aspects will change depending on many factors including glazing properties, glazing configuration, possible use of electric light in combination of daylight, climate, and location. The measurements and surveys based on new field studies with EC glazing should thus be evaluated to further conform on the current findings. Additionally, future studies can implement and test the upcoming technology of neutral-tinted EC glass to create the color-neutral scenarios.
Due to the exposure to relatively higher sun luminance values under color-neutral glazing, we made sure that participants’ vision was not impaired under the glare from the sun. This was confirmed by implementing a Landlot C contrast test [85]. Participants did the contrast test under constant electric light setting without any daylight in the introduction phase as a baseline measure; afterwards, they repeated the same test (with randomized characters) under each daylit experimental condition. We compared the results of the baseline test with the test conducted under daylight and did not find any significant differences in their contrast sensitivity measures. Therefore, these conditions conform to the discomfort glare definition given by CIE where vision is not impaired.
While we found a strong influence of color on discomfort glare perception from daylight, none of the implemented spectral discomfort glare sensitivity functions could explain this influence. Based on literature, we have formed some hypotheses to explain this influence which should be further investigated. The first hypothesis relates to the Helmholtz-Kohlrausch effect (H–K effect) which indicates that more saturated chromatic stimuli appear brighter than the less saturated chromatic or achromatic stimuli of same luminance [86]. Although this effect is only shown in the context of brightness perception, study by Yang et al. [17] have shown that glare perception is strongly correlated with brightness perception. In the present study, the saturation component of the sun seen through the blue-EC glazing was 65%, whereas, for the color-neutral glazing, it was 0%.
Therefore, as per the H–K effect, it can result into the sun appearing brighter under more saturated blue glazing compared to less saturated color-neutral glazing. It can thus be hypothesized that, similarly to brightness, glare perception is mediated by both achromatic (or luminance) and chromatic channel, unlike luminance. To examine this hypothesis, color brightness models can be applied to predict glare perception from self-luminous colored stimuli. Another hypotheses is based on the literature on non-visual effects of light which have shown the role of melanopsin in regulating the pupillary light reflex and greater steady-state pupillary constriction under blue-light exposure [87,88]. This could be a potential reason why occupants perceived blue daylit scenes more discomforting than color-neutral daylit scenes in our study. Furthermore, a recent study have suggested that the melanopsin signals play a crucial role in the estimation of perceived brightness [89]; therefore, in addition to cones, melanopsin should be considered as possibly contributing to glare prediction, which would have a higher impact in the presence of light in the short-wavelength ranges.
7. Conclusion
In this study, we compared perceived discomfort glare under blue-tinted versus color-neutral glazing of different (low) transmittances, with the aim to determine the effect of spectrum. By performing a between-subject evaluation, we found that the study participants were better able to tolerate glare under color-neutral glazing, whereas they perceived it more strongly under blue glazing. Participants experienced similar or lower levels of discomfort glare under color-neutral glazing which had higher values of predicted glare metrics than the blue-tinted glazing.
Our findings show that the spectrum of a glare source strongly influences people's glare perception under daylit conditions. This relationship is of complex nature, and remains unexplained by the previously reported spectral sensitivity functions for glare. Currently, the effect of spectrum is not accounted for in any of the glare metrics and there are also no studies evaluating the effect on glare perception at different wavelengths under broad spectrum conditions. There is therefore a need to redefine the luminance and illuminance terms in glare models so as to incorporate the effect of spectrum. Colored glazings of significantly different spectra are expected to create different levels of glare perception, which needs to be further evaluated by future research to better understand the relation between spectrum of glare source and glare perception. Future works should be focused on quantifying this effect of spectrum and incorporating it in modified glare models. For the field and laboratory glare studies conducted under colored daylighting or electric lighting conditions, more emphasis should be given on spectral measurements rather than just the luminance and illuminance measurements.
While this study was focused on the short wavelength shifted broad spectrum, more studies should be conducted to determine the glare perception along the entire visible spectrum, which will provide better insights and enhance our understanding of the spectral sensitivity of human eye under brightly-lit glary conditions with chromatic glare sources.
CRediT authorship contribution statement
Sneha Jain: Writing – review & editing, Writing – original draft, Visualization, Validation, Methodology, Investigation, Formal analysis, Data curation, Conceptualization. Jan Wienold: Writing – review & editing, Supervision, Resources, Project administration, Methodology, Funding acquisition, Conceptualization. Maxime Lagier: Writing – review & editing, Resources. Andreas Schueler: Writing – review & editing, Resources. Andersen Marilyne: Writing – review & editing, Supervision, Resources, Project administration, Conceptualization.
Declaration of competing interest
The authors declare that they have no known competing financial interests or personal relationships that could have appeared to influence the work reported in this paper.
Acknowledgement
This study is funded by the Swiss National Science Foundation (SNSF) grant for the project “Visual comfort without borders: interactions on discomfort glare” (grant number 200020_182151). We would like to thank Caroline Karmann and Margareta Bali for their support in planning and conducting the experiments. We would also like to thank Giorgia Chinazzo for her help in initial planning of the experiment methodology.
Data availability
Data will be made available on request.


