Authors: Rebecca Hartwell, Graham Coult & Mauro Overend
Source: Glass Structures & Engineering (2022)
DOI: https://doi.org/10.1007/s40940-022-00195-9
Abstract
Glass is one of the UK’s eight energy-intensive industries. As such, it is under scrutiny to decouple growth in production from greenhouse gas (GHG) emissions. Recycled glass, also known as cullet, requires less energy to melt than primary raw materials in new glass production. The use of cullet thus reduces the energy intensity per unit of output whilst also reducing demand for primary material resources. However, efficient systems for flat glass collection are yet to be established in the UK, resulting in a limited supply of cullet available for the flat glass market and missed environmental opportunities. This study identifies the existing supply-chain inefficiencies in the UK glass industry in three stages.
Firstly, the mass flows of materials within the three main glass sectors: container glass, flat glass and glass wool, are mapped from natural resource through to primary application and subsequent end-of-life management based on a reference year of annual production figures. The map is presented in the form of a “Sankey” diagram which draws attention to several opportunities for increasing resource efficiency; namely in the stark contrast in glass collection rates between the flat and container glass industry. Using the data collected on the annual mass flows of materials in the UK flat glass sub-sector, the energy (MJ) and GHG emission (CO2-eq) saving potential of enhanced end-of-life collection methods are assessed, based on three alternative recovery scenarios. These scenarios consider the use of alternative distributions of recovered flat glass cullet in the three primary glass sub-sectors.
The emission savings resulting from each recovery scenario are evaluated, based on the estimated tonnage yield of finished flat glass products. It is shown that together with improved manufacturing yield, the reutilization of end-of-life flat glass as cullet in new production could reduce the annual emissions of the UK flat glass value-chain by up to 18.6%. Finally we review the existing barriers to recycling different glass types based on acceptability criteria and available take-back infrastructure, and thus find that the advancement of improved recycling rates will rely on establishing the business opportunity and/or supporting policy for developing efficient systems for flat glass collection.
1 Introduction
1.1 Glass sector
The glass industry in the United Kingdom and Northern Ireland (UK) accounted for 0.5% of total UK energy consumption and 0.4–0.6% of total UK greenhouse gas (GHG) emissions in 2019 (Griffin et al. 2021; Ireson et al. 2019; WSP Parson Brinkerhoff and GL 2015). It is thus classified as one of the energy-intensive subsectors within the UK industry sector alongside iron and steel (3.6% of total annual GHGs), chemicals (2.7%), cement (1.1%) and aluminium (0.6%) (Centre for Low Carbon Futures 2011; Griffin et al. 2016). Glass production can consist of several high-temperature processes. The glass industry has successfully reduced the energy intensity of production in the last 30 years via fuel-switching, advances in furnace technologies, on-site energy efficiency improvements and waste heat recovery processes (British Glass 2021; Griffin et al. 2016; Hammond and Norman 2012; IMPEL 2012; Maria et al. 2013).
Additional supply-side efficiency improvements through the use of alternative low-carbon energy sources—such as all-electric melting, hydrogen and biofuels—have been identified as a route for further emission reductions from the energy-intensive industry subsectors. It has been recognized however, that meeting climate targets through supply-side energy efficiency improvements alone will necessitate considerable finance due to the substantial increases in the size of the energy system required: in the UK alone, the electricity system would need to quadruple its output (Barrett et al. 2021). It has thus been proposed that there is an urgent need to investigate pathways to reduce gross demand for energy through material efficiency strategies, such as reuse and recycling, to enable a cost effective, timely and de-risked “net-zero” target (Allwood et al. 2013; Barrett et al. 2021; HM Government 2021).
Container glass for bottles and jars (~ 60%) constitutes the largest glass sub-sector by mass output, followed by flat glass for the architectural and automotive sectors (~ 30%) (BEIS and British Glass 2017). Glass wool (insulation products) and other applications including domestic glass (decorative glass and household appliances), continuous glass filaments (fibre-reinforced composites and fibre-optics), and pharmaceutical products constitute the remainder mass output (~ 10%) (BEIS and British Glass 2017).
Growth in demand in these sectors has been stimulated by the drive to: retrofit existing inefficient glazing units; find fully-recyclable alternatives to non-recyclable packaging materials; meet new energy-performance standards through durable and non-flammable glass insulation products; and develop glass-fibre reinforced polymers for composite materials for high strength-to-weight ratio applications such as automotive products and rotor blades for wind turbines (British Glass 2021). Each of these products deliver significant performance improvements within the use phase of their application. Yet the full environmental benefits of these performance improvements can only be achieved by concerted efforts to reduce the whole-life environmental impact of the glass sector. This will ensure that future growth in UK glass production aligns with the national “net-zero” strategy (HM Government 2021) and remains competitive internationally.
1.2 Environmental cost of glass manufacturing
The principal environmental aspects of interest in glass production are resource consumption, the energy efficiency of production, emissions to air, and water usage.
1.2.1 Raw materials
The main constituents of glass are: silica sand (SiO2), soda ash (Na2CO3), limestone (CaCO3), soda feldspar (Na2O–Al2O3–6SiO2) and dolomite (CaMg(CO3)2). The proportions of raw materials used and additional additives vary to a small extent for flat- and container-glass products (Gaines et al. 1994; Zier et al. 2021). Fibres for glass wool products use a similar composition of raw materials with a lower proportion of silica sand which is compensated by a greater proportion of limestone, soda ash and, in increasingly smaller proportions, boric oxide (Gaines et al. 1994; Zier et al. 2021). The sourcing and processing of these raw materials requires energy. Soda ash is the most energy-intensive raw material to produce.
It is commonly produced via the Solvay (synthetic), Hou (synthetic) or Trona (natural) process. It is estimated that 99% of soda ash produced in the UK and European Union (EU) is produced via the Solvay process (Belis and Tuokko 2016; Brunner Mond 2008). This process requires 6.1–10.0 MJ/kgsoda ash produced which is equivalent to 0.7–1.0 kg CO2-eq/kgsoda ash produced (Belis and Tuokko 2016; Brunner Mond 2008). In total, the sourcing of all primary raw materials for glass production requires 3.8–4.8 MJ/kgmolten glass generating 0.33–0.35 kg CO2-eq/kgmolten glass (Guardian Europe 2021; Guardian Europe 2012; Usbeck et al. 2014; Vitro 2022). The energy inputs and corresponding emissions associated with raw material sourcing, processing and glass production are illustrated in Fig. 1.
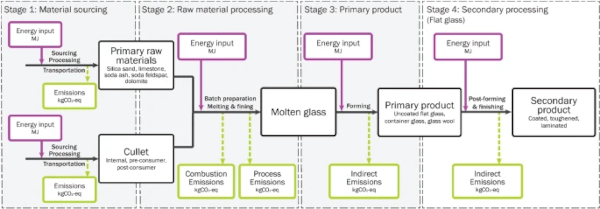
1.2.2 Glass production
All forms of energy input highlighted in Fig. 1 generate associated GHG emissions which correspond to the type of energy supply and raw materials used. Energy is provided directly to the glass production site by the combustion of fossil fuels, by electricity, or by a combination of both sources. The first step in glass production for all glass products involves batch preparation where all the raw materials are carefully mixed to the desired composition. Recycled glass, also known as cullet, is also added to the melt. Subsequently the input materials are heated to high temperature (~ 1500 °C) in the glass furnace to produce molten glass. During this step, GHG emissions arise from the combustion of fuel—typically natural gas—to power the glass furnace. In addition, carbon dioxide (CO2) is emitted as a by-product of the melting process.
These CO2 emissions are often referred to as process emissions and arise due to the decomposition of carbonate raw materials. The glass melt is then cleared of bubbles—originally caused by chemical reactions that occur in the process of melting raw materials—and homogenised in a process known as ‘fining’ (Müller-Simon 2011). Molten glass is kept at high temperature and subsequently poured onto a molten bed of tin in the float glass tank (flat glass); directed into a mould and blown (container glass); or blown, spun and merged with binder (glass wool and continuous filament fibre glass).
In the forming process of flat glass, rapid temperature changes can occur which induce severe internal stresses within the glass. To prevent these stresses, the glass is passed through an annealing lehr, which involves slowly cooling the glass from 600 to 60 °C. This again requires energy input, in the form of electric direct heating. Subsequently, flat glass may undergo a series of secondary processing methods—stage 4 on Fig. 1—powered by electricity. These processes can include: toughening treatments, the application of coatings and/or lamination with interlayer products.
1.3 Use of cullet in new production
Glass offcuts arise throughout the manufacturing process due to edge trimming and automated quality inspections that detect unacceptable optical flaws and/or out-of-specification performance. As a consequence, up to 15% of manufactured flat glass is collected and used as internal cullet in new glass production. The benefits of cullet usage are three-fold. Firstly, there is a saving in the energy and emissions associated with the sourcing and processing of the equivalent quantity of raw materials multiplied by a factor of approximately 1.2. The 20% difference in total mass input required is due to the decomposition losses incurred during the melting process of carbonate primary raw materials during stage 2 (see Fig. 1).
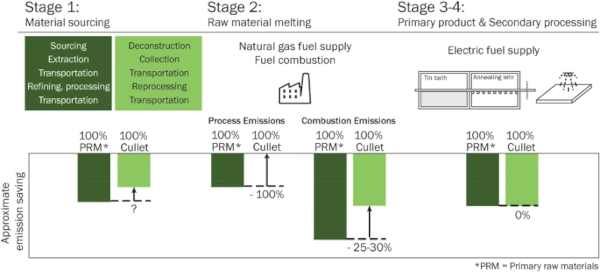
Secondly, it requires less energy to melt cullet, which consequentially reduces the energy consumption of the primary processing stage by 2.5–3.0% for every 10% increase in cullet (Beerkens et al. 2011). This, in turn, reduces the associated combustion emissions that are highlighted on Fig. 1. Finally, process emissions are reduced, due to the substitution of carbonate raw materials, with cullet that has already undergone thermal decomposition. Figure 2 shows the relative savings in CO2 emissions arising from the use of cullet at each stage of glass production. This study will consider the extent to which the primary saving associated with reduced primary raw material usage (stage 1 on Fig. 2) will be offset by the environmental transportation and reprocessing costs of “furnace-ready” cullet.
There are in fact three types of cullet used in glass production. Internal cullet is generated at the glass production facility due to off-cuts created when trimming the glass ribbon edges, product changeovers, and below-specification glass. Pre-consumer cullet is generated through the downstream manufacturing of products that contain glass; becoming waste before ever reaching the consumer market. An example of pre-consumer cullet is the off-cuts from jumbo sheet glass provided to glass processors, which can then be returned to the glass manufacturer before re-melting. Post-consumer cullet is waste glass arising when a glass product has reached its end-of-life after a period of time in use. It is worth noting that the generation of manufacturing waste at the glass production sites (internal cullet) and/or downstream manufacturers (pre-consumer cullet) will proportionally reduce the total output of manufactured flat glass to final product.
Schmitz et al. conducted an in-depth analysis of the direct and indirect energy consumption and CO2 emissions (illustrated as stages 2–3 on Fig. 1) of the European glass industry based on European Union (EU) emissions trading scheme (ETS) data for 2005–2007 (Schmitz et al. 2011). On average, the container glass (CG) and glass wool (GW) subsectors were found to produce a much lower figure for process emission intensity per tonne (CG = 0.10 ± 15% and GW = 0.07 ± 16%) than the flat glass subsector (FG = 0.19 ± 17%) across the then EU25 countries (Schmitz et al. 2011). It was thus estimated that GW, CG and FG subsectors were typically operating at 55%, 45% and 5% cullet (internal/pre-/post-consumer) usage, respectively, within the EU25 in 2005–2007.
At present, there is no common international standard or specification for post-consumer cullet. The JRC European Comission (2011) developed a guidance document for the end-of-waste criteria for reprocessed cullet based on a comprehensive review of existing literature and contributions from technical experts across the European glass industry. This includes a summary of the minimum quality criteria for “furnace-ready” cullet in terms of maximum permissible levels of typical contamination from metals, organic and inorganic material for the container glass, flat glass and glass wool sub-sectors. Quality requirements for cullet were found to be much more stringent for use in flat glass production than for container glass and glass wool.
For example, impurities from non-ferrous metals in container glass and glass wool production are acceptable if their particle size is less than 0.1 g and the total amount falls below 20 g/tonne (20 ppm). For flat glass, the total proportion of non-ferrous impurities must be lower than 0.5 g/tonne (0.5 ppm). Contamination limits for secondary applications that do not require remelting such as ceramic sanitaryware and fluxing agents for brick manufacture are even less stringent. The distribution of recovered cullet to such “open-loop” secondary applications has been found to yield significantly lower environmental benefits (Enviros Consulting Ltd 2003).
1.4 Efforts to decarbonize the UK glass industry
WSP Parson Brinkerhoff and GL (2015), Griffin et al. (2021), and British Glass (2021)—the main representative body for the UK glass industry—have published industry roadmaps for the glass sector to achieve carbon neutrality by 2050 in response to the UK’s commitment to Net Zero (HM Government 2021). The key strategies to reduce the emissions associated with glass production by 2050 proposed within these studies include: alternative raw material input to reduce process emissions through increased use of cullet; the use of pre-calcined raw materials and/or alternative raw materials; the use of alternative fuel sources to reduce combustion emissions such as oxyfuel combustion, liquid biofuels, all-electric melting, hybrid furnaces and/or hydrogen; and remediation options such as carbon capture utilization and/or storage (CCU/CCS)—see appendix A1 (British Glass 2021). Zier et al. presented a comprehensive review of the decarbonization options in the German glass sector in terms of CO2 reduction potential and economic viability (Zier et al. 2021). They investigated the various existing and future energy sourcing options for powering the glass furnace and concluded that electrical melting and/or hydrogen combustion were the most promising options to drastically reduce combustion emissions.
Whilst combustion emissions may be drastically reduced through fuel-switching, process emissions remain intrinsically related to the raw material composition of glass products. Unless sourced as by-products from other industries, the use of calcined raw materials would merely shift the emission of CO2 emissions to another stage in the glass manufacturing value-chain. Arguably, the process could become more inefficient as a consequence of heating the materials twice. Emission remediation options, such as CCU/CCS technologies, are in the early stages of development and have yet to be proven for use on glass furnaces (Anderson and Peters 2016; Butnar et al. 2020; Griffin et al. 2021; The Royal Society 2021). Relying on CCU/CCS or the use of calcined raw materials to reduce process emissions is thus likely to fall short in achieving the desired outcome of reducing global GHG emissions in the medium-term.
Increasing the percentage of cullet used would have direct and clear benefits for reducing process emissions. Simultaneously, it holds the potential to lower the furnace operating temperatures and thus reduce the demand for energy input from alternative fuel supplies. When reporting emission reduction strategies, the glass industry typically refer to the emissions associated with the primary and secondary processing of glass, represented as stages 2–4 on Fig. 1. These emissions are often referred to as scope 1 emissions (GHG Protocol Initiative 2012). Alternative fuel sources and combustion methods such as oxyfuel combustion, hydrogen combustion and all-electric melting all have their own energy costs associated with fuel supply.
The corresponding emissions associated with purchased electricity and fuel sourcing (scope 2–3) are often referred to as Well-to-Tank (WTT) emissions (GHG Protocol Initiative 2012). In the wider context of reducing global emissions, it is important to consider the environmental cost of all processes across the glass value-chain. In addition to WTT emissions, it is also essential to consider the environmental trade-offs at the raw material sourcing and processing stage (stage 1 on Fig. 1) for primary raw materials compared with cullet. This will enable a transparent and comprehensive evaluation of the use of alternative raw materials and fuel sources as a route to decarbonise the glass sector.
1.5 End-of-life applications for glass products
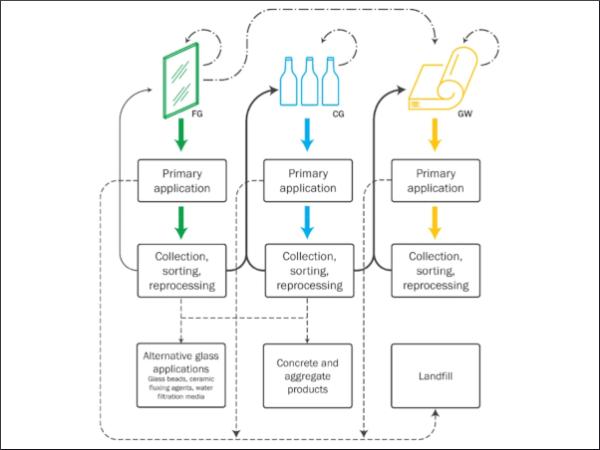
Glass as a primary product, prior to any secondary processing methods, can be recycled without loss in quality. The existing end-of-life recovery routes for the three primary UK glass markets are shown on Fig. 3.
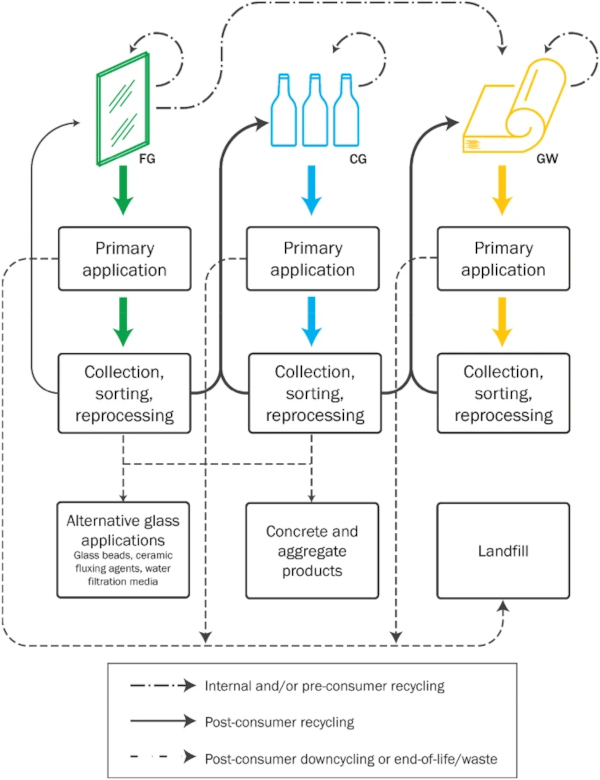
Flat glass (FG) manufacturers typically use 10–25% of cullet in new glass production. The vast majority of this cullet is internal or pre-consumer cullet: it is estimated that new flat glass production in the UK contains no more than 1% of post-consumer flat glass. Products incorporating flat glass often incorporate coatings, frits and interfaces with other materials such as adhesive polymers and metal parts (DeBrincat and Babic 2018). The principal barrier for increasing the rates of post-consumer recycling is the effective recovery of flat glass cullet that is free from contaminants, with an acceptable quality, at a reasonable cost. The acceptability thresholds for the use of cullet in new flat glass production are very high in order to minimise production losses, guarantee compliance with relevant product standards and minimise optical defects in particular (JRC European Comission 2011).
The container glass (CG) industry has made significant efforts to recover its products beyond their first use to use the collected cullet in new production and consequently reduce waste to landfill. This has been achieved through a well-established system of collection through bottle banks or household collection of co-mingled recyclable waste. Collected CG is then separated at a material recovery facility and then sent to a reprocessor where the cullet is sorted and reprocessed to a quality that complies with a customer specification. Quality checks will be performed to ensure that the cullet meets the desired specification which may include checks on: maximum permissible limits on ferrous metals, non-ferrous metals, inorganics and organics; cullet size; moisture content; and optical quality.
The UK achieved a 76.5% rate of container glass collected for recycling in 2019, which falls in line with the European average (British Glass 2020; FEVE 2018). Thus, on average, new CG products typically contain ~ 50–52% post-consumer cullet from UK sources (Close the Glass Loop 2020; Lee et al. 2019). The percentage of recycled content varies between glass products due to a significant imbalance in the proportions of clear, green and amber glass produced relative to those consumed in the UK (McCoach et al. 2019; Valpak 2012).
Norman (2013) detailed the drivers and barriers to improving energy efficiency in the energy-intensive sub-sectors within UK industry and highlighted the need to increase information on energy use and motivations to reduce it across the value-chain. Hartwell et al. (2021) completed a cross-industry review on the barriers and motivations to realising the circular economy in the design of façade systems, including architectural glass. It was found that an improved understanding of the environmental value of reuse and recycling would be a key lever to influencing design decisions that better consider whole-life environmental performance and/or justifying financial investments in effective take-back supply-chains.
Several studies have highlighted the challenges of incorporating post-consumer cullet in new FG production and called for better collection and sorting practices (DeBrincat and Babic 2018; Edgar et al. 2008; Leong and Hurley 2004; WSP Parson Brinkerhoff and GL 2015). The opportunities with reference to: the whole glass sector value-chain; influence of secondary processing methods; available cullet in the UK; alternative pathways for recovery; and resulting energy and emission savings within the glass sector, have not yet been evaluated. To this end, this study seeks to evaluate the environmental impact of the use of post-consumer flat glass cullet in new glass production, based on existing resource flows and alternative scenarios for end-of-life management.
1.6 Resource flows for flat glass
It is well-known that there is an increasing demand for cullet from the FG, CG and GW sectors. The availability of ‘furnace-ready’ cullet is an essential prerequisite for increasing the use of cullet in new glass production. Existing knowledge on the gross availability of flat glass cullet in the UK and its suitability for secondary applications is limited. Another key factor that remains unclear is the real energy costs and/or savings relating to glass offcuts produced as internal- and/or downstream-manufacturing waste which are later used as cullet in new production. Cullen and Allwood have produced informative maps of global steel and aluminium production, based on mass tonnage figures, from raw materials to end-of-life, thus identifying preventable yield losses and providing suggestions for relevant material efficiency strategies (Cullen et al. 2012; Cullen and Allwood 2013). Coenraad et al. produced a similar map for the flat- and container-glass markets by mass which provides a useful overview of global production figures (Westbroek et al. 2021).
The use of recovered glass across sub-sectors, however, was not considered. Further, the segmentation of the flat glass sector by product type; relevant energy inputs; and corresponding emissions was excluded. Souviron and Khan (2021) assessed the environmental footprint of the architectural flat glass sector in Belgium, France and the EU. They provide a useful overview of the: tonnage flows of raw materials; energy-mix; energy-; and CO2-intensity with relation to scope-1 emissions in the FG sector alone over the last 75 years in these regions.
1.7 Aim of this study
This study examines the existing and potential future end-oflife recovery routes for flat glass in the UK and the associated CO2 emission reduction potential of increased cullet usage by:
- mapping the mass flows of materials from natural resources through to primary application and subsequent end-of-life management and secondary use;
- conducting an energy balance of flat glass recovery based on original energy inputs from raw material sourcing through to final product to evaluate the environmental impact of existing and potential future end-of-life recovery routes;
- evaluating the impact of two alternative manufacturing yield scenarios to provide a more comprehensive understanding of the real energy costs and/or savings associated with the use of glass offcuts produced as internal- and/or downstream-manufacturing waste and later used as cullet in new production;
- estimating the CO2 emission savings across the glass sector from improved collection methods for flat glass based on an estimate for the future availability of flat glass cullet;
- discussing the existing technological, supply-chain, economic, and governmental barriers to increased flat glass recycling in the UK.
2 Methodology
2.1 Assembling mass figures
Glass production figures and distributions by product type in the UK were collated from a literature review and subsequently inspected alongside annual production output data from (ONS 2021) covered by the Eurostat ProdCom survey which collects from a sample of approximately 21,500 businesses, covering 240 subsectors of the mining, quarrying, and manufacturing industry sectors. Some product outputs in the ProdCom database are measured in categorical units rather than mass-based which renders them useful only as a guide alongside the other supporting references. The references for the glass production figures sourced for this study are summarised in Table 1. The annual tonnages are denoted relative to end-use i.e. tonnage of new glass production is referred to as “inflow” and tonnage of end-of-life glass generated per annum is denoted as “outflow”. Production figures were collated from an extensive literature review and direct communications with the glass value-chain.
Table 1 Data sources for UK glass production and UK glass collection figures - Full size table

The data collated in Table 1, was plotted in a Sankey diagram (Fig. 5) in Python using freely-available Plotly code (Plotly Technologies Ltd. 2015). The nodes shown on the Sankey diagram represent a product or processing stage. The widths of the directed arrows between the nodes are proportional to the mass flows between each product and/or processing stage. The outgoing flows (left-to-right) indicate the demand on primary raw materials; successive distribution of end-use products within their relevant sub-sectors; and subsequent recovery/disposal route beyond first application. The return flows (right-to-left) represent the quantity of material that is recovered and utilized in new production for a secondary application.
2.2 Energy balance of flat glass production to secondary applications
2.2.1 Primary application
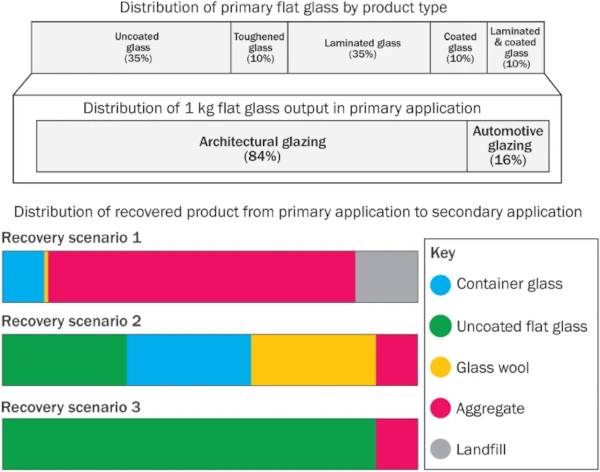
An energy flow diagram was constructed to draw attention to the energy inputs and outputs associated with the production of 1 kg of flat glass output in a primary application (architectural glazing or automotive). The energy associated with 1 kg of flat glass output is calculated based on a distribution of primary FG products. The distribution of primary FG products was estimated based on typical manufacturing outputs in the EU (Kellenberger et al. 2007; Maria et al. 2013) and is illustrated on Fig. 4.
2.2.2 Secondary application recovery scenarios
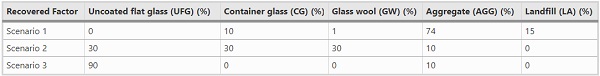
The three alternative recovery scenarios illustrated in Fig. 4 were constructed to compare and evaluate the effects of redirecting end-of-life flat glass to new products in varying proportions including: uncoated flat glass (UFG); container glass (CG); glass wool (GW); lower-grade aggregate products (AGG); and/or landfill (LA). The proportional distributions of recovered product to secondary application are illustrated in Fig. 4 and detailed in Table 2. Scenario 1 is representative of the existing end-of-life flows of flat glass. Scenarios 2 and 3 were constructed to represent the instance where improvements to existing collection infrastructures allow higher proportions of end-of-life flat glass to be reprocessed and utilized in new glass products. The energy use and savings associated with the use of end-of-life flat glass (i.e. post-consumer flat glass cullet) into the three alternative recovery scenarios was then evaluated.
Table 2 Product destination for 1 kg of flat glass output collected at end-of-life in the three constructed recovery scenarios - Full size table
2.2.3 Energy inputs
The energy inputs and corresponding emissions associated with stages 1 and 4—illustrated on Fig. 1—were collated from existing environmental product declarations and the EcoInvent database (Wernet et al. 2016). Data for the production stages 2–3 was collected from (Schmitz et al. 2011) who conducted an in-depth analysis of the energy consumption and CO2 emissions of 450 European glass installations based on EU ETS data for the period 2005–2007. UK-government fuel source specific conversion factors (BEIS 2020) were applied to account for the energy associated with fuel supply (i.e. to convert the total delivered energy into primary energy—see Appendix A2). Existing literature provides data for the embodied energy and embodied carbon of glass products with a range of recycled contents (RC). Where data for 0% RC was not available, the embodied energy and embodied carbon figures in Table 3 have been scaled based on the equivalent energy and emission savings (Beerkens et al. 2011) that arise in stage 1 and 2 from using cullet in new production for UFG, CG and GW.
Table 3 Distribution of energy input and equivalent embodied carbon for the major processing steps of flat glass, container glass, glass wool and aggregate products - Full size table
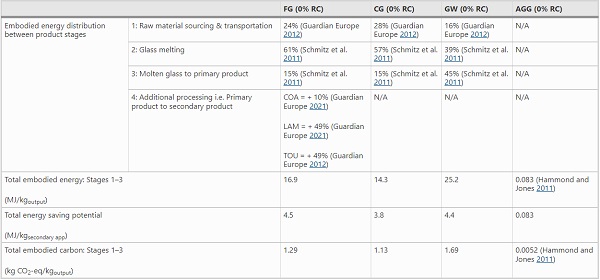
The raw material composition for FG and CG is similar. For GW, the composition is slightly different (Kellenberger et al. 2007; Zier et al. 2021). For the purpose of this study, the energy associated with primary raw material sourcing and transportation for each glass product has been taken to be equivalent at 4.05 MJ/kgmolten glass and 0.32 kgCO2-eq/kgmolten glass. These figures are taken from a flat glass environmental product declaration which declared 0% RC (Guardian Europe 2012).
An interim reprocessing step is required to produce cullet of a quality acceptable for new UFG, CG and GW products. This necessitates an additional energy input and equivalent non-recoverable energy loss. Embodied energy and carbon figures for the sourcing of cullet were taken from Beerkens et al. and the EcoInvent database (Beerkens et al. 2011; Wernet et al. 2016). The embodied energy figure aligns well with the energy associated with the equivalent output of cullet treated at a material recovery facility, where similar processing activities take place (Denison 1996). An estimation for the transportation of cullet from point of use back to reprocessor or aggregates market was taken as 800 km and 100 km respectively, based on the locations of existing manufacturing and reprocessing sites in the UK. Equivalent embodied energy and embodied carbon figures for transportation were calculated based on UK greenhouse gas reporting figures (GOV.UK 2021). The direct use of glass in aggregate production does not typically require a reprocessing step. The relevant calculations for the energy inputs associated with each stage of production are detailed in Appendix A2.
Table 3 highlights the difference in energy intensity between uncoated flat glass products and glass wool products. The production of the final glass wool product is more energy-intensive due to the additional fiberizing and curing process required for glass wool products (IMPEL 2012; Maria et al. 2013). Secondary processes can significantly increase the embodied energy of uncoated flat glass. Coating, lamination and toughening processes have been found to add an additional energy input equivalent to 10%, 49% and 49% of the embodied energy of uncoated flat glass, respectively (Guardian Europe 2021; Guardian Europe 2012).
2.2.4 Recoverable energy
Energy and emission savings from the use of cullet in new flat glass production arise from the raw material sourcing and glass melting stages. Based on the figures introduced in Table 3 and further detailed in Appendix A3, the replacement of 100% primary raw materials with 100% post-consumer cullet would yield a total energy saving of 27% and total emissions saving of 41% from raw material sourcing through to production into final uncoated flat glass product. These values are taken as the maximum energy available for recovery, MRE, and maximum emission saving potential, MESP. All other energy inputs, including those required to deliver additional processing methods for flat glass production such as coating, laminating, toughening and fabrication into a glazing and/or automotive unit, are evaluated as energy losses that are non-recoverable through recycling.
After primary use within architectural glazing or automotive products, glass can be transferred to landfill or one of four secondary applications: new uncoated flat glass (FG), container glass (CG), glass wool (GW) or aggregate (AGG). In the case of landfill disposal, 0% of the MRE is recovered. For the secondary applications, energy can be recovered to various degrees, depending on the equivalent recovered energy, RE, achieved from the use of cullet within that secondary application.
2.2.5 Production yields
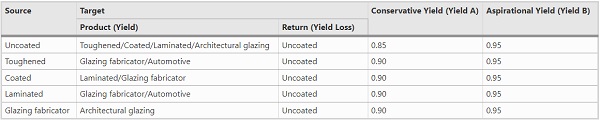
The production yield represents the percentage of non-defective glass that is passed through to the next stage of glass production. The five scenarios constructed in this study will evaluate two potential yield rates which are presented in Table 4. Scenarios 1A, 2A and 3A consider a yield that is representative of current practice for flat glass manufacturing based on estimates from communications with glass manufacturers. Scenarios 1B, 2B and 3B take a more aspirational estimate for yield rates.
Table 4 Destination of yields and yield losses for each processing step of flat glass production - Full size table
2.2.6 Energy flows from primary to secondary application
The corresponding energy flows, based on the mass distribution of glass product from raw material through to primary and subsequent secondary application, were plotted on Sankey diagrams (Fig. 6 and 7) to provide a visualisation of the energy losses associated with production, and equivalent savings that arise from recycling cullet after its primary application. From this, it is possible to evaluate the: primary energy losses from uncoated flat glass production and subsequent processing methods; secondary energy losses from producing secondary application products; total energy recovered (TRE); and total unrecovered energy (TNRE). A summary of the calculations used to evaluate these factors can be found in Appendix A3.
2.3 Energy and emissions savings potential
The flat glass market has grown steadily in the last 20 years. An outflow of 600 kt and 200 kt of flat glass in 2021 (the reference year for analysis) have been taken as a high- and low-end estimate based on annual rates of production in the year 1996 and a 25-year lifetime of a glazing unit and steady growth in the automotive glass market (Hestin et al. 2016; Kellenberger et al. 2007; Maria et al. 2013). These two figures have been used to provide an indicator for the equivalent energy and emission reduction potential that could be achieved by incorporating post-consumer flat glass in the production of new glass products.
3 Results
3.1 Map of UK glass production flows and related CO2 emissions
The production of glass consumes significant quantities of natural resources. The mass flows of glass production from natural resource through to primary application and recovery into secondary application are shown in Fig. 5.
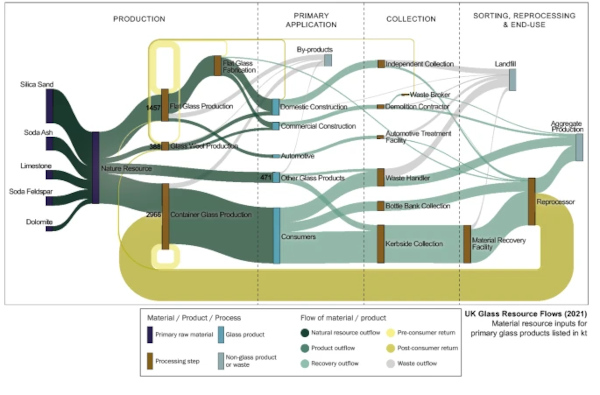
The mass flows plotted on Fig. 5 are based on the incoming and outgoing resource flows associated with the total output of finished product within each glass market (flat glass, container glass, glass wool and other glass products) in 2019. The total tonnage output of finished product in each market is detailed in Table 5.
Table 5 Total tonnage and CO2 emissions associated with each glass sub-sector from raw material to primary application - Full size table
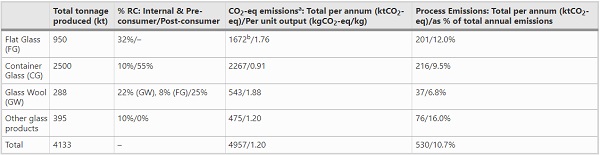
ᵇIncludes emissions associated with additional secondary processes for flat glass products
Due to the nature of the raw material composition, each glass product produces CO2 emissions via the thermal decomposition of carbonate raw materials. The percentage of waste by-product in the form of CO2 emissions, also referred to as process emissions in Table 5, is inversely proportional to the percentage use of cullet in the batch raw materials.
3.2 Energy balance of flat glass production
Figures 6 and 7 were plotted to provide a visualisation of the energy balance of recovery scenarios 1 and 2 based on the same conservative production yield (A) detailed in Table 4.
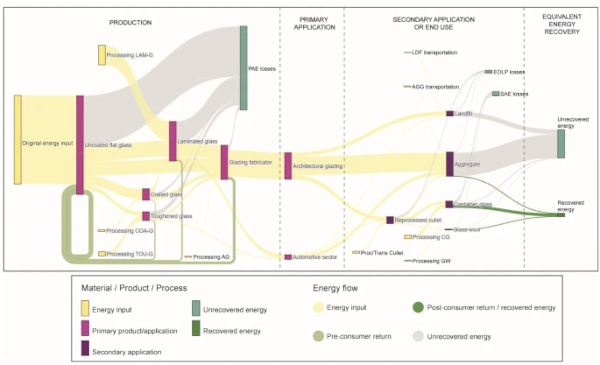
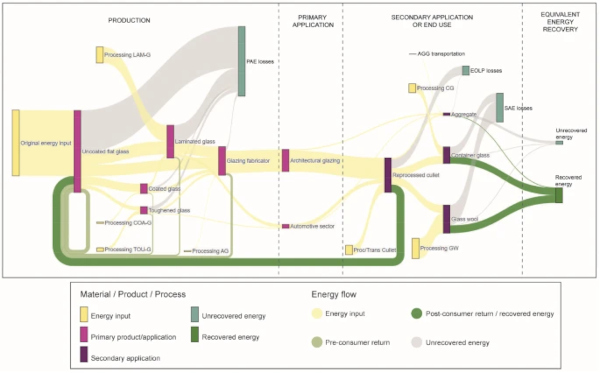
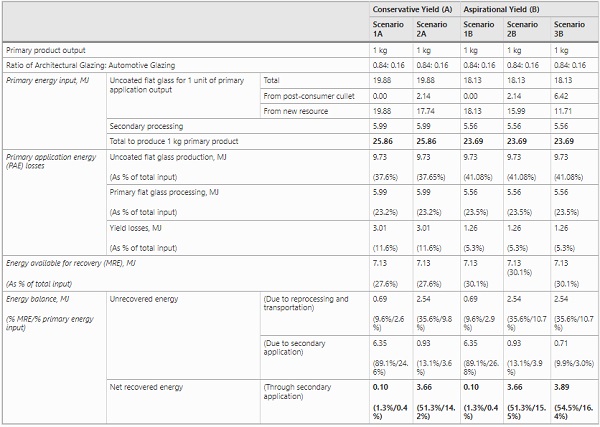
Table 6 details the energy inputs, associated energy losses, recovered energy (RE) and non-recovered energy (NRE) for the five scenarios presented introduced in Sect. 2.2.
Table 6 Energy input and equivalent recoverable and non-recoverable flows of energy for 1 kg of primary product with reference to the 5 pre-constructed scenarios - Full size table
3.3 Glass sector emission savings
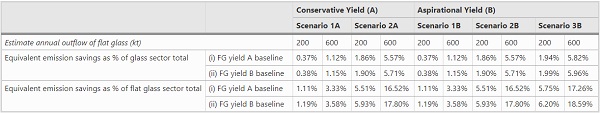
Table 7 presents the emissions saving potential of each recovery scenario, where each recovery scenario is representative of a specified distribution of primary output into secondary application (see Fig. 4 and Table 4). The total annual emission savings for each recovery scenario were calculated with reference to the baseline annual tonnage inflows of glass products listed in Table 5. The aspirational yield scenario yields a 2.7% reduction in total annual emissions compared to the conservative yield scenario. The equivalent emission savings presented in Table 7 have been calculated with reference to (i) the conservative yield baseline for FG production (ii) the aspirational yield baseline for FG production.
Table 7 Equivalent emissions saving potential of alternative recovery scenarios based on estimated annual outflow of flat glass - Full size table
4 Discussion
4.1 Existing end-of-life routes
The flow of resources presented in Fig. 5 provides a clear visualisation of the existing recovery pathways for glass products at their end-of-life and the extent to which each glass market takes advantage of the use of recycled cullet in the relevant glass production processes. Several external factors have led to a significant increase in the percentages of post-consumer cullet used in new CG production in the last 25 years. The introduction of an extended producer responsibility (EPR) scheme in 1997 mobilised significant investment into effective mechanisms for the collection of container glass including kerbside and bottle bank collection.
Through these schemes, 76.5% of container glass is now collected for recycling in the UK (British Glass 2020). Technological advancements in material recovery facilities have enabled the effective sorting of mixed household waste to obtain container glass cullet which can subsequently be reprocessed to an acceptable quality for the CG market. The CG market thus makes use of approximately 55% post-consumer cullet in new production, which sits within the average for European glass manufacturers (FEVE 2018).
Consequently, there is reduced demand for primary raw material resources, which in the instance of CG can contribute up to 28% of energy input (see Table 3). However, there is a significant imbalance between the types of CG produced and types of glass consumed and subsequently collected in the UK (Edgar et al. 2008; Lee et al. 2019). The UK production of clear CG is more than double that of green or amber container glass (Edgar et al. 2008; WRAP 2008a; WSP Parson Brinkerhoff and GL 2015). Collected cullet from green or amber collection cannot be reintroduced into the production of clear container glass and is often exported to external markets (Beerkens et al. 2011; JRC European Comission 2011).
The flat glass market accounted for ~ 23% of UK glass production in 2019. Estimates from reprocessors in the UK suggest that approximately 80–100 kt of flat glass is collected separate from other waste materials per year for recycling (Potters Ballotini Ltd. Reprocessors, telephone communication, 7 December 2020; Potters Ballotini Ltd. Reprocessors, email communication, 30 June 2022; URM Ltd. Reprocessors, telephone communication, 29 November 2021). Despite its recyclability, end-of-life building glass is rarely recycled into new flat glass products (see Figure 5). As an alternative, collected and sorted post-consumer flat glass is reprocessed for other applications.
Reprocessed cullet that meets an acceptable quality is returned to the container glass market, where there is less stringent acceptability criteria than in the flat glass market (JRC European Comission 2011). Cullet that does not meet quality requirements is sold to alternative markets, such as the aggregates market or glass beads. Private communications with glass reprocessors in the UK and the Netherlands exposed the existing capability to readily reprocess post-consumer flat glass to the container glass and glass wool markets (Shark Solutions 2022) (URM Ltd. Reprocessors, telephone communication, 29 November 2021; Maltha Glasrecycling Nederland BV, email communication, 31 December 2021).
Some FG manufacturers have more recently developed partnerships with local insulated glazing unit installers to recover post-consumer FG to use as cullet in new FG production (Saint Gobain 2020; Morley Glass & Glazing 2019). Flat glass that is unsorted from other building materials at the site of use is either down-cycled by crushing it together with other inert building materials for use in aggregate production/hard core on site or sent to landfill disposal. Landfill disposal is feasible due to the inert properties of glass: glass qualifies for the lower rate of UK landfill tax (£3.15/tonne instead of £98.60/tonne). Therefore the costs for disposing flat glass are often cheaper than the cost of separately collecting and treating the flat glass to make it suitable for recycling.
Demand for glass fibres for glass wool production has increased over the last 20 years. This is largely due to higher demand for insulation products that meet building energy performance targets. Glass wool production typically incorporates up to 55% of pre- and post-consumer cullet in new production. Cullet for use in glass wool production must also meet stringent acceptability criteria, albeit less stringent than the flat glass market (JRC European Comission 2011). Thus, a large proportion of the cullet used in glass wool production is internal cullet and reprocessed pre-consumer cullet from the flat glass sector (Knauf Insulation 2021).
4.2 Energy balance & emission saving potential
4.2.1 The effect of yield losses
Cullet arising from yield losses in the several stages of glass production are incorporated into new glass production as internal and/or pre-consumer cullet. These yield losses are either returned directly to the glass melting stage or, as is the case for a small margin of offcuts from the flat glass manufacturing process, they are first reprocessed before returning to the flat glass or glass wool market.
A useful insight gained from Fig. 6 and 7 and Table 6 is that for the same unit of final output, the use of pre-consumer cullet in new production does not necessarily reduce the demand for primary raw materials from natural resources. In fact, it increases the total energy and emissions per unit of output, where the unit of output is a product that fulfils a primary application. The alternative yields presented as conservative (A) and aspirational (B) in Table 6 provide further evidence for this. Based on the conservative yield scenario (A), the production of 1 kg of flat glass output (within glazing and automotive applications) equates to an energy consumption of 25.9 MJ/kgoutput and 1.76 kgCO₂-eq/kgoutput, which is 9.2% and 8.0% higher, respectively, than the aspirational yield scenario (B) where the same distribution of glass products with higher yields (i.e. lower levels of manufacturing waste generation) are considered. This margin may increase further if the energy costs associated with the return transportation of pre-consumer cullet to glass manufacturers are considered.
The sensitivity of energy savings to changes in yield highlight the importance of considering potential yield losses when evaluating the benefits of utilising greater proportions of post-consumer recycled glass (Beerkens et al. 2011). If higher proportions of post-consumer cullet lead to a reduced yield, the associated energy savings may be diminished. Yield rates should thus continue to be optimised with the aim to reduce energy input and increase resource efficiency across the glass value chain.
4.2.2 Use of post-consumer flat glass cullet in secondary applications
The use of cullet in new production has long been recognised as advantageous in terms of reduced energy input and corresponding process and combustion emissions. The existing collection infrastructure for end-of-life flat glass is under-established, meaning that these benefits are often left unexploited: a large proportion of flat glass ends up as aggregate or in landfill. The energy balance associated with the existing typical recovery route for flat glass was demonstrated through scenario 1A (see Fig. 4 and Table 6 for secondary application distribution). It was found that 0.4% of the energy used in new production is recovered through the reutilisation of waste glass in scenario 1A, where 74% of collected glass ends up as aggregate product.
The energy associated with transporting and reprocessing collected glass cullet was found to be non-negligible. The results presented in Tables 6 and 7 are based on a total energy input of 2.66 MJ/kgreproc-cullet and 0.17 kg CO₂/kgreproc-cullet, with reference to a total transportation distance of 800 km and an estimate for reprocessing methods to provide cullet of a suitable quality for FG, GW or CG based on Beerkens et al. (2011), Denison (1996) and GOV.UK (2021). These figures remains less than the energy and emissions associated with the sourcing and transportation of primary raw materials which was found to be 4.05 MJ/kg and 0.316 kg CO₂-eq/kg, respectively, where the production of soda-ash is found to be the main contributor.
Scenario 2A provides an example of the associated benefits of improved collection practices that enable a higher percentage of flat glass to be reprocessed into cullet suitable for other glass markets. Through improved collection and distribution to high-value glass markets, the percentage of available recoverable energy increases from 0.4% (S1A—11% collected glass reprocessed to furnace-ready cullet) to 14.2% (S2A—90% of collected glass reprocessed to furnace-ready cullet). This figure is comparable with the available literature. For example, one study evaluated the energy implications of glass container recycling in the US including transportation distances and calculated that the total primary energy use decreases as the percent of glass recycled rises by a maximum saving of 13% (Gaines et al. 1994). Alternative methods of transportation and transportation distances for collected glass will remain a key factor to monitor in order to assess the sensitivities in the calculated energy and emission savings. Further research on the locations of reprocessing facilities, collection sites and glass manufacturing facilities in the UK, and their relevant production capabilities and reprocessing yields would be valuable.
Scenarios 2A and 2B consider end-of-life recovery routes that differ from scenarios 1A and 1B. In scenarios 2A and 2B, 30% of collected flat glass is siphoned to the CG market. The remainder is distributed to FG, GW and AGG at 30%, 30% and 10%, respectively. Scenario 3B considers a situation where 90% of collected cullet is siphoned to FG and 10% to AGG. Scenarios 2B and 3B translate to a recovered energy percentage of 15.5% and 16.4%, respectively. The marginal difference highlights that the use of collected FG in alternative markets where there are less stringent requirements for cullet quality could still significantly contribute to reducing the energy demand of the glass sector as a whole.
The flat glass market is projected to grow as a result of the continued drive to refurbish existing builds in order to meet new energy performance targets: it is projected that 44% of the existing glass stock in the EU is single-glazed (Glass for Europe 2018). Figure 5 provides a representative example of existing collection practices for flat glass based on an estimated outflow of 485 kt. This estimate was considered reasonable, based on the 1996 flat glass production figure of 690 kt in the UK (Kellenberger et al. 2007; Maria et al. 2013) and given that (Kellenberger et al. 2007) estimated that IGUs account for between 40–50% of the architectural glazing market by mass with a typical expected lifetime of an insulated glazing unit (IGU) is 25–30 years.
The estimated outflow of 485 kt shown on Fig. 5 thus also aligns to some extent with the 215 kt outflow prediction for the year 2025 evaluated by (Hestin et al. 2016) where they used a top-down method to estimate glass stock based on the typical mass of insulated glazing units (IGUs) alone, i.e. where this could be considered as 40–50% of the total architectural glass market. In Table 7, two alternative estimates were considered for the outflow of flat glass stock per annum, based on the production figures for flat glass in 1996 and energy- and CO2 emission-saving potential for the various scenarios constructed in this study. The low-end estimate outflow at 200 kt, would yield 1.9% savings in CO2 emissions across the glass sector and 5.5% savings in the flat glass sector alone for scenario 2A. For the same scenario, the high-end outflow estimate of 600 kt would yield 5.6% savings in emissions across the glass sector and 16.5% within the flat glass sector alone. Moving towards more aspirational manufacturing yield (B) could reduce emissions by a further 1–2%.
Bottom-up research of the existing glass stock is necessary to formalise projections of glass outflows. The figures on Table 1 are based on final glass products to market. It must be noted that automotive glass production does not take place in the UK: the automotive flat glass products are imported for fabrication into their final product application. Nevertheless the finished automotive glass products are placed to market and have therefore been considered in this study. Exact values for inflows and outflows of glass products arising from imports and exports have not been included in this study. EU-27 imports and exports have been found to account for 10–20% of UK flat glass production and consumption (Glass Alliance Europe 2021).
4.3 Barriers to the use of post-consumer cullet
Fears surrounding incorporating post-consumer cullet in flat glass production have arisen from concerns over contamination from glass–ceramics, organic materials and metals. The incorporation of unknown and uncontrolled compositions of cullet can result in high production losses and set back flat glass production for several days. These problems can include: glass melting disturbances by foaming or limited heat transfer into the glass melt caused by a changed carbon content of incoming cullet via polymers; the build-up of ceramic inclusions that have a very low dissolution rate in the glass melt; the build-up of nickel-sulphide inclusions formed due to contamination of the glass melt by stainless steel flakes; reduction of silica into silicon inclusions due to the reducing effect of aluminium contaminants; and/or downward drilling of melts of metals present in the cullet (Beerkens et al. 2011; IMPEL 2012).
Such problems can lead to refining difficulties; reduced furnace lifetime; product colour changes; reduced mechanical strength due to differing thermal expansion coefficients between the glass and inclusions; fumes from organic contamination; and emissions of particulate matter arising mainly from the volatilisation and subsequent condensation of volatile batch materials (Maria et al. 2013). The effects of polymer contaminants on the altered carbon content of the glass melt can be mitigated to some extent by adding sodium or potassium nitrate as an oxidising agent to stablise the redox state of the glass (Beerkens 1999; Maria et al. 2013; Zier et al. 2021). However, this will consequently increase the nitrogen oxide (NOx) emissions (Maria et al. 2013).
To prevent these problems, preliminary purification and sorting of post-consumer cullet is normally required (Maria et al. 2013; Zier et al. 2021). This can involve a series of reprocessing steps: waste glass is passed through a series of separation techniques including magnets, screens, cyclones, eddy current separators, cameras and X-ray equipment, in order to sort and grade the quality of reprocessed cullet. The necessary reprocessing methods and resultant cullet quality can vary significantly and is highly dependent on which secondary processes have been utilised and the condition upon collection. For example, cleanly collected toughened glass free from interface materials can be readily reprocessed and recycled to ‘furnace-ready’ cullet. Alternatively, ceramic-fritted glass is difficult to recycle due to the high melting temperature of ceramics leading to ceramic inclusions in the final glass product.
Concerns over re-introducing laminated glass directly into the float glass tank have arisen from the organic poly-vinyl butyral interlayer—which can account for up to 7% by weight of the laminated glass sheet—altering the finely controlled redox state of the glass (Beerkens et al. 2011; Beerkens 1999). Thus, laminated glass necessitates more specialised reprocessing techniques to separate the glass from the polymer interlayer prior to use. This usually involves breaking up the glass using a roller or similar mechanical action, followed by removal of the glass (Fernández Acevedo et al. 2008; Tupy et al. 2014). Each additional reprocessing step may lead to additional costs and yield losses. Options for alternative secondary applications include foam glass, glass abrasives and glass beads, where there are less stringent quality requirements (Brusatin et al. 2004; JRC European Comission 2011; Kasper 2006; Lebullenger and Mear 2019). However, these applications have been found to yield significantly less environmental savings than higher-value glass applications (Enviros Consulting Ltd 2003; Hartwell and Overend 2019).
An improved understanding of the ability to enhance collection and reprocessing of post-consumer glass to the key glass markets is essential. Whilst existing levels of post-consumer cullet remain relatively low across all glass markets, it would be beneficial to consider grading post-consumer flat glass cullet to then distribute to relevant markets based on quality. The reprocessing yield associated with generating ‘furnace-ready’ cullet from different flat glass product types will require further research. Meanwhile, technical methods that help to increase the efficiency of sorting and reprocessing flat glass products that contain adhering polymers/sealants would help to increase the yield rates of reprocessed cullet.
A consistent and reliable supply of reprocessed cullet of an acceptable quality will be essential to mitigate the risk associated with incorporating contaminants in new glass production, and subsequently aid the transition to incorporating higher percentages of post-consumer glass. It is clear from the difference in the total energy required per unit of output in conservative (25.9 MJ/kgoutput) and aspirational (23.7 MJ/kgoutput) yield scenarios evidenced in Table 6, that an increase in post-consumer cullet must not come at the expense of increased yield losses at the glass manufacturing stage.
Aside from environmental opportunities, financial opportunities stimulated through market-mechanisms and/or external legislation, will remain the key driver to the adoption of post-consumer waste glass recycling. Two key factors need to be evaluated to realise the market opportunities for post-consumer flat glass cullet and ensure competitiveness with primary raw materials. Firstly, the cost of collection, reprocessing and transportation will have to be assessed alongside the negated costs for the equivalent quantity of raw materials. Several reprocessing sites exist in the UK and nearby European countries. The added costs associated with collection and transportation to relevant sites requires further investigation.
The second crucial factor to demonstrate economic feasibility is the direct and indirect financial savings that arise from production of glass products that use of higher proportions of post-consumer cullet. Energy costs represent a large proportion of operating expenditure in UK energy-intensive industries (Griffin et al. 2016). The use of post-consumer cullet of an acceptable quality, will reduce direct energy costs due to lowered furnace operating temperatures. Similarly, negated emissions through the use of post-consumer cullet have the potential to reduce indirect costs incurred to glass manufacturers via the UK emissions trading scheme (ETS). The financial consequences of energy and emission savings require further research. This could help to direct UK policy on ETS, carbon taxes and necessary subsidies/loans that support the necessary take-back infrastructure (Norman 2013).
In the instance where market opportunities for cullet have not been realised, revisions to external legislation (voluntary and/or involuntary) will be necessary. VlakGlas Organisation in the Netherlands facilitates an extended producer responsibility (EPR) scheme for flat glass products (Vlakglas 2021). Insulated glazing unit fabricators pay a levy on finished products which supports the provision of a network of collection sites and supporting logistics. The UK container glass implemented the Producer Responsibility Obligations (Packaging Waste) Regulations legislation in 1997 (recently updated for 2023) to align with the EU Packaging Waste Directive released in 1994. The regulations place responsibilities on the producers and handlers of packaging to achieve periodically updated recycling targets. The high recycling rates in the container glass industry are, in part, a reflection of the success of this scheme.
The effectiveness of these schemes in the context of the UK flat glass sector requires further investigation. Additional legislation for the handling of glass waste at the end-of-life stage also requires attention. Glass for Europe takes the view that the current targets on building waste materials presented in the EU Waste Framework directive do not provide enough incentive to recycle glass because glass represents less than 5% of the C&D waste (European Parliament and Council 2008; Glass for Europe 2018). They suggest material-specific targets for waste and/or the introduction of mandatory provisions to dismantle and sort building glass. UK-based BREEAM certification schemes call for 95% of construction materials to be reutilised in some form. There is currently no specification for the type of reuse, therefore the use of flat glass in aggregate products would receive the same credit as the use in higher value products.
Future revisions to legislation and/or accreditation schemes such as BREEAM would help to share the responsibility of high-value recycling across the glass value-chain. Such an approach would necessitate audits at the demolition or refurbishment stage to detail the type and dimensions of glass products for example, laminated or toughened. This process could be automated in the future through the implementation of material passports in BIM models and/or RFID tracking (with consideration of potential contamination from the materials used in RFID tags), to provide details of the glass composition, processing methods and reuse/recycling potential (Honic et al. 2021; Luscuere et al. 2019; Rose and Stegemann 2018).
The aggregates levy is a UK tax on the exploitation of primary raw materials. Inadvertently, this creates a demand-side pull from the aggregate market for crushed flat glass. Glass also qualifies for the lower grade of landfill tax due to its inert properties. Improved awareness of the environmental and economic costs of the existing recovery pathways for flat glass to these low-value end-of-life applications is required, to provide supporting information to revisions in policy. Policy must be carefully considered in such a way that does not reduce domestic competitiveness or promote international trade in regions with less energy-efficient manufacturing processes (Peters et al. 2011).
4.4 Alternative routes to minimise energy input
The annual emission savings for scenario 3B featured in Table 7 show that even in the event that 90% of flat glass is collected and reprocessed from a yearly outflow of 600 kt, the emissions associated with yearly production (950 kt) could be reduced by a maximum of 18.6% when all glass production stages (stages 1 to 4) are considered (Fig. 2 and Table 3). Beyond the use of post-consumer cullet, further energy savings will be dependent on the: energy source; type of furnace/heating technique; heat recovery method for primary processing; and choice of secondary processing methods.
Existing studies have reviewed the energy consumption and decarbonisation options available through furnace type and alternative fuel sources, including: oxy-fuel melting, biofuels, hydrogen, all electric-melting, and hybrid furnaces (Griffin et al. 2021; Ireson et al. 2019; Maria et al. 2013; Zier et al. 2021). Furnace type, age, capacity and throughput have been found to significantly affect the energy efficiency of the glass furnace (Glass Technology Services Ltd 2004; Maria et al. 2013; Zier et al. 2021). Alternative fuel sources have the ability to reduce on-site energy consumption for glass production. However, they must be carefully considered in terms of availability, electricity required to generate them (scope 2–3 emissions) and other environmental costs/benefits.
A fuel source that saves energy on site, but indirectly leads to greater upstream emissions, may not be a favourable choice. For example, electricity is used for the purification of oxygen to be used as a fuel source. It has been suggested that the CO₂ saving from the use of oxy-fuel furnaces are generally low when upstream emissions are considered (Ireson et al. 2019), however, the strongly reduced NOx emissions are worth noting (Zier et al. 2021). Better consideration of indirect CO₂ emissions are of particular importance in the global industry sector where scope 2 and 3 emissions have been found to have nearly doubled between 1995–2015 (Hertwich and Wood 2018).
Based on the existing distribution of flat glass products, primary application energy (PAE) losses (arising from priamry and secondary processing methods) account for 70–73% of the total energy input for 1 kg of flat glass in its primary application (see Figs. 6 and 7 and Table 6). Primary energy losses have the ability to be recovered through heat recovery methods (Maria et al. 2013; Norman 2013; Zier et al. 2021) About a third of energy input to a gas fired furnace exits as waste heat in the flue gases. British Glass (2021) highlight that the majority of glass furnaces in the UK have regenerators that recover waste heat which is used to preheat the combustion air. It has been proposed that this waste heat could be utilised to preheat the raw materials using a batch and/or cullet preheater, as a result improving the efficiency of the melting process (British Glass 2021).
Secondary processing methods were found to contribute up to 23% of the original energy input based on the typical distribution of flat glass products (see Table 6) evaluated in this study. This is largely due to the toughening and laminating processes. The production of poly-vinyl butyral is a significant factor in the relatively high energy costs for lamination. Thus, options for the use of thinner interlayers or alternative materials should be investigated. Toughened glass involves unavoidable high temperatures for processing. Increased awareness of the environmental cost of specifying secondary processing methods would help to ensure that design options are optimised to provide sufficient function at minimum energy input.
Alternative options for material efficiency such as the direct reuse of flat glass, could significantly reduce PAE losses by avoiding the need for remelting cullet and energy-intensive secondary processing methods. However, as demonstrated by Afolabi et al. (2016), Datsiou and Overend (2017), strength-reducing flaws can accumulate on exposed glass surfaces of glass during its service life. Therefore the suitability of reuse as a viable recovery option, requires further investigation to evaluate any potential trade-offs in performance and possible reconditioning methods. Energy costs associated with transportation and storage options for reuse also require consideration.
4.5 Limitations of data and scope
For the purpose of this study, some assumptions have been made that will affect the energy and CO₂ emissions savings presented. Where UK energy data was unavailable, the data used to calculate the reference energy input and CO₂-eq emissions per annum for each glass sector is based on an average dataset for furnace technology in the EU in 2005–2007 (Schmitz et al. 2011). The furnaces available within the glass industry, and within each sub-sector, vary considerably in size, throughput, melting technique, design, age, raw materials utilised, and the abatement techniques applied. For example, a more inefficient furnace could yield higher energy savings. Therefore, the absolute values for recovered energy and emissions calculated in this study should not be considered exhaustive.
The use of cullet was taken to reduce energy consumption by 3% for every 10% increase of cullet based on (Beerkens et al. 2011). In reality this figure may vary: Glass Technology Services Ltd (2004) evaluated the use of cullet in container furnaces and found a variation of energy savings between 2–4% for every 10% increase in cullet, depending on furnace size, age, moisture content and total percentage of cullet.
This study provides information on the influence of secondary-processes on the embodied and end-of-life stages of the flat glass product lifecycle. To obtain a more holistic view on the trade-offs in energy inputs with final product application and reuse, it will be necessary to consider other life-cycle stages such as operation and use, where their deployment can significantly reduce the operational energy costs in buildings, for example (Maria et al. 2013; O’neill et al. 2020; Rayment 1989).
5 Conclusion
In order to initiate public and/or private investment to promote effective collection and reprocessing schemes, it is critical to have a better understanding of the existing environmental opportunities of increased cullet usage across the glass value-chain. This study set out to map the UK glass supply-chain from nature resource through to end-of-life recovery and disposal. Based on this, it further sought to understand the environmental cost of production and evaluate the feasibility of improved collection and recycling rates of flat glass as a route to reduce the GHG emissions from the UK glass sector. Subsequently, the main legislative, technological, supply-chain and economic influences that lead to the wide variance in the use of cullet in place of primary raw materials between glass sub-sectors were critically reviewed.
A clear distinction between internal/pre-consumer cullet and post-consumer cullet is necessary when considering the recycled content of a unit of flat glass output. The use of post-consumer cullet is the sole factor that has the potential to deliver energy savings in new flat glass production. Whilst the use of internal or pre-consumer cullet reduces the quantity of manufacturing waste to landfill, the analysis of alternative production yield rates (conservative and aspirational) provides evidence that the production of internal/pre-consumer waste increases the total energy input required per unit output of finished glass product (see Table 6). The additional energy input attributed to the production of internal and pre-consumer waste, i.e. glass that does not spend a period of time in use, should thus be included in the reporting for the total energy per unit output of finished glass product.
The use of post-consumer cullet in new glass production is the only existing technologically readily available option to reduce process emissions. Other options for reducing process emissions such as the use of alternative raw materials or carbon dioxide removal (CDR) technologies are in their early stages of development. Container glass manufacturers use relatively high percentages of post-consumer cullet in new production, as a consequence of long-established extended producer responsibility schemes and supporting collection infrastructure and sorting processes. The collection of flat glass products for recycling at their end-of-life is estimated to be at a rate of 10% of new flat glass production.
With the exception of a few small-scale initiatives, collected flat glass is rarely returned to the flat glass market. Thus glass manufacturers typically operate at < 1% post-consumer cullet. One of the key limitations of incorporating higher percentages of post-consumer flat glass in new production is the stringent acceptability criteria for cullet which exists to prevent yield losses. Given the known imbalance in the types of CG produced and consumed in the UK, the outcomes of this study highlight that the option for collected flat glass to be incorporated into container glass products could yield significant energy savings supported by market demand. In this study, it was found that CO2 emission savings of 5.6% (30% to FG, 30% to GW, 30% to CG, 10% to AGG) and 5.8% (90% to FG, 10% to AGG) could be achieved across the whole glass sector, or 16.5% and 17.3% across the flat glass sub-sector, through improved flat glass recovery alone.
These figures are based on a high-end estimated outflow of 600 kt collected flat glass. It draws attention to the fact that significant energy and emission savings can be made through the reutilisation of cullet in container glass and glass wool applications, in the instances where the acceptability criteria for flat glass cannot be met. Relevant incentives may be required for manufacturers that produced the original flat glass product. Alternative mechanisms for more effective flat glass collection networks should be investigated. It would be beneficial to track the recovered cullet from collection sites through to reprocessor to understand what quality is achievable and thus promote the collection methods that are most effective.
Access to flat glass cullet in the UK is currently limited: an improved understanding of the existing market opportunity to advance improvements in existing deconstruction and collection practices is required. This study identified the key financial elements that will influence the transition from the use of primary raw materials to higher percentages of post-consumer cullet. These include, but are not limited to: added costs for cullet transportation, reprocessing and storage; savings in primary raw material costs; savings in the CO2-emission related taxes due to reduced production emissions; and savings in avoided landfill taxes. Further research should look to develop an economic model that considers these factors collectively, to attract relevant investment and/or provide evidence for supporting policy where necessary. Any additional costs to glass manufacturers will need to be distributed across the value-chain to ensure that the UK remains competitive and avoids promoting imports from less energy-efficient manufacturing areas.
The existing production process for glass inherently necessitates the use of energy to melt constituent raw materials including cullet. Thus, further reductions in emissions beyond recycling will undoubtedly call for a transition to low-carbon energy sources and new furnace technologies. The work of Glass Futures UK looks to expand the capacity of alternative fuel sources. UK demand for renewable energy sources will continue to rise as the UK seeks to decarbonise all sectors. Thus all options for energy efficiency improvements will need to be considered holistically.
By focusing decarbonization options centred on the energy input and GHG emissions associated with glass production alone (scope 1 emissions), a direct reduction may be offset by an increase in other areas of the value-chain such as fuel supply or raw material sourcing. This ‘carbon leakage’ effect may involve an overall rise in global emissions. For this reason, this study includes raw material sourcing/processing and energy input and emissions associated with fuel supply to reduce the burden of demand for alternative energy sources. Other valuable approaches for reducing energy input will need to: better understand the feasibility of facilitating flat glass reuse, since this eliminates the need for remelting; optimise procurement routes for primary raw materials e.g. sourcing, processing and transportation; and increase the awareness and availability of secondary processing methods that provide sufficient functional performance at minimal environmental cost.
Change history
07 February 2023
A Correction to this paper has been published: https://doi.org/10.1007/s40940-023-00218-z
References
Acknowledgements
This work was supported by the UK Engineering and Physical Sciences Research Council (EPSRC) for the University of Cambridge Centre for Doctoral Training in Future Infrastructure and Built Environment (EPSRC grant reference number EP/L016095/1). The authors would like to extend their thanks to Dr. José Cruz Azevedo for sharing his experience in mapping material resource flows in the early developmental stages of this research.
Author information
Authors and Affiliations
- Department of Engineering, University of Cambridge, Queens’ College, Silver Street, Cambridge, CB3 9ET, UK - Rebecca Hartwell
- Eckersley O’Callaghan Ltd, 236 Grays Inn Rd, London, WC1X 8HB, UK - Graham Coult
- Department of Architectural Engineering & Technology, Delft University of Technology, Julianalaan 134, 2628 BL, Delft, The Netherlands - Mauro Overend
Contributions
Rebecca Hartwell: Conceptualization, Methodology, Material preparation, Investigation, Data collection and formal analysis, Visualization, Writing—original draft, Writing—review & editing, Project administration. Graham Coult: Conceptualization, Methodology, Writing—review & editing. Mauro Overend: Conceptualization, Supervision, Writing—review & editing.
Corresponding author
Correspondence to Rebecca Hartwell.
Ethics declarations
Conflict of interest
The authors declare that they have no known competing financial interests or personal relationships that could have appeared to influence the work reported in this paper.