This paper was first presented at GPD 2023.
Link to the full GPD 2023 conference book: https://www.gpd.fi/GPD2023_proceedings_book/

Authors: Adrian Lareida, Jörg Leyendecker, Michal Kuffa & Matthias Loppacher
Abstract
Cutting and breaking is a common step in the production process of float glasses. On a machine manufactured by Glaston, the process is controlled by a breaking sphere, pressing on the upper surface and a "satellite" supporting from the lower surface.
Investigations of different positions of the sphere and the satellite and their effect on stress distribution are studied. Both, experimental observations and computational FEM simulations are compared.
These stresses are responsible for how the glass is breaking. A holistic understanding of those stresses will allow to achieve an optimal cut-edge. Principles can be derived from investigations on different shapes to improve the quality of manufactured parts.
Introduction
Glass quality
The quality of the glass edge in an as-cut state has been investigated in the scientific community for several decades. Strength has been a basis to quantify glass quality in investigations throughout. Shitova et al. [1] used the bending strength of glass specimens as a measure of quality. Kondrashov et al. [2] also used the bending strength as a criteria and tested different cutting wheels and cutting forces. Sarkisov et al. [3] investigated the influence of internal stresses of the glass on the quality during cutting.
Lindqvist [4] investigated the influence of defect size on the breaking stresses in glass. Their focus was to predict the failure stress from the defects.
Jung et al. [5] automated the cut and break process from manual breaking to automatic breaking. The production was improved by reducing the number of workers from 6 to 0, the tact time was improved by 40%, the size accuracy of the cut panels was improved by 62%, and the squareness error of the pieces by 50%. This shows another quality measure, namely the geometric accuracy.
Akiyama et al. [6] investigated diamond cutting wheels manufactured with different grinding directions. They used chipping as a quality measure for their experiments.
Li et al. [7] did a parameter study on the glass edge and surface optical quality. Parameters were the cutting wheel material (diamond or hard-alloy), the glass material, the glass manufacturer, cutting wheel angle, cutting speed, cutting force and glass thickness. They found better surface quality with the diamond cutting wheel, thin glass better with a smaller angle and higher cutting force with thicker glass. The cutting speed was not influential. The surface quality was investigated using optical microscopy on the glass edge surface.
Müller-Braun et al. [8] measured the failure stresses in glass specimens using a four-point bending test and breaking the samples by bending them in their upright position with the edge to be characterised at the bottom.
Li et al. [9] focused on the optimisation of a laser-cutting process. They measured chipping area and the largest chipping depth as quality parameters.
Yang et al. [10] performed experiments to determine a feasible range of a laser system for glass cutting. Figure 1 shows the feasible range and that quality was determined if the glass edge showed ripples or chips and if the glass can be opened or if it breaks during cutting.
Drass et al. [11] used artificial intelligence to segment the cutting edge in areas of chipping and unchipped ones. This was also done with respect to automate the detection of the glass edge and thus strength as a measure of quality.
In the practitioners guide from the FletcherTerry-Company [12], the glass quality is described as follows. The quality is separated in score-line-quality, which is good if there are no particles present, the ease of break-out quality in terms of the difficulty to separate the glass after cutting, the edge-quality in terms of perpendicularity and if there are “sharks teeth” or vertical lines visible.
![Figure 1 Quality study with laser cut glass samples, from [10].](/sites/default/files/inline-images/Fig1_360.jpg)
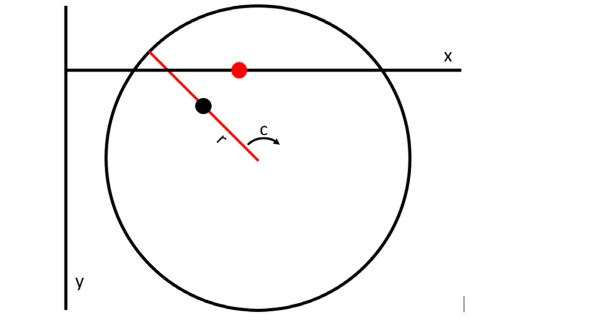
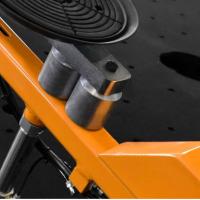
However, the breaking itself seems not of particular interest in literature. An assumption could be that the particular processes for breaking differ depending on the application or the machine manufacturer. To show that the edge quality is very much determined after the final separation, assuming a “good” cut was made, this investigation has been performed. In the current investigation, a special cutting table from Glaston was used to investigate the breaking process. The machine has a circular support table with an integrated “satellite” which is able to move radially from the centre of the table. The table is able to rotate around its centre. Thus, no template is needed to break the glass since the support is coming from the pressing of the satellite against the bottom side of the conveyor belt. Figure 2 shows a schematic of the axes on this machine.
The goal of this investigation is to improve the cutting edge quality by changing the satellite position relative to the breaking sphere. After cutting and breaking, the glass piece should have a squared edge with minimized chipping area on bottom and top side in a constant quality. Larger dimensional deviations and defects must be removed by the following grinding process. Uncontrolled quality issues require extensive grinding demands, which results in higher cycle time, stronger tool abrasion and costs.
Principle process understanding will support and optimize machine operations, parameter definition and production stability. Valuable time can be saved in job preparation for challenging new products and applications.
Material and Methods
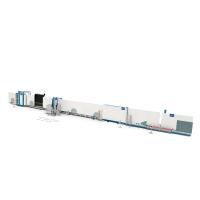
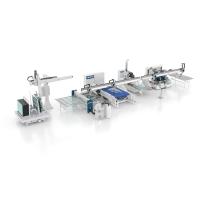
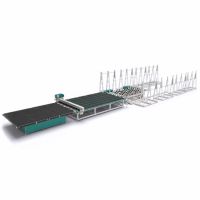
Experiments
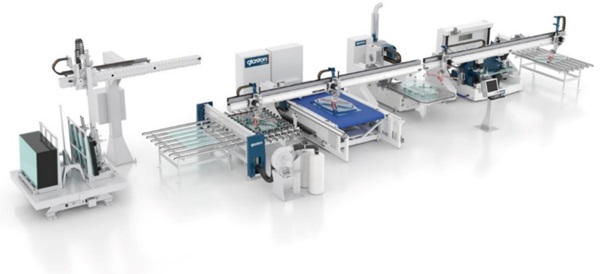
Figure 3 shows the Glaston Champ Evo cut line, where the cutting and breaking table is shown with its distinct blue conveyor belt to remove the residual glass after cutting and breaking. The specific machine used in the experiments is equipped with a circular table beneath the conveyor belt with an included radial slit, where a so called satellite, can move in and out radially and it can push out of the table plane to push against the conveyer belt and subsequently against the glass. The idea behind that system is to get rid of templates and thus allow for a flexible system, where shapes can be changed from glass to glass without the necessity of changing a template. For the set of experiments, the main focus was to investigate the behaviour of a leading and lagging position of the satellite relative to the breaking sphere. The satellite moves beneath the cutting path and the breaking sphere moves with a distance of 30 mm parallel to the cutting path. Lead was established by a 30 mm advancement of the satellite while lag was established by starting the satellite movement later so that the satellite position is 30 mm behind the breaking sphere. Furthermore, a parallel situation is investigated as well. As a second parameter, the thickness of the glass was varied.
Two thicknesses, namely 2.1 mm and 2.85 mm were chosen, which represent common thicknesses in the automotive glass cutting industry.
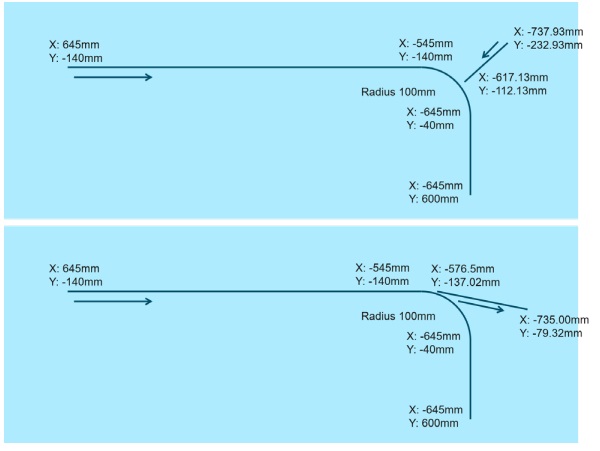
A third parameter was the type of auxiliary cut. The geometry chosen was a 1190 mm long straight section followed by a 100 mm radius to the right from the breaking spheres perspective. In the radius section two types of auxiliary cut were chosen, which can be found commonly with this type of geometry. In the case of the 2.1 mm glass, the situation with no auxiliary cut was investigated as well. Figure 4 depicts the geometry, including point coordinates. The center of the rotating table is the coordinate origin.
The fourth parameter varied was the height of the satellite. Usually, the satellite moves 1 mm out of the table plane to support the glass.
This was varied to also include a 2 mm upward movement.
The experiments were labelled with numbers in a format abc, where a is either 0, 1 or 2 for lag, parallel or lead, b is 0, 1 or 2 for “no auxiliary cut”, “type 1” or “type 2” auxiliary cut and c is either 0 or 1 for the 1 mm upward movement or 2 mm upward movement. The experiments for the thicker glass were additionally labelled with “_285” at the end of the label. All possible combinations were tested, and some of the thicker glass experiments were repeated for the statistical significance.
Constant parameters were the cutting and breaking force of 40 N, the cutting wheel Bohle Active 5.6mm 145°, the cutting fluid Chemetall Acecut 6000 and the cutting and breaking speed.
During the experiments, the axes of the breaking sphere and the satellite were recorded. Furthermore, a high-speed camera Phantom V12.1 running at 3000 fps was used to record the breaking process in the radial section. This allows to see the approximate position of the tip of the crack and the position of the breaking sphere and the satellite. This was later used to validate the simulation. The radial sections of the glasses were cut from the rest of the glass and visually observed under the microscope Keyence VHX1000. The repetitions were investigated at the site with a Leica microscope.
Simulation
The simulation of the glass sheets was performed using the commercial FiniteElement-Modelling (FEM) Code Abaqus 2021. Four jobs were chosen, namely the two best-performing and two worst-performing jobs. The main interest was to observe the stresses during the breaking process in the vicinity of the radius which has been observed microscopically. Furthermore, the crack opening procedure could also be analysed in detail.
From the nature of the process, dynamic simulations were calculated using the explicit solver. The process was split into three steps. In the first step, the satellite moved to the desired position and gravity was activated as well. In the second step, the breaking sphere was pushed against the glass sheet with a force of 40 N. The third step was the sliding movement of the sphere and the satellite up to the first stop in the corner of the glass. The real-time of this process was around 2.3 seconds. To speed up the simulation, mass scaling was used.
Four parts are simulated, namely the glass sheet, the breaking sphere, the satellite and the supporting table of the cutting machine. All elements were modelled as shells and the glass sheet was split into a part where the cut was and a part which included no cut. The material which was assigned to the cut part used a brittle cracking model. Thus, the elements were deleted after a certain stress threshold was reached. The final threshold was at 12.5 MPa. The simulation was validated by comparing the crack opening position in the highspeed camera videos to the position in the simulation. The first point was the moment when the crack reaches the radial part and the second point was different depending on the auxiliary cut. Auxiliary cut 1 had the end of the radius as its second point while auxiliary cut 2 had the outer end of the auxiliary cut as its second point. The position of the breaking sphere was compared between simulation and experiment.
Results and Discussion
Experiments
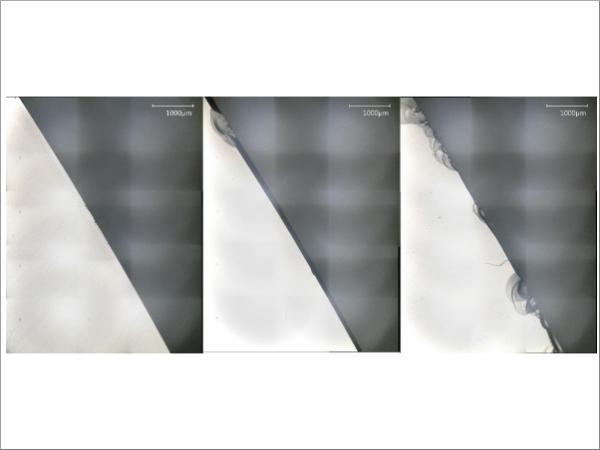
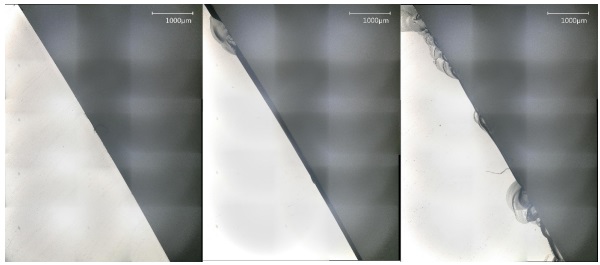
The glass quality was determined by microscopic investigations. On each glass, two sections in proximity to the ends of the auxiliary cuts were observed. The determining artefact for quality was the amount of chipping on the bottom side. A quality index of zero, one and two was established based on visual impression. An example of each quality assignment is depicted in Figure 5.
The assignment of quality using this technique is objective since the classification was obvious for all pictures. The parameters led to a substantial impact on the quality index. The influence of all parameters is important, the largest influence is observed for the type of auxiliary cut and the satellite position. Furthermore, a qualitative good cut needs to have the right combination of parameters. Additionally, trying to apply a linear model to this case did result in a poor model with low RMSE values of around 50%. This shows that the process is complex and the interdependencies can’t be predicted in a simple way.
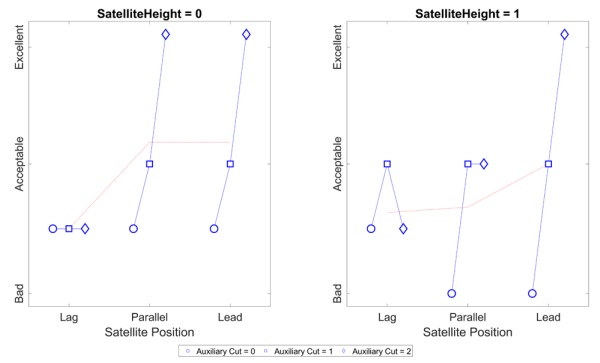
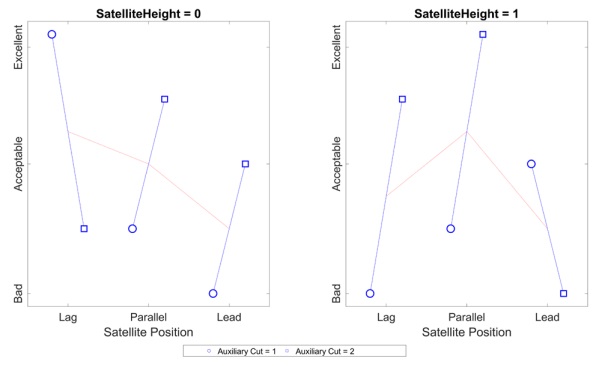
Figure 6 and Figure 7 show the results for the 2.1 mm and the 2.85 mm thick glass, respectively. For the 2.1 mm glass, having an auxiliary cut improves the breaking in all cases. Furthermore, the second type of auxiliary cut proved to be the best choice in most cases, as well as having the satellite position parallel or in lead relative to the breaking sphere. A lower satellite height also improves the breaking generally. But there can also be seen no or worse effects when inspecting for example the case when the satellite is lagging. Then, changing the auxiliary cut leads to worse conditions or it does not improve as suggested. From the experiments, four samples were chosen to simulate. The experiment numbers were 010, 121, 210 and 221 where the first two represent good conditions and the last two bad conditions.
Simulation
The simulation allows to get an idea of the deformation of the glass sheet during the process. It allows to slow down the process and see the influence of the factors on the deformation. From that, it is possible to extract the points in time, where the glass is breaking at the measured points.
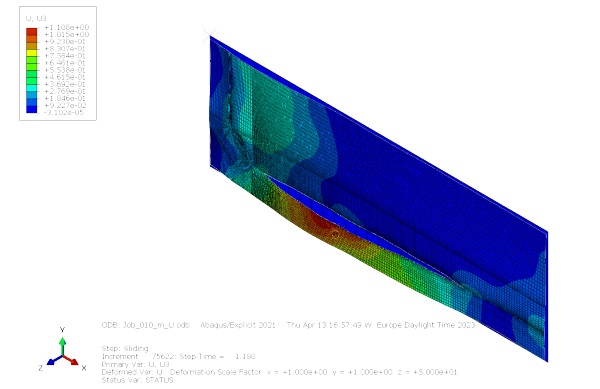
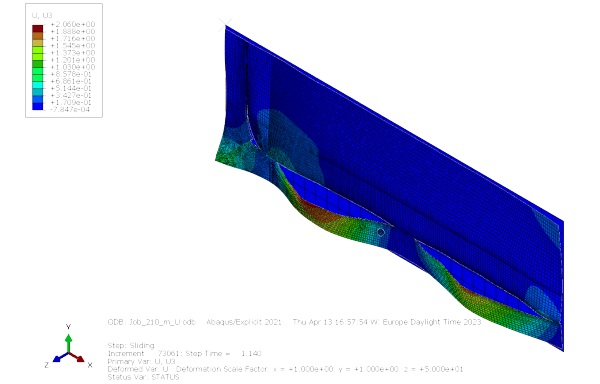
The animations of the breaking process showed that the two bad-quality examples broke more violently than the good-quality ones. Figure 8 and Figure 9 try to depict that behaviour. It can be seen that the cut opens completely in a stage, where the breaking sphere is about halfway through the linear section. The animations are useful for a user to get an understanding of how the dynamics of the process influence the movement of the glass sheet. In the simulation, the deformation of the glass sheet can be visualized with a deformation factor, thus allowing to see large deflections, even if they are small in reality. Once a geometry is defined, the simulation runs for approximately one hour and 30 minutes on one Xeon W3670 (3.2GHz) CPU core. The movement of the sphere and the satellite can easily be imported as a point list.
Figure 10 shows the validation of the simulation in terms of the position of the breaking sphere at a certain position of the crack opening. It can be seen that 10 MPa of breaking stress is too small because the crack opens too fast. The 12.5 MPa is closer to the experiments at least for the 010 and 210 case which have the first type of auxiliary cut. For the other type of cut, 12.5 MPa seems to be too little. However, in a simulation where 15 MPa was set, the crack did not open in the 010 simulation, so this is too high. The real value thus should be in the range of 12.5 MPa to 15 MPa.
Conclusion
The relative displacement of the satellite to the breaking sphere can be used to improve the quality of the broken glass edge. However, finding the best setting needs trial and error, but in combination with a simulation, the trial sets can possibly be reduced. The simulation allows the user to get an idea of the deformation behaviour of the glass sheet and it can help create improved auxiliary cuts.
The investigation also showed the complexity of the process and the strong interdependency of the varied parameters. Further investigations can be performed on different geometries and auxiliary cuts to understand the process even better.
The simulation of the glass cutting and breaking is also a new approach, which hasn’t been done in the literature. The simulation can be improved by setting the uncut part of the glass to be able to break as well, just with higher failure stress. This allows to see critical spots, where the breaking path deviates from the scoreline.
Acknowledgements
The authors would like to thank the industrial partner Glaston Switzerland AG for their support in carrying out the experiments. Further thanks go to Innosuisse, the Swiss Agency for Innovation Promotion, for financially supporting the project.
References
[1] Shitova, L.A., Lalykin, N.V. & Kuznetsova, T.A. Glass edge quality and strength. Glass Ceram 48, 327–329 (1991). https://doi.org/10.1007/BF00677628
[2] Kondrashov, V.I., Shitova, L.A., Litvinov, V.A. et al. Characteristics of Cutting Parameters and Their Effect on the Glass Edge Quality. Glass and Ceramics 58, 303–305 (2001). https://doi.org/10.1023/A:1013926908241
[3] Sarkisov, P.D., Smirnov, M.I., Spiridonov, Y.A. et al. Effect of residual stresses in float-glass on cutting quality. Glass Ceram 69, 149–152 (2012). https://doi.org/10.1007/s10717-012-9434-0
[4] Lindqvist, M. Structural glass strength prediction based on edge flaw characterization. EPFL, 2013..
[5] Jung, J. W.; Jeon, J. W.; Kim, Y. C.. Automation of glass cutting process for touch screen panel. In: IECON 2016-42nd Annual Conference of the IEEE Industrial Electronics Society. IEEE, 2016. S. 60-65.
[6] Akiyama, Y., et al. Scribing characteristics of glass plate with ground PCD scribing wheel. International Journal of Automation Technology, 2018, 12. Jg., Nr. 5, S. 760-766.
[7] Li, X., et al. The influence of different cutting parameters on the glass edge quality. In: E3S Web of Conferences. EDP Sciences, 2020. S. 03011.
[8] Müller-Braun, S., et al. Cut edge of annealed float glass: crack system and possibilities to increase the edge strength by adjusting the cutting process. Glass Structures & Engineering, 2020, 5. Jg., S. 3-25.
[9] Li, W., et al. Dimethicone-aided laser cutting of solar rolled glass. Frontiers of Mechanical Engineering, 2021, 16. Jg., S. 111-121.
[10] Yang, J., et al. A simple structure laser threefocus scheme for thick glass separation. AIP Advances, 2021, 11. Jg., Nr. 11, S. 115001.
[11] Drass, M., et al. Semantic segmentation with deep learning: detection of cracks at the cut edge of glass. Glass Structures & Engineering, 2021, 6. Jg., Nr. 1, S. 21-37.
[12] The Fletcher-Terry Company LLC. The principles of glass cutting. Farmington: s.n., 2010.