Authors: Mohammed Hassen, Pedro de la Barra, Sagar Oke, Mauro Overend, Marcel Bilow & Alessandra Luna-Navarro
Source: Glass Structures & Engineering, Volume 9, Issue 2, (2024)
DOI: https://doi.org/10.1007/s40940-024-00280-1
Abstract
The performance of the building envelope is crucial for minimizing operational carbon emissions of buildings and maintaining indoor comfort. Contemporary building envelopes, such as engineered glazed façades, achieve high performance levels but often add a significant amount of embodied carbon. There is therefore an incentive to reduce the thickness of the glass panels, but the minimum thickness possible is often not governed by strength or manufacturing limits but rather by the deflection (serviceability) limits. Despite objective criteria guiding serviceability limits, user acceptance of deformation remains unexplored, leading to conservative designs. This paper introduces a novel method for measuring user satisfaction with glass deformations, aiming to establish acceptance thresholds comparable to objective criteria. The study involves a novel experimental campaign to assess volunteers' levels of perception and acceptance of various glass deformations. The glass was deformed using a bespoke electro-pneumatic system at levels corresponding to below, above, and at the current serviceability limit.
The results demonstrate the feasibility of measuring human responses to deformations in the glazing and provide essential data for setting serviceability limits. The experiments and corresponding user satisfaction feedback indicate that the current serviceability limit of L/50, may be relaxed, thereby presenting opportunities for material efficiency, such as the adoption of thinner glass in facades. The methodology effectively captures human responses, revealing that changes in reflection were the primary reason for the perception of movement; leading to a higher perception of glazing movement and a lower acceptance at night. Overall, participants felt safe regardless of their prior knowledge on glass properties, and providing this information to participants did not improve acceptance, which was already sufficiently high. The findings from this research fill an important knowledge gap in understanding user acceptance of glass deformations, crucial for comprehensive user satisfaction assessments and evidence-based reductions in glazing thickness.
1 Introduction
Glazing and façade technologies in buildings are responsible for 10–30% of total embodied carbon of the building (Hartwell et al. 2021). There are several strategies that could be implemented to reduce the carbon impact of glazing in buildings and consequently mitigate the impact of buildings on climate change (Coult and Hartwell 2024; Hartwell et al. 2023). One of the strategies is material efficiency by leaner façade designs and reduction of glazing thickness (Damen et al. 2022). In this regard every 1 mm reduction in glass thickness could save 3 kgCO2eq/m2. Glazing thickness, especially large area glazing commonly found in contemporary glazed curtain walls, is currently governed by serviceability limits. The serviceability limit state defines the functional performance and behaviour of the structure under load. It includes considerations such as deflection, vibration, motion perception and corrosion, addressing the service requirements of a structure or its elements under applied loads (Griffin 2016).
Various national and international standards for the design of glass in building (ASTM E1300: Standard Practice for Determining Load Resistance of Glass in Buildings 2016; Building department of Hong Kong 2018; CEN/TS 19100-2 Design of Glass Structures—Part 2: Design of out of Plane Loaded Glass Components 2021) provide serviceability limits in the form of maximum out-of-plane deflection. The most comprehensive guideline in this regards are provided in the European guideline CEN/TS 19100-2 (2021), where two serviceability levels are provided: (i) deflections that affect aesthetics only and (ii) deflections that also affect integrity, functionality or durability. According to this standard, deflections at the centre of IGUs should be limited to L/50, where L is the length of the shorter edge.
Glazing in façade applications must meet several performance criteria, such as: strength safety and stability, durability, optical performance, thermal performance, acoustic performance, and overall user satisfaction with the glazing deflections. Extensive research has been conducted on many of these criteria, but very few have considered the interaction of strength, stability and overall user satisfaction. Some exceptions are investigations on the onset of visual distortions before the strength of glass is exceeded (Datsiou and Overend 2016; Quaglini et al. 2020). Some other relevant studies that have investigated the effect of reduced glass thickness on durability, include the works by Bedon and Amadio (2020), Besserud et al. (2012) and Respondek (2018), which offer useful insights through reliable numerical, analytical, and experimental assessment methods. Respondek (2018) has specifically examined the influence of reduced glass thickness on thermal performance.
In the context of optical performance, papers addressing cold bending distortion, such as those by Datsiou and Overend (2016), Galuppi and Royer-Carfagni (2015) and Quaglini et al. (2020), consider the limit outlined in EN 12150-1:2000 (Glass in Building—Thermally Toughened Soda Lime Silicate Safety Glass—Part 1: Definition and Description 2000) as an acceptable threshold. More importantly, there appears to be no published research on the acceptability of these limits based on human perception of distortions, deflections and deformations of the glass. It is noteworthy that there is a lack of specific literature addressing acoustics and user comfort concerning serviceability limits. The serviceability of a building structure directly impacts the comfort of its users, but there are no studies that have assessed human response and acceptance of deflections or deformation.
Beyond research on glass, the field of human–structure interaction is developing especially in vibration serviceability, for instance to model and predict the interaction between pedestrians and structures. Several studies investigated human-structure interaction for modelling with higher accuracy the load from people on structure (Ahmadi et al. 2018; Colmenares et al. 2023; Lucà et al. 2022). Several studies have also considered the influence of movements or vibrations on human comfort or acceptability (Griffin 2016; Harris et al. 1962), either by considering existing guidelines from standards (Yang and Ning 2023) or by conducting tests with human volunteers, for instance as performed for pedestrian bridges (Lu et al. 2022), vibrations induced by rapid transit lines in residential buildings (Wong-McSweeney et al. 2016), human response to blast vibration (Zhang et al. 2023) or wind-induced vibration in tall buildings by means of virtual reality (Heshmati et al. 2020).
However, human perception of glass may differ from that of traditional structural materials, as it is usually perceived as a fragile and potentially dangerous material (Honfi and Overend 2013). There is a common perception that structures should be rigid, and any visible or perceptible deformation is seen as a sign of potential failure or, at the very least, an unsafe condition. Awareness of static deflection relies on visual cues, and a negative response often follows if the deformation is noticeable to the eye (Galambos et al. 1973).
The present study aims to present a novel experimental setup for evaluating human perception and acceptance of glazing deflection in glazed facade beyond current serviceability limits. The aim is to provide new evidence on human acceptance limits of glazing deflection that can support the design of thinner glazing and leaner façade design. To this aim, experiments with human participants are conducted to capture their perception and acceptance of façade glazing deflection in a systematic manner in terms of optical performance and related safety perception.
2 Methodology
2.1 Experimental procedure and overall approach to capture human response to glazing deflections
An experimental campaign with human participants was conducted in May 2024 to capture user perception and acceptance of glazing deflections. The experiment was approved by the Human Research Ethics Committee of TU Delft and granted ethical approval. A total of 38 participants were recruited for the experiments and responses from the questionnaires were collected via the Qualtrics. Participants age range between 21 and 39 years, consisting of 24 male and 14 female.
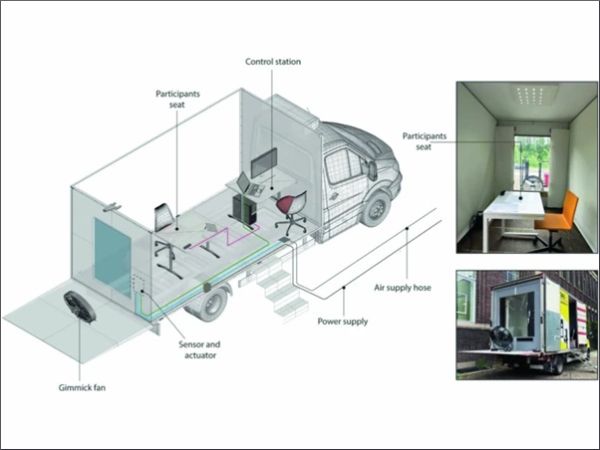
The experiment was conducted in a mobile laboratory at TU Delft, known as “the Lightvan”, shown in Fig. 1. Figure 1a shows a detail plan of the experimental setup.
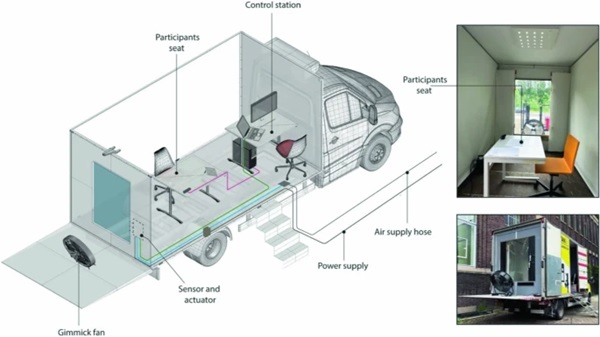
The experiment was designed as a repeated measured test to evaluate the influence of glazing deflection on participants self-reported perception and acceptance. Conversely, the impact of time of the day and previous knowledge was assessed by conducting between-subjects experiments. Participants were randomly exposed to three levels of centre-of-glass deflection, either at day or at night conditions. In addition, knowledge on the safety of the glazing and the impact of material reduction on sustainability was provided to approximately half of the participants (detail numbers are reported in Table 1). The centre of glass deflection was controlled during the experiment by varying the air pressure in the cavity by means of a bespoke setup, which is described in Sect. 2.2. However, a dummy fan was also placed outside the window and activated during the experiments to mimic the presence of wind in front of the façade.
Table 1 Description of the experimental scenario, with indication of time of the day, number of participants and if knowledge was provided on the safety of the glazing setup - Full size table
To reduce any potential bias from knowledge of the purpose of the experiment, participants were informed that the purpose of the experiments was to test the performance of the glazing unit under the wind load induced by the fan. The laboratory was south oriented and shaded by the surrounding buildings, thereby ensuring that the participants were never exposed to direct solar radiation. The indoor artificial lights were kept switched on during the whole experimental sessions, both during the day and the night. The overall scenarios and corresponding number of participants are described in Table 1.
Figure 2 shows the overall experimental procedure. At the start, participants were asked to sit at the desk to familiarise with the environment for approximately 5 min. During the familiarization time, participants were asked to fill in the consent form and the first questionnaire. This questionnaire contained questions regarding demographics, eyesight characteristics, personality, attitude towards sustainability, overall acoustic and thermal satisfaction, satisfaction with outdoor view, and self-reported sensitivity to surrounding movement while working. Each participant was then exposed to three different levels of deflection in a randomised order, each lasting 4 min. During these 4 min, the glazing did not deflect during the first and last minute. To mask the noise of the pneumatic system, participants were also provided with noise cancelling headset, while the noise of the setup was kept constant even when the air pump was not activated to minimise any potential bias.
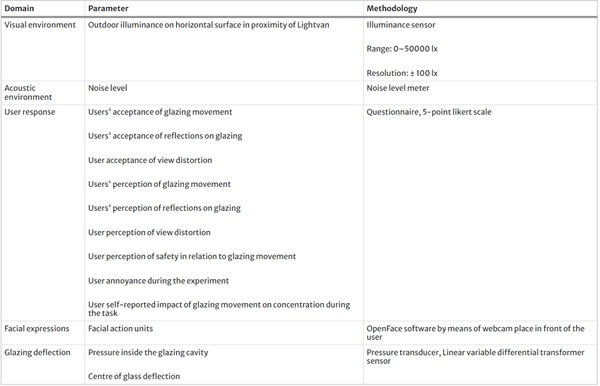
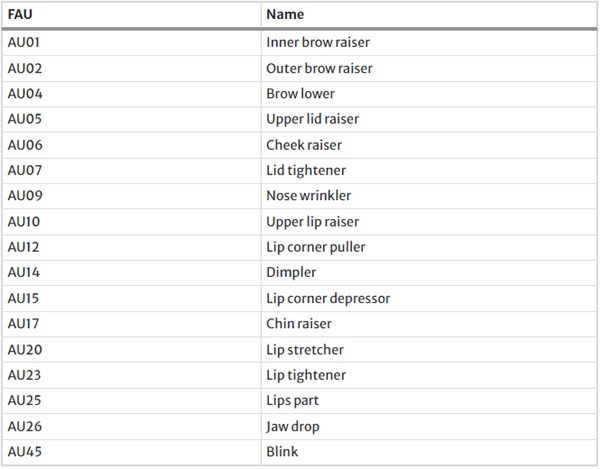
During these test sessions, participants were asked to answer a set of questions based on the outdoor view from their seating position. After each test session, participants were then asked to fill out a questionnaire assessing their perception and acceptance of the deflection. The main parameters are reported in Table 2. Data on users' perception was collected about: (i) movement, (ii) change in reflection, (iii) distortion of their view of the outside and (iv) safety. It is also used to document their annoyance and disturbance to the different deflections tested. The questionnaires are included in the Supplementary Data of this paper. Tests were conducted at night with 20 participants and during daytime with 18 participants, for a total number of 38 participants. In addition, 17 participants out of 38 were then also provided with knowledge on the safety of the glass and on the impact of glazing stiffness on embodied carbon and sustainability. Table 3 describes the facial action units that were monitored during the experiment.

Table 2 Main parameters measured during the experiment and related methodology - Full size table
Table 3 List of facial action units monitored by the OpenFace 2.0 software during the experiment and combination of FAU used to detect expressions related to emotions - Full size table
2.2 Experimental setup for controlling the glazing deflection
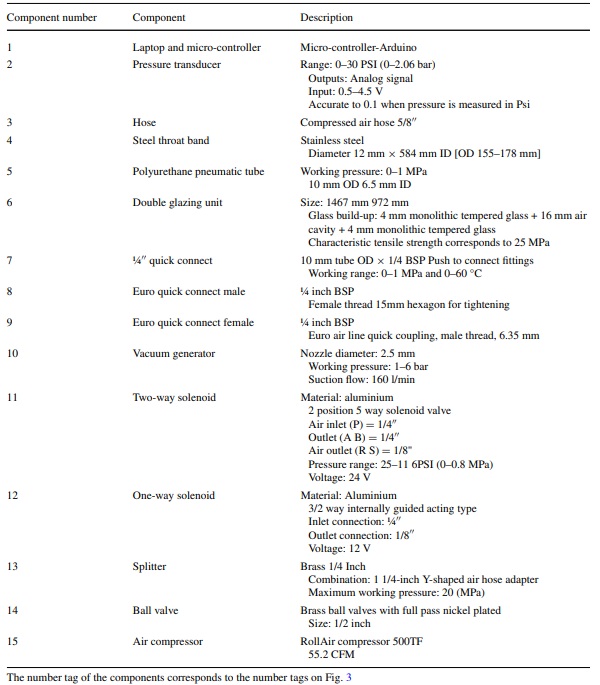
A bespoke pneumatic system was used to create a cyclic deflection of the glass, as shown in Fig. 3. The test rig included a pneumatic system to control the air flow by means of electronically controlled valves and pressure sensors. The micro-controller Arduino (1 in Fig. 3) was used to implement the control strategy for the valve. The pneumatic system is composed of an air pump (15 in in Fig. 3), tubing (5 in in Fig. 3), a solenoid valves (11 and 12 in in Fig. 3) and a ball valve (14 in in Fig. 3). Together, these components work to control the pressure within the glazing cavity, enabling the simulation of wind loads. Table 4 reports information on the specifics of each component.
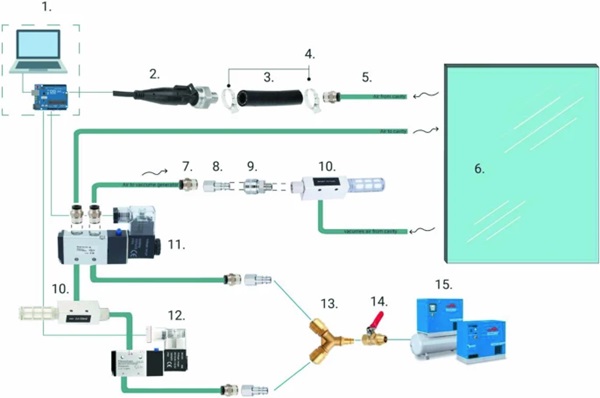
Table 4 Detail description of the pneumatic components used in Fig. 3 - Full size table
The pressure inside the cavity was measured with a pressure transducer of 0–30 PSI (0–2.06 bar) which outputs an analogue signal in the range of 0.5–4.5 V. The glazing consisted of a double-glazing unit (6 in Table 4) of 1.47 m × 0.972 m. A transparent safety film (3M S800) was applied to the inner and outer monolithic glass panes to retain the glass in the event of fracture.
The cavity pressure and the resulting centre of glazing deflection were controlled by opening and closing the solenoid valves. The centre of glass deflections that were investigated in this study were: (i) the serviceability limit from the Eurocode CEN 19100-2, which is L/50 and corresponds for this glazing dimension to 19 mm; (ii) a lower deflection than the serviceability limits, which corresponded to 10 mm (50% less of the serviceability limit); (iii) a higher deflection than the serviceability limit, which corresponded to 23 mm.
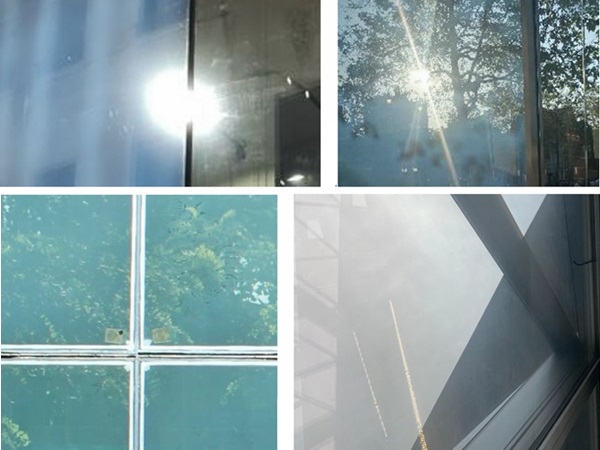
Preliminary tests were conducted in a controlled laboratory setup to evaluate the influence of glazing a static deflection on view distortion. In these tests, it was observed that outdoor view was not perceptibly distorted and, consequently, it was decided to reproduce the wind scenario by deflecting the inner glazing panes in a similar way than the scenario with climatic load. However, the effect on the reflections on the glass surface was clearly visible during the glazing deflection (see Fig. 4). As shown in Figs. 4 and 5 respectively for the night and day conditions, deflections on glazing are visible from indoors at night because of the reflections, and from outdoor during the day because of outdoor reflections. The glazing unit was deflected under a cycling load, ranging from the maximum possible pressure in the cavity per each scenario and the atmospheric pressure. This was decided to include the additional disruption caused by high frequency movements under dynamic wind loading.


2.3 Statistical assessment of data collected
The data collected from Qualtrics was analysed using the statistical software SPSS. After cleaning and structuring the data, descriptive and inferential statistics was used to interpret the results. Levens homogeneity test was first performed, The participants were grouped by time of day (daytime and nighttime) and a linear mixed model analysis was performed to assess the influence of the different levels of deflection on the perception and acceptance of movement, view distortion and change in reflection. The perception of safety was also checked and the effect of knowledge on the perception of safety has been tested.
3 Results
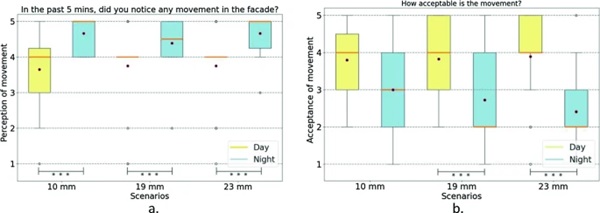
Overall, the movement of the glazing was perceived by all participants both during the day and the night sessions, as shown in Fig. 6a. However, there was a significant difference in participants perception during the day and the night sessions. At night, a larger number of participants perceived a significant movement of the façade. A similar difference between the day and night session was measured in terms of acceptance (Fig. 6b), where participants in the day session deemed the movement of the glazing to be significantly more acceptable than those in the night session. However, almost none of the participants during night sessions perceived the glazing movement above “Totally unacceptable”, even for the largest deflection. Participants acceptance is significantly lower at 23 mm than at 10 mm and 19 mm. In terms of perception of movement, there was no effect of the magnitude of the deflection, since there is no statistical difference between the scenarios with different deflection.
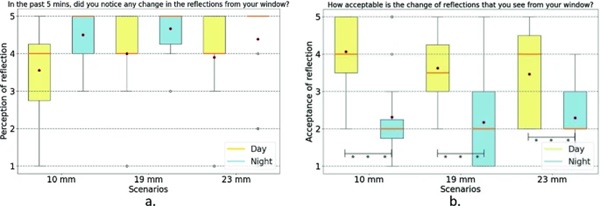
As shown in Fig. 7a, all participants strongly perceived changes in reflections during the deflection of the glazing. Only at 10 mm, did participants report a significantly lower perception of changes in reflections on the glazing (p value < 0.05), but it was still noticed by participants. In terms of acceptance of changes in reflections, Fig. 7b, the acceptability of reflections during the day was much higher than at night, when the level of acceptability were low (mean acceptance close to slightly unacceptable). While during the day, the acceptance decreases with increasing deflection, at night the impact of magnitude of deflection on acceptance is negligible.
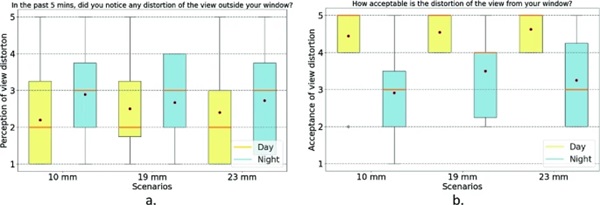
In general participants did not perceive view distortion (Fig. 8a). Consequently, during the day and night the acceptability was on average either “Neither acceptable or non acceptable” or “Perfectly acceptable”.
Participants were also questioned on their perceived safety while the glazing was moving. Figure 9a shows the overall perceived safety. There is no significant difference between scenarios and day/night, except for the largest deflection, where perception of safety was slightly lower at night. However, the perception of safety is generally positive across all scenarios. Previous knowledge had no significant impact on the perception of safety.
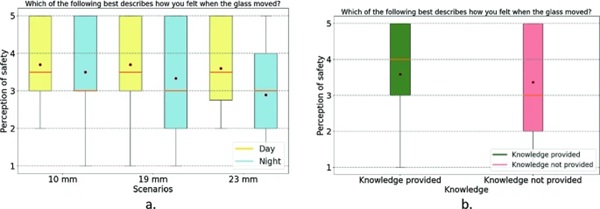
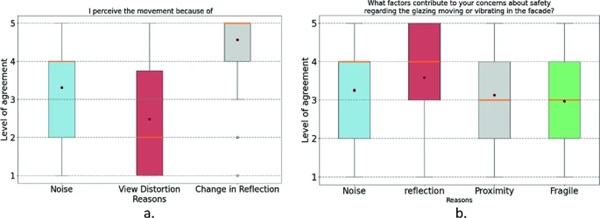
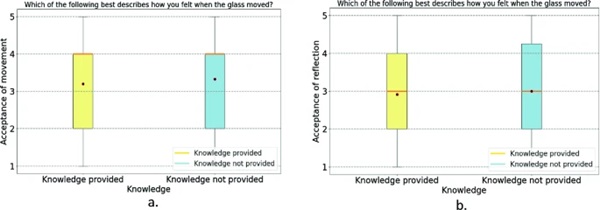
Figure 10 shows the main factors that contributed in user perception of glazing movement. Changes in reflections were the most perceptible and consequently the reason for the perceived loss of safety when glazing is moving. As shown in Fig. 11, previous knowledge did not affect the acceptance of movement or the acceptances of changes in reflection.
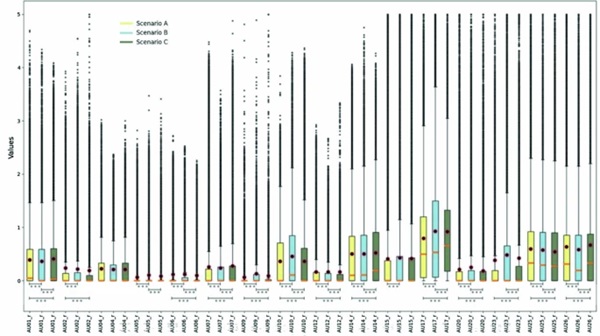
The analysis of facial action units revealed a few significant effects of glazing movement on users facial expressions, indicated by the asterisks in Fig. 12 that shows which scenario were significantly different to each other. However, differences are small and this is consistent with the perceptual results, in particular with the fact that participants felt generally safe when glazing was moving.
4 Conclusion
The overarching findings of this study indicate that it is possible to measure human response to glazing movements, which can in turn provide valuable evidence on human requirements for setting the serviceability limit. The experimental campaign conducted and the resulting user responses to glazing movements suggest there is room for questioning and relaxing existing serviceability limits. This provides opportunities for material efficiency, such as the use of thinner glazing solutions and a reconsideration of user perceptions and expectations of glass stiffness. However, future work is now required to evaluate the impact of higher serviceability limits on other factors, in particular acoustic performance and safety perception when users lean against a glazing.
The proposed methodology effectively captures human responses to glazing movement. Participants noticed glazing movement throughout the experiment, with significantly higher perception during the night, irrespective of the magnitude of the movement. Acceptance of movement during the day is significantly higher than at night, particularly when maximum deflections are tested. However, user acceptance of movement does not decrease when existing serviceability limits are exceeded and generally remains above the "slightly unacceptable" level, similar to deflections within the serviceability limits.
Changes in reflection were the primary reason participants perceived glazing movements, with significantly lower acceptability at night and dependent on the magnitude of movement. This effect could be mitigated by installing anti-reflective coatings or films. Conversely, distortion of outside view had no significant impact. Overall, participants felt safe regardless of their prior knowledge about glass properties, and providing this information did not improve acceptance, which was already sufficiently high.
Future work and limitations include the need to consider the contextual impacts of the study, as it was conducted in a controlled environment with specific conditions. User expectations of glazing performance and environmental quality can vary based on context. For instance, a few participants were students following technical programmes, while the lab’s ground-floor location may influence safety perceptions compared to glazing at height, and expectations of glazing performance in high-end office buildings might differ from those in a laboratory setting. These results are contextual, and generalizing the findings will require testing with larger populations in real office environments with different façade designs.
Additionally, the potential noise from the glazing movement generated in the experiment and the fact participants were wearing noise cancelling headphones, may impact user acceptance and safety perceptions, therefore is recommended future work investigate the impact of sound environment in human perception of safety and acceptance in glazing deflections. The maximum deflection tested was approximately 23 mm; future studies should investigate larger deflection-to-span ratios. Larger deflections, well beyond the above-listed serviceability limits could have been accommodated during the experiment if a tempered glazing would have been tested.
Participants were in relatively small spaces, maintaining a constant distance and orientation towards the façade. Future research should explore the impact of participants’ angle of view and distances from the façade on their perception and acceptance of movement, reflections, and safety. The tasks performed by participants could also affect their perceptions; in this experiment, participants were specifically asked to look through the glazing, but their perception and acceptance might be more positive when focused on other tasks. Finally, human response was only captured from indoors, while outdoor perception of the façade’s aesthetics can also be a significant consideration in enabling larger deflections. Further studies should therefore also assess user perceptions of glazing deflections from outdoors.

