
Authors: S. Karlsson, M. Kozłowski, L. Grund, S.A.K. Andersson, K.C.E. Haller & K. Persson
Source: Construction and Building Materials, Volume 391, Elsevier
DOI: https://doi.org/10.1016/j.conbuildmat.2023.131748
Highlights
- Indentation-induced cracking in small specimens renders realistic glass strengths.
- Nonlinear acoustic method gives a measure of the amount and size of the defects.
- Non-destructive test of the glass strength for small samples (10 × 10 cm2).
- Failure stress vs. normalized defect value (NDV) gives a linear correlation.
Abstract
The present paper describes a method for non-destructive testing of the glass strength. Square 10 × 10 cm2 samples of annealed float glass was inflicted with a controlled defect in the centre of the atmospheric side using Vickers microindentation-induced cracking with a force of 2 N, 5 N and 10 N and compared to an un-indented reference. The samples were non-destructively tested using a nonlinear acoustic wave method resulting in defect values. The average of the defect values was found to linearly correlate to the indentation force in a log–log relationship. The samples were subsequently tested in a ring-on-ring setup that allows for an equibiaxial stress state. The indentation-induced cracking gave practically realistic strength values in the range of 45 to 110 MPa. The individual sample values for failure stress as a function of normalized defect value show linear trends with approximately half of the data within 95% confidence limit. In summary, this study provides an initial proof-of-concept for a non-destructive testing of the strength of glass.
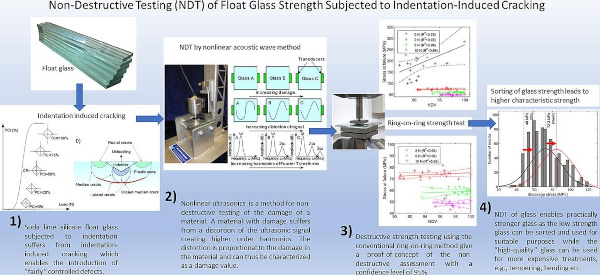
Graphical abstract
1. Introduction
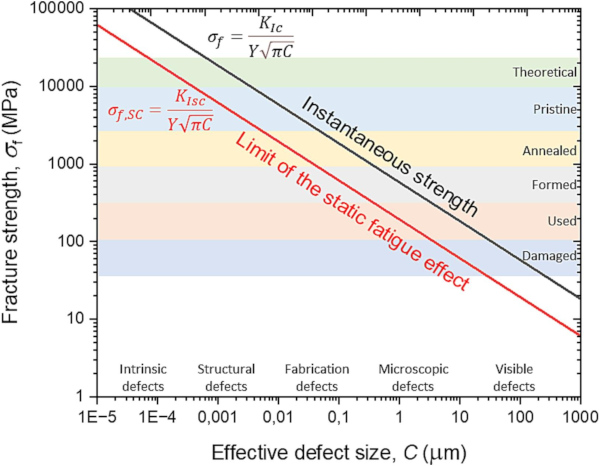
The strength of silicate glass is greatly limited by stress-concentrations at crack tips generating very high stresses when it is under tensile load [1], [2], [3]. Surface cracks, flaws, or defects are inevitably formed during manufacturing, transport, handling, and use of glass products [4], [5]. Without these surface defects, glass would have an intrinsic strength of about 10 GPa [5], [6], this far exceeds many other materials [7]. However, glass typically has a low fracture toughness (KIc) of 0.6–0.8 MPa.m½ [7], which leads to a practical strength of glass that spans over several orders of magnitude [8]that can be exemplified by Fig. 1. Environmental conditions, such as humidity, also influence glass surfaces so that the cracks can grow under sustained load in so-called subcritical crack growth or stress corrosion which may lead to static fatigue (Fig. 1) [9].
The significant variation in strength of glasses requires that extensive safety measures must be employed for glass products [5], especially for glass to be used as a load-bearing material [13]. Destructive strength tests of conventional float glass typically give strength values between 30 and 100 MPa [14], which corresponds to 30–400 µm cracks (KIc = 0.75 MPa.m½). According to EN 16612 (2019), the 5%-fractile bending strength (the so-called characteristic value, Xc) of short-term loaded annealed float glass is 45 MPa, i.e., 5 s or less, and for a longer duration, it is lowered by different proposed factors for load duration. For use in insulating glass units (IGU) in window glazing [15], the design strength (EN 16612) of annealed float glass with polished edges is lowered to 25 MPa for wind gusts (load duration of 5 s or less) while for conventional cavity pressure variations in IGU (8 h load duration), it lowers it to 14.5 MPa (with as-cut edges 14.5 × 0.8 = 11.6 MPa). In most cases, this leads to an underestimation of the glass strength, which makes the use of glass unnecessary thick.
The architectural and structural use of glass [16] is increasing [17]. Architectural glass is essential for letting natural sunlight into buildings as humans in general spend more than 80–90% of the time indoors in developed countries [18], [19]. Thus, from both safety and environmental viewpoints, understanding glass strength is of major importance, which is currently impossible without extensive destructive experimental testing [20]. Non-destructive testing (NDT) of glass, on the other hand, is a natural route towards sustainable development [21], which also will likely have a significant impact on the glass industry in the future. Some possible applications for NDT of glass strength are listed below.
- Optimizing glass manufacturing methods by tuning process parameters and minimizing the number of defects, e.g., reducing number of glass panels with manufacturing inhomogeneities such as bubbles, stones [22] or even perhaps NiS particles which pose a significant problem for tempered safety glass [23].
- Quality sorting, where low-strength glass can be sorted for less critical applications or high-strength glass can be used for more expensive processing (e.g., bending, tempering, lamination etc.). Thereby, Xc of the glass with higher quality can be statistically improved. This can lead to that glass can be used in more demanding applications and/or that thinner glass can be used
- Quality-check after installation. In fact, defects may result from improper transporting, handling, or assembly on site.
- Quality-check in long-term usage of glass, detecting new defects from wear, weathering [24], vandalism, and sub-critical crack growth [25].
- Quality-check for reuse of glass in a circular economy, where old flat glass can be quality checked for potential reuse, which has a considerable environmental gain compared to recycling [26].
The above-mentioned applications are probably not exhaustive, but they describe the motivations for developing an NDT assessment method for glass strength. It is worth emphasizing that NDT is also applicable for other glass products than flat glass, e.g., container glass [5], optical glass [27] and household glasses [28].
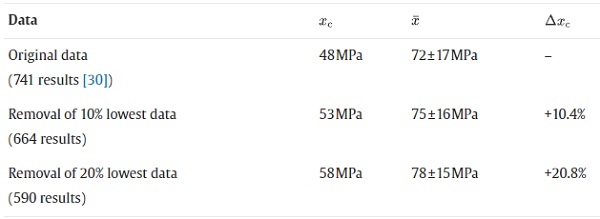
Currently, there is no NDT methodology for glass. In fact, that supplied glass meets the Xc specified in standards is based on statistics and conservative design safety measures. Optical methods are typically used in the production to sort out glass with evident defects [29]. However, strength grading defects are in the micron-size and thus challenging to detect with optical methods. Fig. 2 reports the results of 741 tests on 6 mm annealed glass samples tested in a double-ring setup according to EN 1288–2 giving Xc of 48 MPa and a mean value (X¯) of 72.3 MPa [30]. To show the potential of NDT method and its impact on design strength, a simulation of the Xc was performed. From the population of the results presented in Fig. 2 10% and 20% of the results with the lowest σf were filtered out and the resulting Xc and X¯ were calculated. Table 1 presents the summary of the simulation. Removal of 10% and 20% results in the lowest value of σf using NDT methodology, which may increase the Xc by 10.4% and 20.8%, respectively.
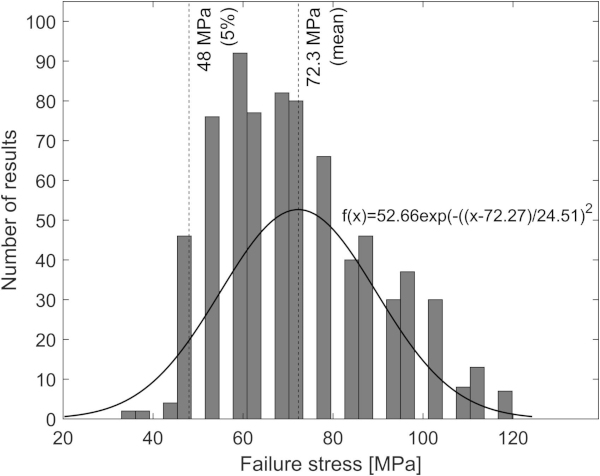
Table 1. Results of simulation by removal of 10% and 20% of the lowest data in Fig. 2 where c is the characteristic glass strength, X¯ the mean and ΔXc is the change of Xc in relation to the original results.
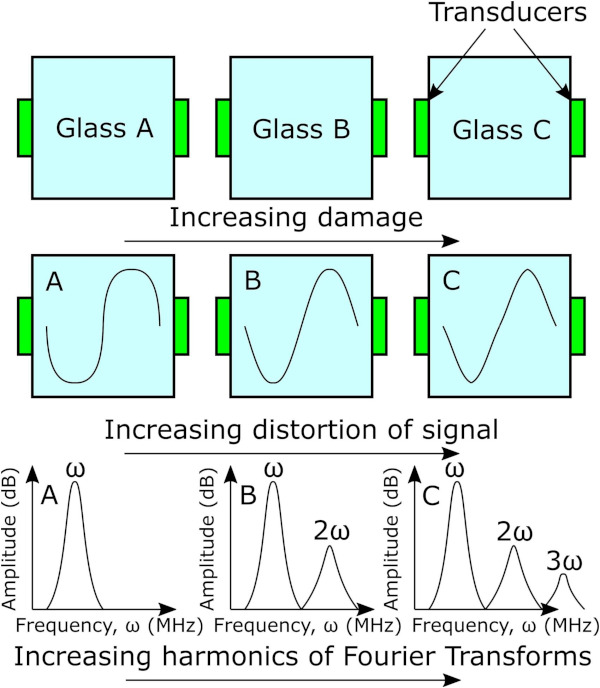
Nonlinear acoustic wave (NAW) techniques can be used to detect defects in materials [31] and have typically previously been used for evaluating cracks in rocks [32], steel [33], carbon-fibre reinforced plastic [34] and concrete [35]. In these methods, acoustic waves are transmitted through an object and nonlinear effects, caused by the defects in the material, are analysed from the signal obtained at the receiver [36], [37], [38], [39]. Nonlinear effects have been observed experimentally for various types of defects, e.g., cracks, disbondings, delaminations, and other microstructural material defects [36]. In principle, tapping on a material with a defect creates a distortion of the sound that sometimes even can be heard by a human ear. The reason for this is that nonlinearities of the sound waves are produced at cracks or defects, see Fig. 3. These nonlinearities are higher-order harmonic frequencies and are proportional to the number of defects or damage in the material. Using this correlation, the material's collected “defect value” can be calculated, which is a nominal value and easy to interpret.
For glass, ultrasonic acoustic methods have previously been used for showing the interaction between larger cracks/defects in glass and the potential for NDT of glass [40], [41], [42], [43], [44]. The size of surface flaws determining the strength of glass is in the range of 10 to 1000 µm, cf., Fig. 1. Therefore have we in the current paper investigated non-destructive and destructive testing of float glass strength using NAW method [45] and ring-on-ring strength test [14] on samples that were subjected to strength variability by indentation-induced cracking, see Fig. 4, as inspired by the study of Glaesemann et al. [46]. The purpose and novelty of the paper is to establish a clear correlation between defect value and the strength of glass, thus providing an experimental proof-of-concept for NDT of glass strength. The paper is an expansion of a previously published technical report [19].
2. Material and methods
2.1. Materials and specimens
The glass used in this study was a regular soda-lime silicate float glass [48], which is the most commonly applied glass type in the building industry [16]. Annealed float glass samples were cut by industrial diamond scribing to the dimensions 4 × 100 × 100 mm3. The limits of the microindenter equipment, see section 2.2, set the sample dimension.
2.2. Microindenter imprints
A CSM Instruments Micro-combi tester (MCT) with a Vickers indenter tip was used to make indentation imprints in each sample's centre, see Fig. S1a in the Supplementary Materials. The indentation forces (Pi) used for the indents were Pi = 0.5 N, 2 N, 5 N and 10 N. An unindented reference, hereinafter referred to as Pi = 0 N, was also added as a sample serie. The microindentations were consistently made on the atmospheric side of the samples with an acquisition rate of 10 Hz in a linear loading scheme with loading/unloading of 2 × Pi per min and the holding time at Pi,max was 15 s. Furthermore, the indentations had the following settings: contact force 30 mN, contact stiffness threshold 25000 µN/µm, approach speed was 8 µm/min, and retract speed 16.6 µm/min. At least 20 samples for each force (Pi) were made.
2.3. Nonlinear acoustic wave (NAW) measurements
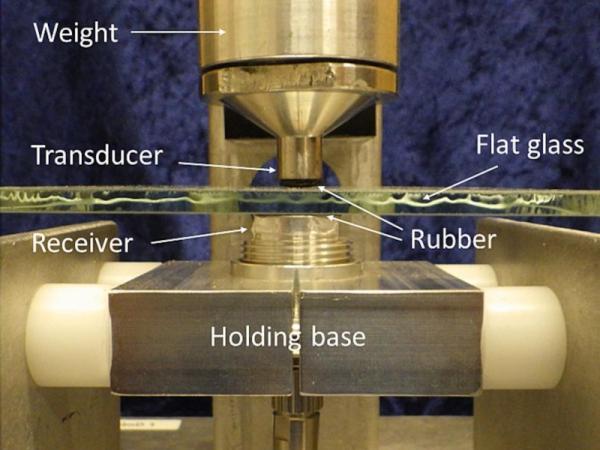
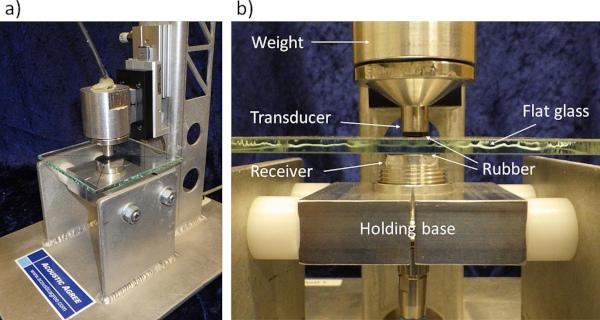
The NAW methodology is described in [45], however, the applied details of the methodology is a trade-secret of Acoustic Agree AB. The glass samples were tested in a custom-made rig that allowed all samples to be examined in the same manner, see Fig. 5. The rig consisted of a base manufactured in aluminium holding the receiver and a transducer mounted above. The sample was placed between the receiver and a transducer and to ensure that no further defects were made to the glass, a 1 mm thick rubber foil was placed in between the sensors and the sample. A small force was applied to the sample by a weight on the transducer to ensure the same contact conditions between the sample and the sensors. Since the measurements were focused on examining the central part of the samples (with indents), the amplitudes of the acoustic waves were kept small to inspect only a region of the samples where indentations were made, thus minimizing the influence from the cut edges. The sensors used are a design from Acoustic Agree AB based on piezoceramic elements and includes signal conditioning. The transducer is based on a hard piezo material and the receiver on a soft piezo material. The NAW measurements are quick, in the range of seconds.
From each sample, a corresponding defect value was recorded, and the defect values were then inversely normalized so that the normalized defect value (NDV) 100 is the reference glass (i.e., 0 N), see Table 2 in section 3.
2.4. Ring-on-ring test
2.4.1. Ring-on-ring test fixture
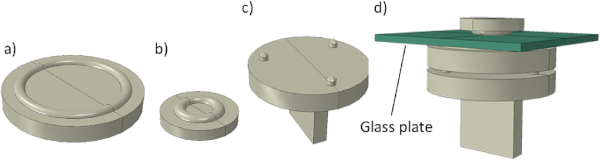
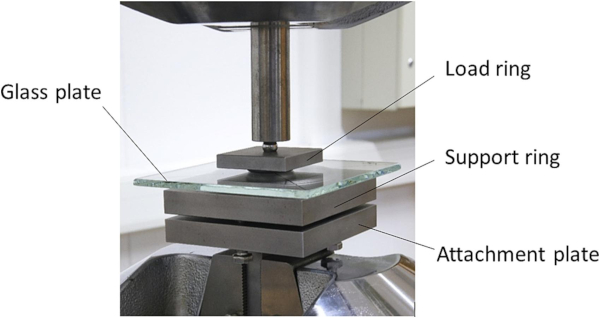
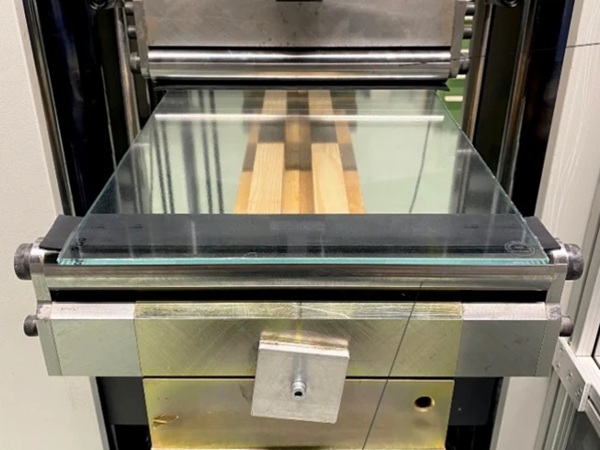
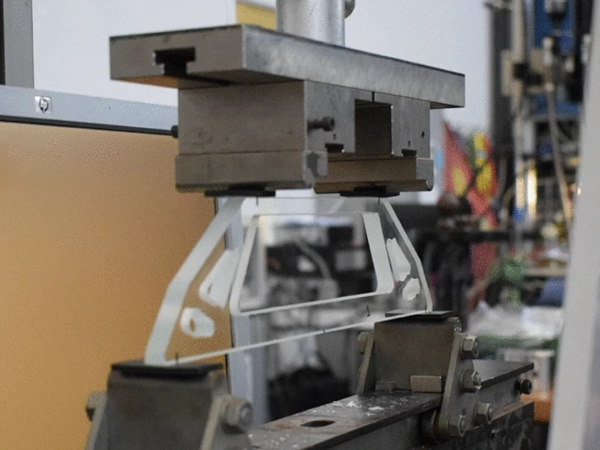
Ring-on-ring tests were performed to facilitate a correlation between indentation depth, defect value and the strength of glass. A ring-on-ring test, a standardized method to determine the strength of glass (EN 1288–5 and ASTM C199-19), consists of two steel rings with the glass placed between them. The fixture consisted of a larger support ring with a diameter of 60 mm and a smaller load ring with a diameter of 20 mm, see Fig. 6. An attachment plate clamped in the testing machine was also made on which the support ring rested on three support screws to ensure that the force was applied axially. A final assembled test setup is shown in Fig. 6d.
2.4.2. Finite element simulation of ring-on-ring setup
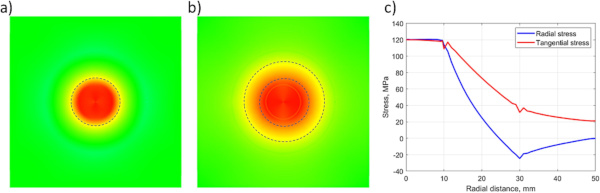
The ring-on-ring test was chosen for two reasons; it creates a homogeneous biaxial stress field inside the load ring, and the sample’s edges are limitedly stressed. The radial (σr) and tangential (σt) stresses are essentially equal inside the load ring (σr and σt would become exactly equal if the glass sample would be circular or very large compared to the rings) [49], [50], [51]. The size of the rings was determined by a quasi-static finite element (FE) analysis of the test setup to ensure that the distribution of σr and σt would become equal in the test setup. In the FE-analyses the steel parts were made circular in their outer shape but the final manufactured parts, however, were made quadratic. To reveal details of the stress distribution of the parts, as shown in Fig. 6, a fine mesh with eight node continuum solid shell elements having a size of 0.5 mm at the vicinity of the rings and about 1 mm closer to the edges was used. The modulus of elasticity (E) and Poisson’s ratio (ν) of the glass were 72 GPa and 0.21. For the steel parts they were 210 GPa and 0.3, respectively. The contact between the steel parts and the glass was simulated with a Coulomb friction coefficient of 0.1. The load was applied in displacement control at the centre of the load ring. In Fig. 7, the resulting stress distribution in the glass sample from the FE-analysis is shown.
2.4.3. Ring-on-ring strength measurements
The tests were performed in an MTS 820 hydraulic testing machine. A stress rate of 2 MPa/s in the testing was aimed for, which was realized by applying a displacement rate of 0.4 mm/s. Force and displacement were recorded at 100 Hz. The radial (σr) and tangential (σt) stresses developed in the glass in the ring-on-ring test can be calculated from the following formula:
![]()
2.5. Linear fracture mechanics and crack depths
Linear fracture mechanics theory was applied to the destructive measurement data for assessing the initial crack depths. Following the work of Griffith [52] and Irwin [53] that prescribes the basis for the linear elastic fracture mechanics (LEFM) theory. The strength of a material in the vicinity of a flaw can without any subcritical crack growth be written
![]()
where KIc (MPa·m1/2) is the critical stress intensity factor and YI (–) is the geometric shape factor in mode I, σf (MPa) is the tensile fracture stress normal to the plane of the flaw and C (m) the flaw depth [3], [4]. Assuming a semi-elliptical crack in the glass the geometric shape factor is set to be Y = 0.73. Typical values of KIc for glass are between 0.6 and 0.8 (MPa m1/2) and here, we have chosen to use KIc = 0.75 (MPa m1/2) [10]. By rearranging Eq. (2) we can write the depth of the crack, C, as a function of the failure stress, σf,
![]()
which can be used for evaluating average crack depths at failure in the untreated glass and from the indentation. During testing, however, subcritical crack growth, also called stress corrosion, occurred in the glass samples [9]. The size of the cracks at failure was therefore larger than the initial sizes as created by the indentation process. The sizes of the initial cracks in the glass samples before testing may be determined by also accounting for subcritical crack growth. A simple model for the velocity of the subcritical crack growth, found by empirical tests [54], can from [55] be written
![]()
where ν (m/s) is the crack velocity, v0 (m/s) is the crack velocity when KI = KIc and n (–) is the stress corrosion parameter that often is set to 16 [56]. In [4] the crack velocity v0 is suggested to be 0.01 mm/s for laboratory conditions. Since v=dC/dt, where C is the flaw depth and t (s) is the time, the differential equation for the flaw depth can be written as
![]()
that, as shown in [57], by integration results in
![]()
where Cc0 is the initial flaw depth before stress testing and Cc is the critical flaw depth at failure which occurs at time tf when the stress is σf. Performing the integration, noting that n is large (i.e., n≜16) and assuming that Cc(tf)≫Cc0 the expression for the initial flaw depth become
![]()
3. Results
3.1. Indenter imprints
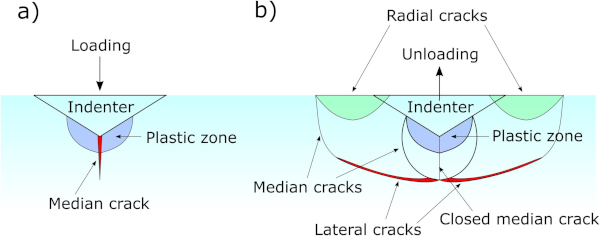
A sharp indenter pressed into a glass leads to elastic deformation, plastic deformation (governed by shear flow and densification) and ultimately crack formation [58]. The different cracks, see Fig. 4, are formed upon unloading apart from median cracks that are formed upon loading. Radial and median cracks are the most critical cracks as they degrade the strength of the glass, and these are the preferential cracks upon indentation in soda lime silicate glasses [59]. Indentation cracking in glass is, in fact, a good method to study contact-induced defects of glass and thus also practical handling of glass [60]. The microindentation, described in section 2.2, gave permanent imprints in the glass samples. Some selected photographs of the imprints are shown in Table S1 in the Supplementary Materials. The indentation penetration depths (Pd) are defined by the depths at Pi,max. As the indenter force is retracted, the elastic deformation is reversed, and the remainder of the imprint was {∼0.6 × Pd, ∼0.5 × Pd, ∼0.5 × Pd, ∼ 0.4 × Pd} for Pi = {0.5, 1, 5, 10}, cf., Pd in Table S1.
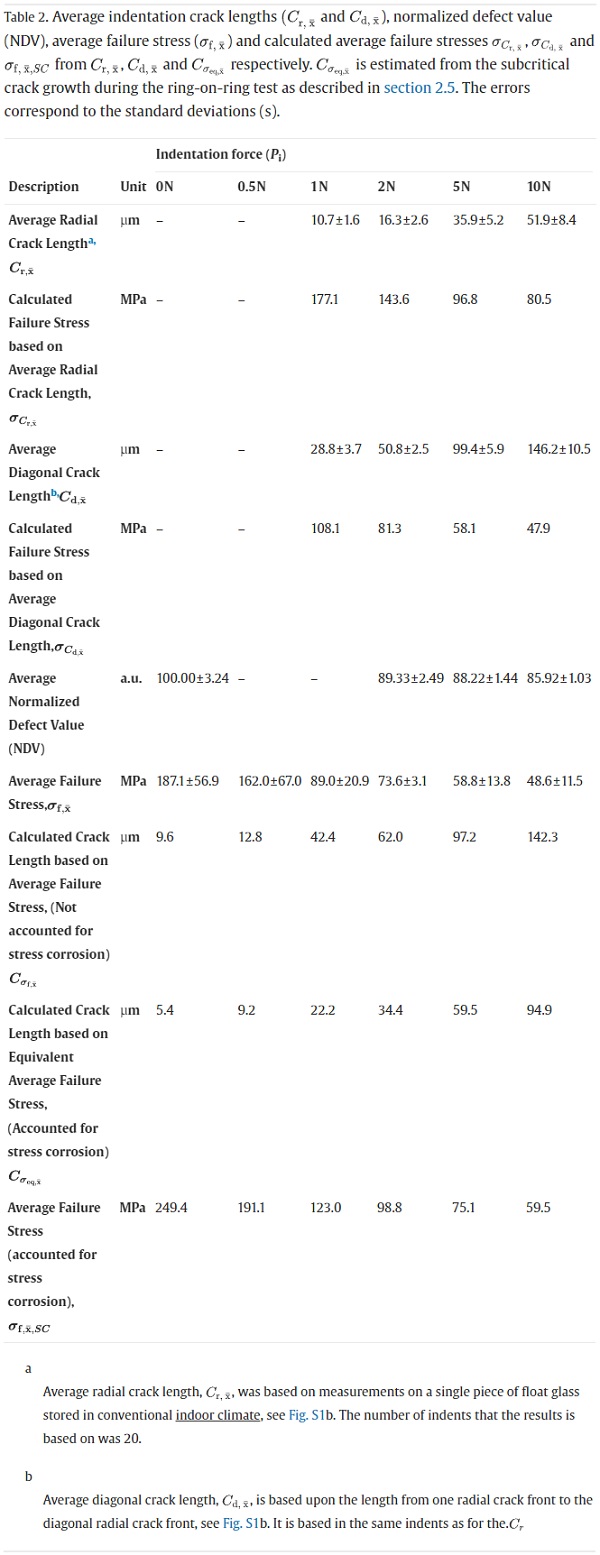
Thus, the energy dissipation of the indenter by elastic deformation goes up to a certain limit, however, plastic deformation and cracking can dissipate the energy in a broader range [60]. For Pi = 1 N, 2 N, 5 N and 10 N there were visible cracks as can be seen in the light microscope images in Table S1. For the Pi = 0.5 N, there were no cracks, but we know this depends on several parameters e.g., the morphology of the glass [61], its storage conditions [62], sharpness of indenter tip [63] etc. The results are consistent with previous results for as-received float glass as characterized by the crack resistance method [64], where it was found that the air-side of annealed float glass has a crack resistance (CR) of ∼ 0.7 N (meaning 50% probability of crack initiation of radial cracks). Table 2 shows the average crack lengths as measured for radial cracks and the diagonal from radial crack front to the diagonally opposite radial crack, see Fig. S1b. Table 2 also shows the calculated σf using Eq. (2) and the average crack lengths which range from 177.1 MPa (1 N) to 80.5 MPa for 10 N and 108.1 MPa (1 N) to 47.9 MPa (10 N) for average radial and average diagonal crack length, respectively. The indentation results in relation to other results will be discussed in section 3.4.
3.2. NAW-experiments
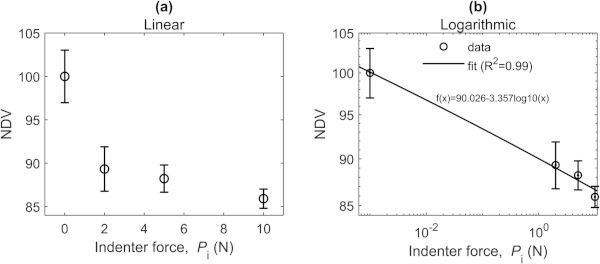
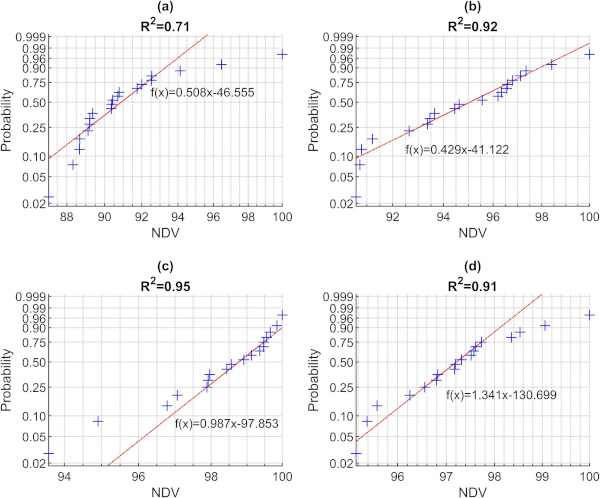
NAW inspection, using the setup described in section 2.3, shows a clear correlation between NDV and Pi. Fig. 9 shows the average NDV as a function of a) Pi and in b) the logarithmic Pi. The latter results in a good linear fit with R2 = 0.99. The most significant difference in nonlinear response is between 0 N and 2 N. The extra added cracking, ranging from 2 N to 10 N, produces a more consistent decreasing response; the relative standard variation is reduced to half the value for more defected samples. The Weibull probability plots of the individual defect values are shown in Fig. 10. In general, the Weibull fits are not at all perfect (R2 = 0.71–0.95) but relatively good for Fig. 10 b), c) and d) (R2 = 0.91–0.95), while for Fig. 10 a) only ∼ 60% of the samples are found to be relatively good fitted.
3.3. Ring-on ring tests
Ring-on-ring tests were performed using the set-up described in section 2.4. The resulting average force at failure (Pf,x¯), and stress (δf,x¯), including standard deviations as a function of Pi are shown in Fig. 11 a) and b), respectively. Fig. 11 c) presents the same data in a logarithmic fit and in comparison, with the NAW experiments (see Fig. 9), a slightly less good linear fit was achieved (R2 = 0.88).
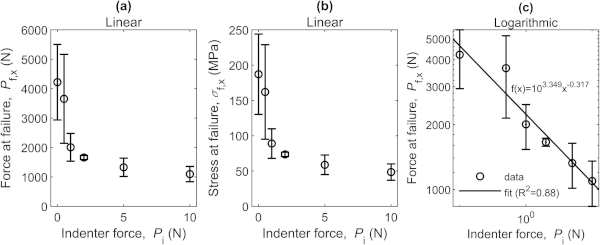
Fig. 12 presents histograms and normal density function of δf and Fig. 13 shows the Weibull probability plots for different Pi. The histograms in Fig. 12 show that a), b) and c) are not perfectly fitted by a normal density function but d) shows a good fit. The Xc, as given in Fig. 11, was found to range from 101.6 MPa for 0 N to 43.7 MPa for 10 N. The complete test results from the detailed ring-on-ring tests are shown in Fig. S2 in the Supplementary Materials. The Weibull probability plots show, like the NDV (see Fig. 10), that the linear fits are not perfect (R2 = 0.84–0.94) and in particular for the samples with the highest strength and those with lowest strength.
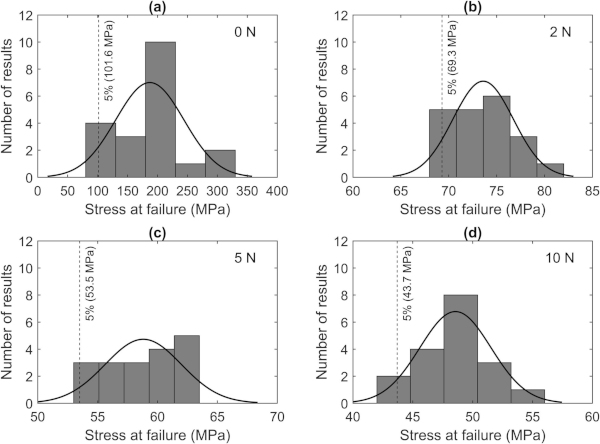
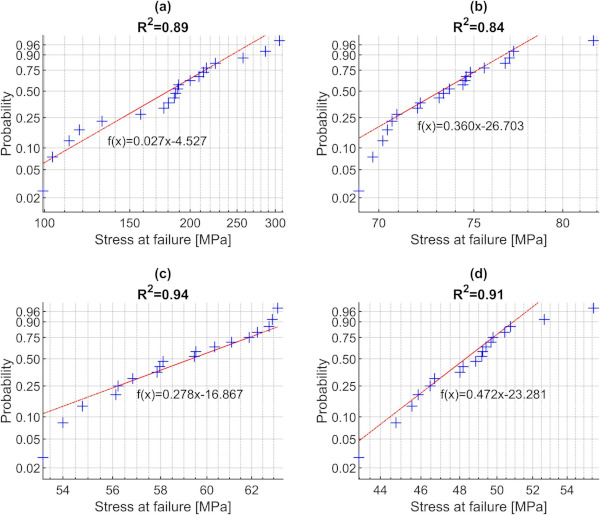
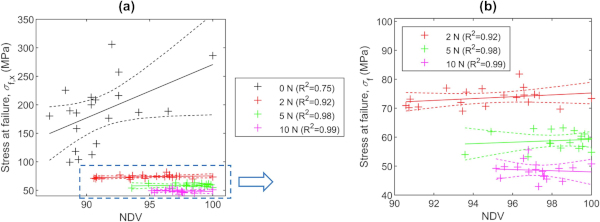
Fig. 14 presents a summary of the performed studies; it shows the relation between all individual values of δf achieved from ring-on-ring experiments as a function of the recorded NDV values for the same test series. In the figure, linear regression curves together with 95% confidence intervals are presented. The largest scatter of results was found for the samples without indentations (0 N, R2 = 0.75), while a significantly better correlation was found for the samples with indenter-induced defects (from 2 to 10 N, R2 = 0.92–0.99). The observation is confirmed by the increasing R2-values of the linear fits with increasing indentation force. The results prove that the NDT method presented in the paper can be used to detect defects in glass.
3.4. Discussion
In practice, glass is having a strength distribution, see Fig. 2, that stretches from ca. 35 MPa to 120 MPa for annealed as-received glass [30]. To artificially simulate defects in glass, there are many different approaches, e.g., weathering [20], sharp particles [65], [66], sharp contact inflicted by indentation [46], [67], sharp contact scratching [68], [69] or laser [70]. In the current paper we have chosen sharp contact-induced defects inflicted by microindentation which according to the resulting average failure stress (δf,x¯) in the ring-on-ring test give similar to real-life defects, see Table 2 and Fig. 2.
Using Eq. (3), the crack lengths (Cδf,x¯) from the δf,x¯ could be calculated and ranges from 9.6 to 142.5 µm for 0 N to 10 N, respectively. We compare this with the indentation crack lengths that were measured in two ways i) average radial crack lengths (Cr,x¯) and ii) average diagonal crack lengths (Cd,x¯), see Table 2, the latter was to get a measure of the median crack length (see Fig. 4). Using Eq. (3) it was possible to estimate the corresponding failure strengths δCr,x¯ and δCd,x¯ for i) Cr,x¯ and ii) Cd,x¯. The results show that the δCr,x¯ and δCd,x¯ do not match with the corresponding δf,x¯ from the ring-on-ring tests. The failure strengths when taking the stress corrosion effect into considerations, δf,x¯,SC, does not match the δCr,x¯ but is linearly correlated to the value of δCd,x¯.
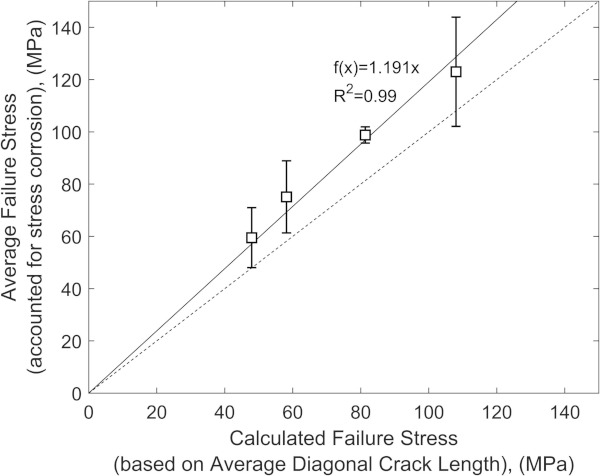
We illustrate the correlation in Fig. 15 where we show δCd,x¯ vs. δf,x¯,SC with the corresponding standard deviation from δf,x¯ to illustrate that the deviation from linearity is within the statistical error. It must be noted that the storing conditions of the flat glass compared in Fig. 15 have neither been controlled nor been the same which may have affected the results and thus also the fitted function. Cd is a decent measure of the strength decisive crack after indentation cracking even though not a 1:1 but rather a 1:1.2 relation. Instead this confirms that the strength decisive crack after indentation cracking is thus not a true semi-circular half-penny crack but instead a semi-elliptical crack which has previously been experimentally observed by Sglavo and Green [71].
The results presented in this paper provide an initial experimental proof-of-concept that the glass strength can be non-destructively tested within reasonable limits of confidence. However, the understanding of the technique will need further improvement, calibration, and validation before it can be used in any real practical application, including the scale effect of using larger or smaller samples with significantly more or less flaws where the glass strength is based upon the weakest-link criterion [72]. Artificial Intelligence (AI) and Machine Learning (ML) can potentially be tools for handling data, which thus also can be used to improve the method [73], [74], [75]. It also opens for a wide range of possibilities for future work on fundamental understanding, e.g., of cracks in different glass compositions, different indentation fracture modes, multiple indentation crackings, glass-ceramics and glass containing bubbles or particles, e.g., NiS inclusions [23].
4. Conclusions
In the study, a nonlinear acoustic wave technique has been employed to detect defects from indentation-induced cracking on the surface of glass samples. Then, the samples have been tested in a ring-on-ring setup to determine the level of stress at failure. From the performed study, the following conclusions can be drawn:
- Indentation-induced cracking in small specimens give practically realistic glass strengths.
- Indentations inflicted with greater than 1 N force give cracks that result in low variation in strength.
- Glass strength is directly influenced by the median cracking which can be estimated by the diagonal crack length upon indentation cracking which do not give rise to perfectly semi-circular half-penny cracks but instead semi-elliptical.
- Nonlinear acoustics wave (NAW) method and ring-on-ring destructive tests give similar Weibull distribution plots.
- The individual sample’s stress at failure as a function of normalized defect value (NDV) gives linear correlation for all indentation loads, with increasing R2 of the fits from 0 N to 10 N. Approximately half of the results are within the 95% confidence interval.
CRediT authorship contribution statement
L. Grund: Data curation, Formal analysis, Investigation, Methodology, Resources, Visualization, Writing – original draft, Writing – review & editing. S.A.K. Andersson: Data curation, Formal analysis, Investigation, Methodology. K.C.E. Haller: Conceptualization, Data curation, Formal analysis, Funding acquisition, Investigation, Methodology, Resources, Software, Supervision, Visualization, Writing – original draft, Writing – review & editing. K. Persson: Conceptualization, Data curation, Formal analysis, Funding acquisition, Investigation, Methodology, Resources, Software, Visualization, Writing – original draft, Writing – review & editing.
Declaration of Competing Interest
The authors declare the following financial interests/personal relationships which may be considered as potential competing interests: Kristian C. E. Haller reports financial support was provided by Acoustic Agree AB. Kristian C. E. Haller reports a relationship with Acoustic Agree AB that includes: board membership, employment, and equity or stocks.
Acknowledgements
The research was funded by ÅForsk, Grant No. 19-479. S.Karlsson also acknowledges funding from FORMAS, the Swedish Research Council for Sustainable Development, Grant No. 2018-00707.
Appendix A. Supplementary data
The following are the Supplementary data to this article:
Download : Download Word document (3MB)
Supplementary data 1.
Data availability
Data will be made available on request.


