This paper was first presented at GPD 2023.
Link to the full GPD 2023 conference book: https://www.gpd.fi/GPD2023_proceedings_book/

Authors:
- Philipp Amir Chhadeh
- Khodor Sleiman
- Isamu Lautenschläger
- Katharina Rettschlag
- Peter Jäschke
- Stefan Kaierle
- Ulrich Knaack
- Matthias Seel
Abstract
The present study investigates the loadbearing capacity of additive manufactured components composed of glass. The main objective of this research is to assess the substance-to-substance bond between the additive manufactured glass and a flat glass plate, with the aim of generating new connections and constructions for facades. Compared to adhesive or bolted connections, a substance-to-substance bond of glass offers numerous advantages. In this context, material properties and maximum load-bearing capacity are derived based on experimental setups. To isolate individual properties, we propose experimental setups with maximum simplicity, in this case a shear test to evaluate the strength of the substance-to-substance bond. The additive manufacturing process used in this research is the Laser Glass Deposition printing method developed at Laser Zentrum Hannover e.V.. The purpose of this study is to evaluate whether additive manufactured glass components could potentially serve as a viable alternative to traditional point holders, which are typically made of metal or other materials. Through the assessment of the suitability for this purpose, this research aims to provide valuable information to designers and engineers interested in employing additive manufactured with the material glass in their projects.
1 Introduction
For the application of additive manufacturing (AM) for glass facades, there is a need to look at the problem from opposite perspectives. On the impact side, there are the loads and requirements of glass facades. On the resistance side, there are the printing process parameters and the load-bearing capacity of the printed components, as well as the material properties. Since the print bed in most additive processes with glass is still small in its current state, this paper will focus on point fixations in glass facades. In order to provide a background, the design concept of the classic point fixation will be discussed in the following section. As well as, the process used at the Laser Zentrum Hannover e.V., Laser Glass Deposition (LGD), and the evaluation methods of the printed components are presented. In addition to optical evaluation methods, destructive tests are conducted to determine how much load can be transferred into a glass pane through the substance-to-substance bond of additive manufactured glass components. The failure load and calculated stresses in the component are then compared to the loads acting on glass facades for evaluation.
1.1 Laser Glass Deposition
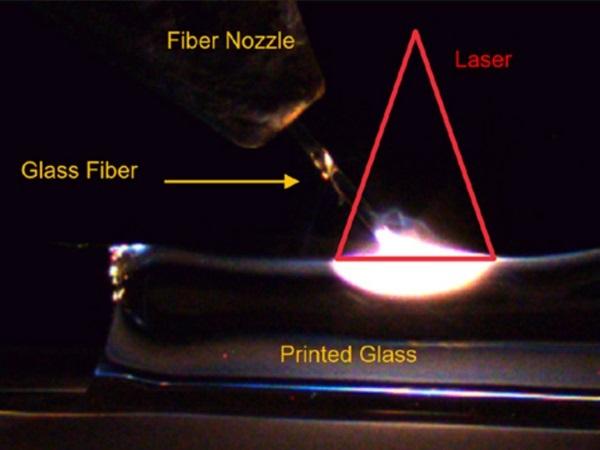
Xin et al (2023) gives an extensive overview on the recent progress in additive manufacturing with glass. With the conclusion that most of the methods are not suitable for the construction industry. One reason is that most manufacturing processes operate on scales that are too small. Only the fused deposition modelling processes could have an application. Seel et al (2018) also states this and investigates applications of glass fused to a glass plate. Engineers and architects have the most experience with float glass panes, therefore it is at hand that applications with glass fused onto glass panes are of interest. With the method of altering the shape of flat glass panes through addition of material various applications in glass facades develop. The LGD process is a method where glass fibers are fused onto a glass plate creating a load bearing substance-to-substance bond.
The process uses a CO2 laser as a heat source to melt the glass fibers, here a 400 µm diameter fused silica glass fiber, and fuse them onto a fused silica glass substrate. The CO2 laser radiation is absorbed locally by the glass material. The absorption causes the amorphous glass lattice to vibrate until the lattice bonds are gradually broken and the glass viscously melts. At a viscosity of 4 dPas and below, glass enters the processing point where glass can be processed well.
This viscosity point is reached for fused silica at above 2200 °C. The glass fiber is introduced laterally into the process zone at a feeding rate vF . The degree of fusion of the glass filament can be precisely adjusted by the heat applied and the axis kinetics. Contact angles of between 5° and 90° could already be achieved, see Sleiman et al (2023). Higher contact angles of 90° are used for the additive manufacturing of light-guiding waveguides, since the weaker degree of fusion allows the circular shape of the filament to remain for the light guiding as stated by Kranert et al (2020). Lower contact angles below 30° are used for the manufacturing of structural components, as presented by Sleiman et al (2023) and Luo et al (2018). Laser-based glass 3D printing processes with filaments are not limited to fused silica glass. First studies on the use of borosilicate glass and soda-lime glass have already been presented by Sleiman et al (2022), Luo et al (2016), Fröhlich et al (2021).
1.2 Glass joining in facades
This research objective is to introduce an additional option for point fixation for glass facades using additive manufacturing. With this an alternative way of connecting glass panels is shown, in which the printed geometry incorporates a way of connecting the glass panel via form-locking. The main requirement for point fixations are the transfer of dead load and wind load. In this initial step of the study, the dead load transfer in a vertical cantilevered facade is addressed. The weight of a glass pane can be distributed proportionally among the supports in a design concept. Thus, the amount of load varies with the dimension of the supported glass pane and the number of point fixations. In conventional glass facades point fixations are often done using either adhesive joints, clamp fixations, bore hole, or undercut fixation, as Seel and Siebert (2016) state.
Having a lot of advantages due to the homogeneous load distribution and relatively easy application, some adhesive joints do not solely fulfil the building requirements in Germany. This is mostly because the high requirement for age resistance, which is influenced by the surrounding conditions, for example UV-light and moisture. Therefore, a mechanical support always needs to be installed and building approval in each individual cases must be applied for. Bore hole and undercut fixation include a reduction in the cross section of the glass resulting in thicker glass plates. The design concept for this can be found in DIN-18008-3 (2013). Mechanical point fixation are commonly approved as a product and can therefore be easily incorporated by engineers in the design process. It is then only required to evaluate the stresses in the glass plate.
2 Methodology
2.1 Intention
A shear test has been developed to determine the load-bearing capacity of additively manufactured glass in the direction parallel to the plane. Using LGD a straight wall was printed on a float glass pane, which is then loaded in shear in the transverse direction of the wall. This makes it possible to determine the load that can be transmitted across the joining area also referred to as the substance-to-substance bond. To determine the resistance of this bond, the geometric properties of the printed wall must be analysed. After the test has been carried out, the measured load is converted into a stress via the geometric properties.
2.2 Specimen
2.2.1 Additive manufacturing of specimen
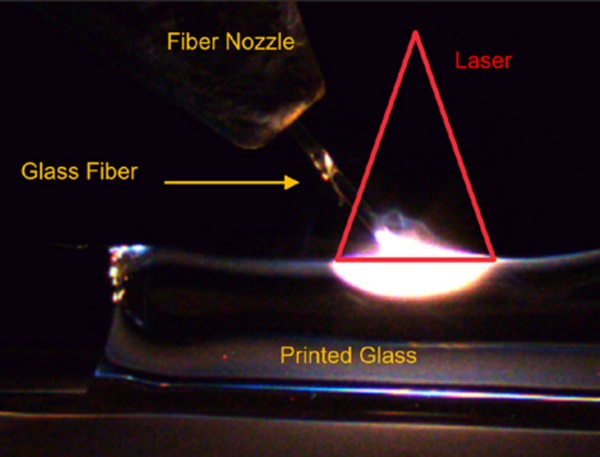
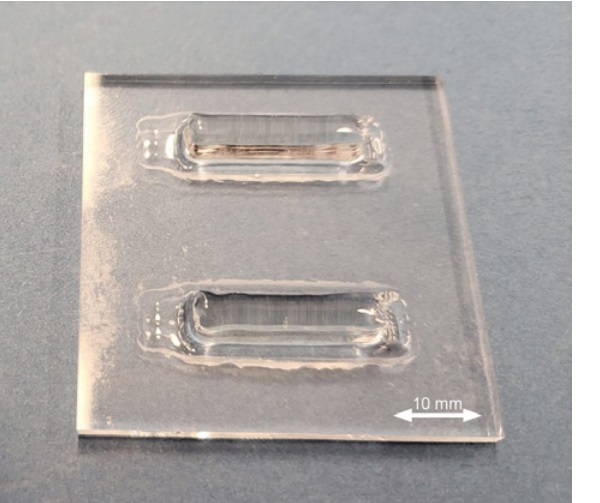
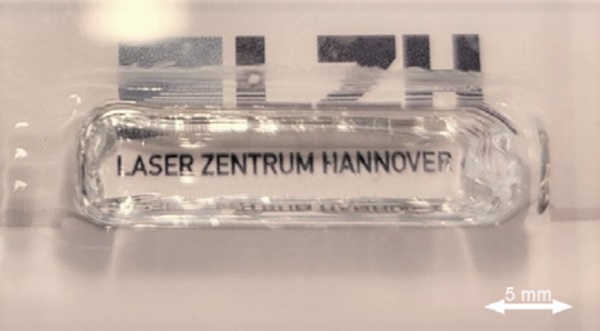
Figure 1 shows a process photo of the experimental additive manufacturing setup. The laser radiation hits the fused silica substrate (3 mm thickness) vertically in a defocused form with a power of 150 W . The fused silica fiber is introduced laterally into this process zone at a 50° angle and a speed of 324 mm/min. The wall is built up layer by layer by translating the linear axis system. During this process, the axes moves at a speed of 40 mm/min. To obtain a wall thickness greater than the substrate thickness, several tracks are placed next to each other with an overlap of 20 %. The test specimens shown in Figure 2 could be produced in 30 layers on top of each other. The printed test specimens show high transparency and surface quality, no distortion of the logo can be observed in Figure 3.
Likewise, the individual layers of the print are not visible, indicating complete fusion of the individual layers. The surface of the specimens was not post-processed, but the specimens were post-annealed in an oven process to reduce thermal stresses.
2.2.2 Geometric properties of specimen
In order to extract the geometric properties of the AM glass specimen, a com- putational approach has been developed, which aims to recreate the approximate cross section as a polygon. The process involves four phases: imaging, image pro- cessing, geometric analysis, and post-processing. It can be challenging to digitally capture glass bodies using traditional imaging methods due to their transparent or translucent nature. However, the specifically designed imaging booth used in this approach overcomes this challenge by providing standardized aerial lighting and a dark background to highlight the glass specimen’s edges and contours. The imaging phase captures two images of the specimen from two sides.
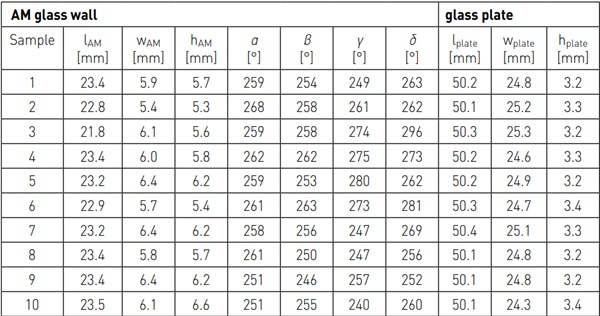
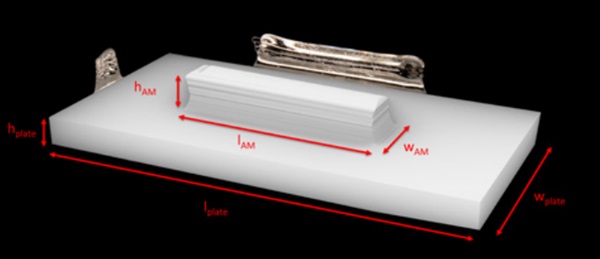
The generated images are subsequently fed into an image processing pipeline, with the objective of reducing the input image to it’s relevant geometries. This is achieved through a series of operations such as grayscale conversion, followed by thresholding based on the works of Gonzalez and Woods (2002) to generate a binary cross-sectional image. Building on Soille (2004) the binary image is then subjected to morphological operations like the morphological opening and closing, filtering out smaller irregularities and noise as well as filling holes. Consequently, an output binary image displaying solely the outer contour of the glass specimen is produced. The contour as a precise polygonal line was used in the framework of this paper for the creation of a digital twin. For this purpose, extrusion bodies were formed from the contours and joined with a boolean intersection. Figure 4 shows the resulting body of the digital twin labeled with the respective lengths, which can be found in Table 1.
The binary image of the specimen contours is utilized to identify geometric primitives such as lines and circles using two algorithms. According to Fischler and Bolles (1981), the Random Sample Consensus algorithm (RANSAC) is a probabilistic approach that robustly fits lines or curves through point clouds despite the presence of noise or outliers. In this methodology, the binary image of the specimen contour is analyzed sequentially to identify a single line at a time. The corresponding pixel are then removed from the binary image until only an insufficient amount for the detection of a line remains.
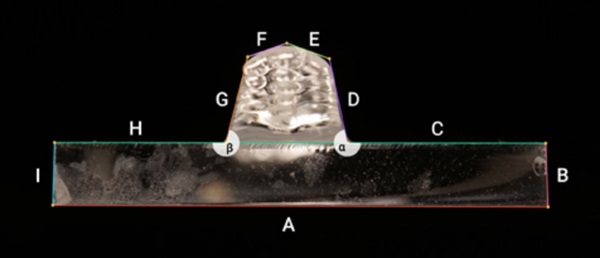
Davies (2005) formulates the Circular Hough Transform, which is utilized to detect circle segments to more accurately describe the intersection points of the specimen edges. Prior to the detection process, the contour of the specimen undergoes smoothing with the Savitzky-Golay filter to reduce false detections. The final stage concerns the post-processing of the geometric primitives identified in the previous phase. To reconstruct the specimen’s approximate polygonal cross- section, intersections are generated between the adjacent lines that correspond to the polygon vertices. Subsequently, variables like edge lengths, widths, heights, and intersection angles are derived from the polygon for each specimen see Table 1. The exact mapping of the output edges and angles to the polygonal cross-section of the specimen is illustrated in Figure 5. The angles γ and δ are located in the direction transverse to the image plane. The process was tested for robustness using control measurements with a vernier calipers.
The image processing pipeline has been implemented in Python (Van Rossum and Drake (2009)) in conjunction with the skimage library (van der Walt et al (2014)), while the specific implementation of the RANSAC algorithm has been derived from OpenCV (OpenCV (2015)).
2.3 Shear test setup
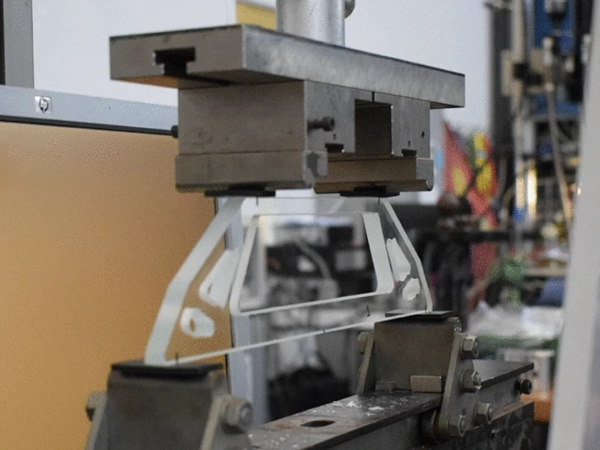
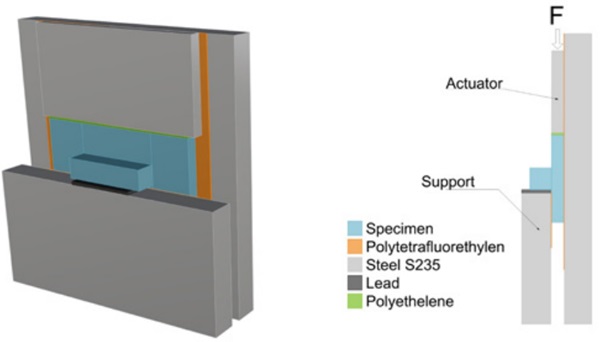
The test was carried out with a Zwick Roell Z050. A special setup has been developed for this universal testing machine, shown in Figure 6, to perform shear tests on the specimens described above. The experiments were conducted by 20 °C and 50% humidity. The polyethylene strip between the specimen and the actuator avoids the contact stress between steel and glass. The 1.2 mm thick soft lead strip positioned underneath the printed wall accommodates for the uneven surface of the printed glass specimen, ensuring an even load distribution. The lead strip is 20 mm long and positioned in the center beneath the AM glass wall. This was done with the intention to avoid stress peaks in the edge areas of the printed wall of the specimen.
The Polytetrafluorethylene (PTFE) serves as a frictionless sliding bearing.
3 Results
3.1 Data
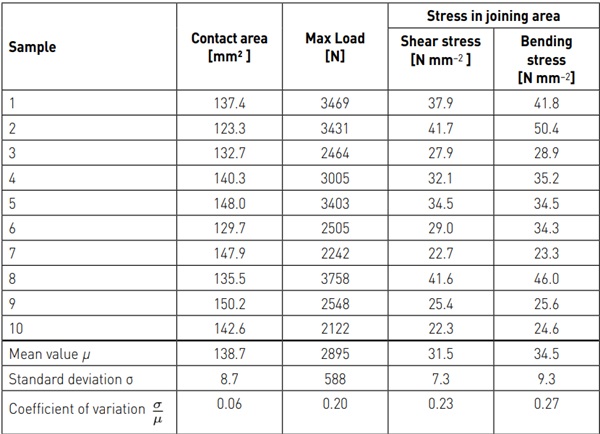
Table 2 provides the calculated size of the joining area by multiplication of the length and width of the AM glass wall at the base. In the same Table the maximum load before failure is documented, showing that the average failure load is 2895 N over a surface of 139 mm². Derived from these values the last two columns of the table show the converted stresses, shear and bending. These are calculated by the following equations.
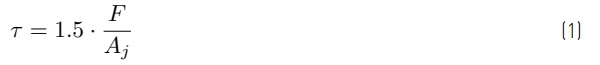
The shear stress is calculated by the applied load F divided by the joining area Aj multiplied by a factor of 1.5 assuming a rectangular shaped joining area.
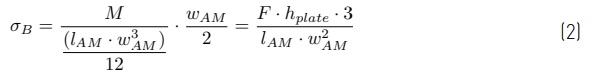
Choosing the edge between the printed wall and the base plate as a center of rotation the maximum bending stress can be calculated with σB as bending stress, wj as height and lj as width of the joining area to calculate the moment of inertia of the joining area, hplate as thickness of the glass plate and F as the applied force by the actuator.
The mean values of the calculated stresses are for shear τ = 31.5N mm⁻² and for bending σB = 34.5N mm⁻². The values fall within the same order of magnitude as the characteristic bending strength of glass, 45N mm⁻² as given in the literature. On one hand, this indicates the suitability of the test setup for testing AM glass components, and on the other hand, the resistance of the substance-to-substance bond as a load-bearing element.
It can be seen that although the geometric properties are very consistent, the maximum load bearing capacity is still scattered. However, with a coefficient of variation of 0.20 for the load and 0.23 or 0.27 for the calculated stresses, one is still in an acceptable range for destructive testing of glass, since the coefficient of variation is below 0.3, as stated by Schneider et al (2016). Due to the limited amount of test specimens, it was decided to use the statistical evaluation according to DINEN-1990 (2021) and ISO-12491 (1997).
R the 5% fractile value can be calculated with Equation (3), with µ as the mean value and σ as the standard deviation. The coefficient kn can be determined by DIN EN 1990 Table D1 and is correlated to the amount of specimen (ten in this experimental testing series) an the coefficient of variation. In this case kn equals 1.72.
![]()
This results in a 5%-fractile value of 1884 N over an average area of 139 mm² for the transferable load in shear direction through a substance-to-substance bond of glass. For a structural design additional partial safety factors must be taken into account.
The high variance is due to the fact that glass breakage usually does not occur at the point of maximum principal tensile stress, but where a relatively deep surface crack with a relatively large principal tensile stress are in critical combination. The test setup is designed so that the maximum stresses occur in the joining area to ensure the desired fracture behavior. However the defects occurring in the glass due to the process of laser deposition printing are not completely investigated, but it is visible that the glass plate is deformed due to the heat entry through the laser. This is not necessarily a crack or a micro-defect, but it can still lead to a stress concentration due to the change of the geometry at that point.
3.2 Evaluation
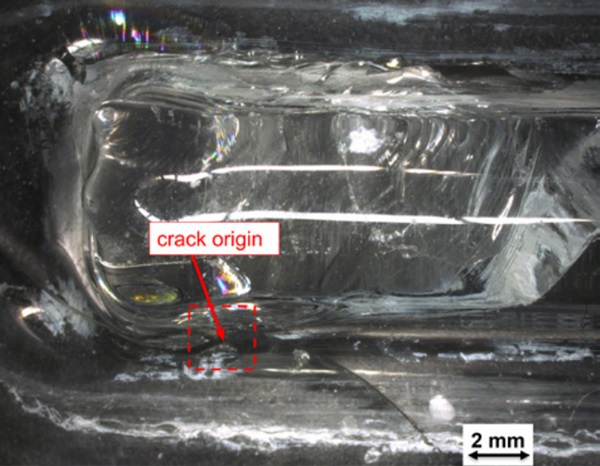
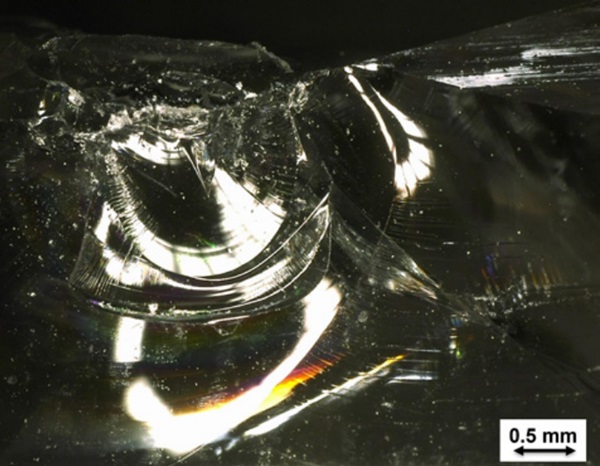
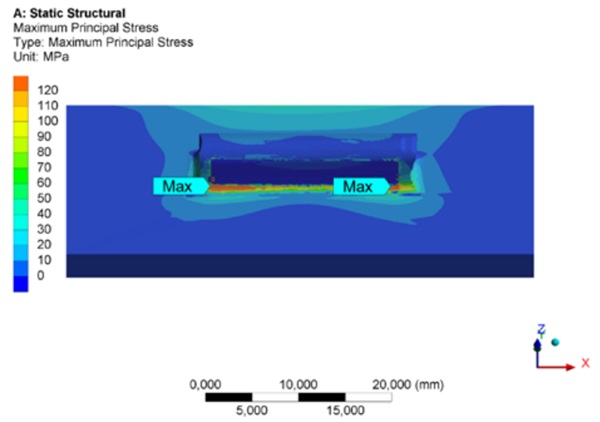
In order to evaluate the test further, the failure behavior must be understood. Using light microscopy (Keyence VHX-600D), the fracture origin can be traced back to the edge between the AM wall and the glass plate, often in the edge area of the lead strip the maximum principal stresses appear. The presumed fracture origin is shown in Figure 7. Locating the exact fracture mirror is challenging due to the difficulty in focusing to the correct depth of the angled fracture surface. Figure 8 attempts to show the crack origin in a cross section. To support this assumption, the digital twins were analyzed using ANSYS (2020), see Figure 9. The FE analysis shows that the maximum stresses are located in the edge region of the support lead strip, as assumed, and that fracture is very likely to occur here.
There are three cases in which the crack can develop, indicated in Figure 10. The most common case is case 1, where the crack migrates through the plate. This means that for many specimens, the joining area is still intact after the test. In case 2, the crack migrates in a crescent shape through the glass plate to the opposite edge of the AM wall. This can be an indicator of the depth of the joining area of AM glass specimen produced by the LGD process. Case 3, where the crack migrates through the AM wall, did not occur as a cause of failure in the series of tests, but may occur and should not be neglected for further series of tests. The number of ten specimens investigated here is not sufficient to exclude this failure.
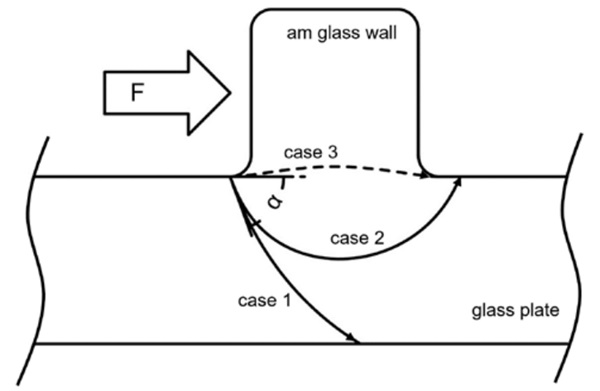
In the cross-section of the fractured specimens, a consistency of the crack develop- ment angle can be seen. This angle α is approx. 70° . This is in agreement with values from the literature for shear tests. For example, Erdogan and Sih (1963) describe this phenomena in a comparable experimental test setup as a mixed mode failure of mode I and mode II, due to the biaxial stress state in the specimen. In their research on crack growth under combined mode I and mode II loading, Singh and Shelty (1990) state a factor of 0.84 for KIc /KIIc This means that although a mode II failure is induced by the loading, due to the fracture toughness KIc being lower than KIIc, the crack propagation in mode I is being favored.
4 Conclusion
The experiments demonstrate that LGD manufactured fused silica glass components are suitable for use as load-bearing elements in facade construction. Future research will investigate the translation to more common glass types in glass facades, sodalime and borosilicate glass. Due to similar mechanical material properties between the glass types, the experimental and evaluation method of this research will still be applicable.
For engineers, this is a step to design structures with AM glass components. In addition to the load transfer parallel to the plane direction, the consideration of tensile stresses in the joining area must be investigated through bending or tensile tests. A preliminary comparison to different types of point fixations can already be drawn. The AM components show a higher resistance than adhesive bonded joints, especially due to the durability and weather resistance of all-glass components. It results in a stiffer joint, which is not inherently beneficial since it introduces constraining forces into the system. Here, similar to mechanical point fixations, a substructure must be developed that enables the degrees of freedom of the construction to be changed.
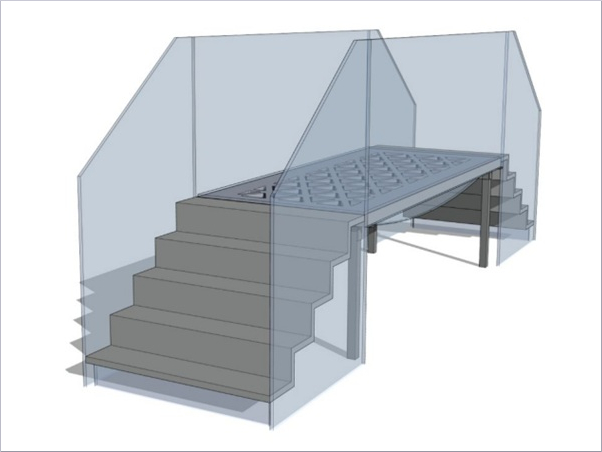
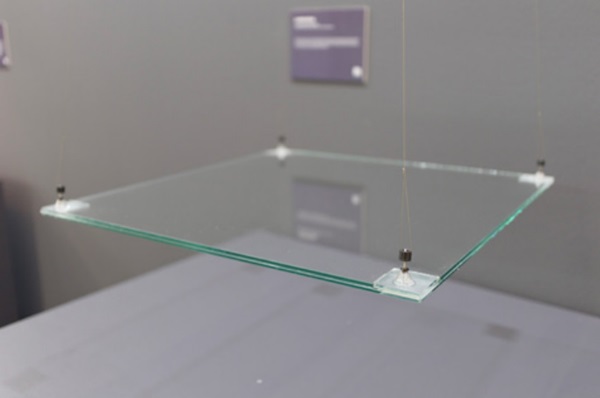
Compared to point fixations that rely on undercutting or boring through the glass, thinner glass thicknesses can theoretically be achieved, since the cross-section is not reduced but added to at the joint. The in this research determined transferable load of 1884 N over a joining area of 139 mm² as pure dead load in a vertical glass pane through the AM substance-to-substance bond is in a comparable range to point fixations with similar borehole dimensions. In future research different stress states need to be examined on AM glass geometries in order to develop a concept which can be compared to the design concept of point fixations given in DIN-18008-3 (2013). Suitable AM glass geometries are still in an early development state for glass facades. A first concept has already been exhibited at Formnext 2021 by Chhadeh et al (2021), in form of the Flipped desk, see Figure 11. Here, a suspension construction was connected to four AM glass cones to support a glass panel. Based on this example, other applications can be envisioned in different shapes and suspension techniques in the future.
References
ANSYS (2020) Ansys workbench r 2019.2 static-structural
Chhadeh PA, Sleiman K, Seel M (2021) Be-am built environment additive manufacturing pp 136–137
Davies E (2005) Machine Vision: Theory, Algorithms, Practicalities
DIN-18008-3 (2013) Glass in Building - Design and construction rules - Part 3:Point fixed glazing. DIN German Institute for Standardization
DIN-EN-1990 (2021) Eurocode: Basis of structural design; German version EN 1990:2002 + A1:2005 + A1:2005/AC:2010. DIN German Institute for Standardization
Erdogan F, Sih G (1963) On the crack extension in plates under plane loading and transverse shear pp 519–525
Fischler MA, Bolles RC (1981) Random sample consensus. Communications of the ACM 24(6):381–395, DOI 10.1145/ 358669.358692, URL https://doi.org/10.1145/358669.358692
Fröhlich F, Hildebrand J, Bergmann J (2021) Experimental investigation on lateral path overlay and the degree of mixing of additively manufactured soda-lime and borosilicate glass structures
Gonzalez R, Woods R (2002) Digital Image Processing. Prentice Hall, URL https://books.google.de/books?id=738oAQAAMAAJ
ISO-12491 (1997) Statistical methods for quality control of building materials and components. DIN German Institute for Standardization
Kranert F, Rettschlag K, Wienke A, Hohnholz A, Neumann J, Jäschke P, Kracht D, Lachmayer R (2020) Generation of functional curved waveguides by co2-laser based deposition of coreless fused silica fibers. p 11, DOI 10.1117/12.2554516
Luo J, Gilbert L, Qu C, Landers R, Bristow D, Kinzel E (2016) Additive manufacturing of transparent sodalime glass using a filament-fed process. Journal of Manufacturing Science and Engineering 139, DOI 10.1115/1.4035182
Luo J, Hostetler JM, Gilbert L, Goldstein JT, Urbas AM, Bristow DA, Landers RG, Kinzel EC (2018) Additive manufacturing of transparent fused quartz. Optical Engineering 57(4):041,408–041,408
OpenCV (2015) Open source computer vision library
Schneider J, Kuntsche J, Schula S, Schneider F, Wörner JD (2016) Glasbau Grundlagen, Berechnung, Konstruktion
Seel M, Siebert G (2016) A new design method for point fixed glazing 85:133–147 Seel M, Akerboom R, Knaack U, Oechsner M, Hof P, Schneider J (2018) Additive Manufacturing of Glass Components - Exploring the Potential of Glass Connections by Fused Deposition Modeling. DOI 10.7480/cgc.6.2161, URL https://doi.org/10.7480/cgc.6.2161
Singh D, Shelty DK (1990) Subcritical crack growth in soda-lime glass in combined mode i and mode ii loading. Journal of the American Ceramic Society 73(12):3597–3606
Sleiman K, Legutko M, Rettschlag K, Jäschke P, Overmeyer L, Kaierle S (2022) Co2 laser based welding of borosilicate glass by laser glass deposition. Procedia CIRP 111:466–469, DOI 10.1016/j.procir.2022.08.068
Sleiman K, Rettschlag K, Jäschke P, Kaierle S, Overmeyer L (2023) Experimental investigation of additive manufacturing of fused silica fibers for the production of structural components in the laser glass deposition process. In: Lachmayer R, Bode B, Kaierle S (eds) Innovative Product Development by Additive Manufacturing 2021, Springer International Publishing, Cham, pp 273–285
Soille P (2004) Morphological Image Analysis.
Springer Berlin Heidelberg, DOI 10.1007/978-3-662-05088-0, URL https://doi.org/10.1007/978-3-662-05088-0
Van Rossum G, Drake FL (2009) Python 3 Reference Manual. CreateSpace, Scotts Valley, CA van der Walt S, Schönberger JL, Nunez-Iglesias J, Boulogne F, Warner JD, Yager N, Gouillart E, Yu T (2014) scikit-image: image processing in python. PeerJ 2:e453, DOI 10.7717/peerj.453, URL https://doi.org/10.7717/peerj.453
Xin C, Li Z, Hao L, Li Y (2023) A comprehensive review on additive manufacturing of glass: Recent progress and future outlook. Materials Design 227:111,736, DOI https://doi.org/10.1016/j.matdes.2023. 111736, URL https://www.sciencedirect.com/science/article/pii/S026412752300151X