Challenging Glass 6
Conference on Architectural and Structural Applications of Glass
Louter, Bos, Belis, Veer, Nijsse (Eds.), Delft University of Technology, May 2018.
Copyright © with the authors. All rights reserved.
ISBN 978-94-6366-044-0, https://doi.org/10.7480/cgc.6.2120
Authors:
Paulina Bukieda a, Michael Engelmann a, Bernhard Weller a, Michael Elstner b
a Technische Universität Dresden, Institute of Building Construction, Germany
b AGC Interpane, Germany

At the moment, however, there is no statutory method available for directly extrapolating the breaking strain from the breaking load without the use of expensive strain gauges. Such a method is developed by means of an experimental and numerical study in a research project between the Bundesverband Flachglas e.V. (Federal Flat Glass Association) and the Fachverband Konstruktiver Glasbau e.V. (Professional Association Structural Glass Constructions), the Institute of Building Construction at the Technische Universität Dresden and four glass bending specialists.
Moreover, it will provide the basis for testing cylindrically curved glass of any bending radius. The project partners have already submitted a proposal for a new standard to the Deutsches Institut für Normung e.V. (German Institute for Standardisation). The paper gives the theoretical background for determining the strength of flat glass according to EN 1288-3 and quantifies the additional effects for the testing of thermally curved glass. Furthermore, the testing method of the executed experimental study on thermally curved glass is described. The range of parameters for the tested specimens included the glass thickness from 3 mm to 12 mm and the bending radii from 400 mm to 2000 mm. We recorded the strain at selected points at the tensioned side and the input force for each specimen.
The measured relation between strain and load validates a numerical model, which is able to depict the actual two-dimensional stress distribution for thermally curved glass and includes non-linear aspects. The model allows for the determination of correction factors. With those, the bending strength of thermally curved glass can be calculated by measuring merely the input force during the four-point bending tests. The correction factors are summarised in charts depending on the radius and the thickness of the glass sample.
1. Introduction
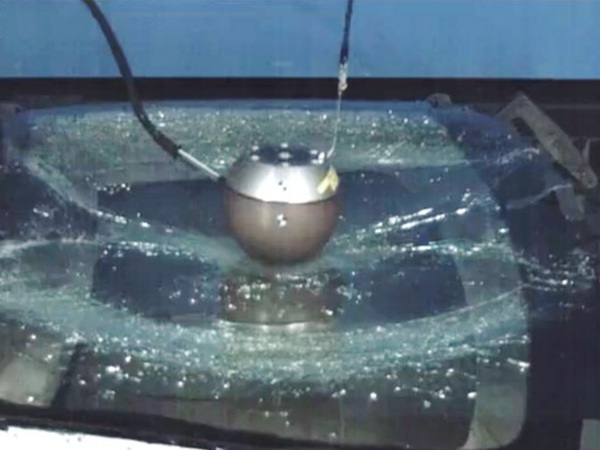
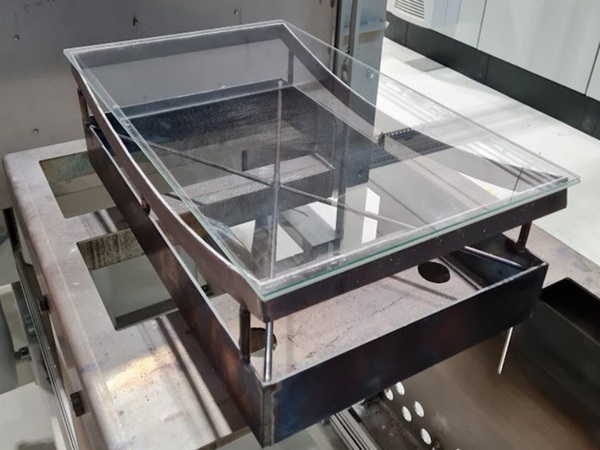
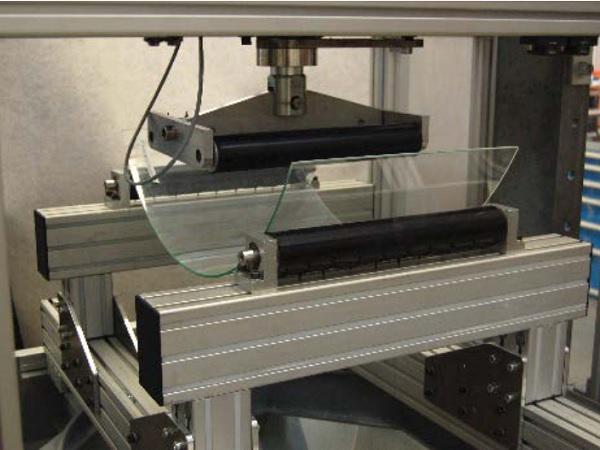
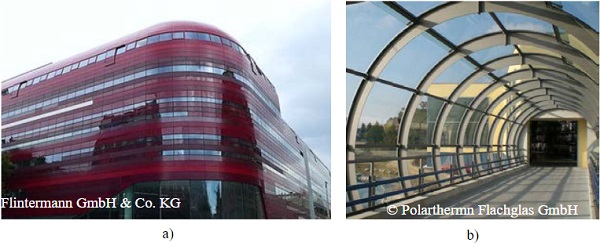
Thermally curved glass provides plenty of scope for design; however, it belongs to the unregulated construction products. Various projects can only be realised through Exceptional Approvals or through National Technical Approvals (Fig. 1). Those approvals specify a strength for the structural design, which is obtained based on the well-known four-point bending test according to EN 1288-3. Instead of plane test specimens, cylindrically curved glass of a width of 360 mm is assembled in the testing machine. Moreover, the test measures the stress and the test force. Unlike the flat glass test, this test cannot directly extrapolate the breaking strain from the breaking force as the correction factors k of the test norm have been obtained for flat glass specimens.
Thus, they are not valid for other specimens (Blank 1994; Engelmann 2011). Nevertheless, the research results available show that the test according to EN 1288-3 is applicable to curved glass. The research project “Determination of the bending strength of thermally curved glass” (PRÜFgbGLAS) will answer the question what load-strain behaviour of curved glass is shown in the four-point bending test. The results will validate a numerical computational model in order to develop a standardised testing method based on the procedure of EN 1288-3, including the required correction factors for cylindrically curved glass.
2. State of the Art of Science and Technology
2.1. Determining the Strength of Flat Glass According to EN 1288-3
The strength of flat glass is experimentally determined. In addition to the coaxial double ring test (EN 1288-2 and EN 1288-5), the four-point bending test according to EN 1288-3 is commonly used. In the test, the breaking force of the specimen is determined and converted into the corresponding breaking stress in an evaluation process. As the strength of glass is an indicator for the surface quality, the fracture origin cannot be determined a priori. Consequently, a differentiation between the edge strength and the surface strength is needed.
Similarly, flat glass can only be tested as a plate under bending due to production conditions, which results in an uneven stress state on the glass surface. The testing method according to EN 1288-3 considers both requirements. The strength is determined as a fractile with a sufficient number of individual breaking stress values. Generally, the Weibull distribution is used. In order to show where the method for determining the strength of flat glass needs to be adjusted for an application to thermally curved glass, the method mentioned in EN 1288-3 will be explored in detail below.
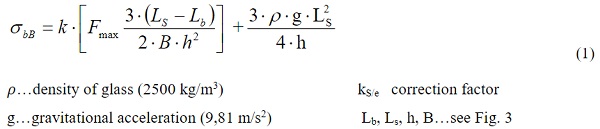
The specimens, measuring 360 mm x 1100 mm, are stressed (force-controlled) until they break. They rest on bearing rollers at a span of 1000 mm and are strained in the centre by two bending rollers set at a distance of 200 mm. The increase in force equals a constant increase of the bending stress on the surface of 2.0 ± 0.4 N/(mm2 · s) and depends on the thickness of the specimens. The breaking stress σbB is extrapolated from the breaking force Fmax based on the Euler-Bernoulli beam theory, the sample geometry, the fracture origin and a correction factor k (Equation 1).
The beam theory applies to narrow beams, minor strains and shear-rigid cross section, which remains perpendicular to the bending axis after a strain. It is assumed that the width of the cross-section does not restrict transverse strain. Thus, major strain only occurs in the direction of the span. These assumptions do not apply to wide beams, to which the mentioned specimens belong. A lateral strain is impeded in these cases, resulting in a planar stress state.
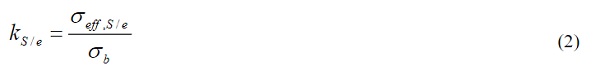
Thus in practice, an uneven stress field appears, together with increased bending tensile stress along the longitudinal edge and decreased bending tensile stress in the middle. This is taken into account in EN 1288-3 in the form of effective stress. The effective stress depicts a weighted, homogeneous stress along the cross section (Blank 1994). The correction factor k describes the ratio of the effective stress to the bending stress along the surface S and the edge e (Equation 2).
The effective stress σeff is determined with the Weibull distribution and proportioned with the linear bending stress σbB according to Bernoulli. The bending stress σbB results from equation 1 by replacing the maximum force at failure Fmax by the bending force F and neglecting the correction factor k. In order to evaluate the edge strength, the effective stress along the edge σeff,e is determined out of the stress distribution of a numerical calculation (Equation 3). In establishing this, only the stresses along the edge are taken into account – in contrast to the effective stress on the surface σeff,S (Equation 4).
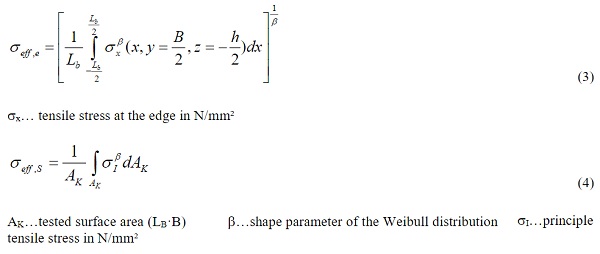
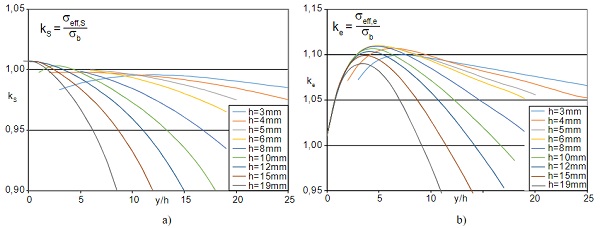
Fig. 2 shows the resulting correction factors for a set of pane thickness h versus the normalised deformation y/h, separate from the principal stress along the surface (left) and edge (right) of the specimens. The deviation of the effective stress in the middle of the pane (Fig. 2a) is sufficiently small with values between 0.90 and 1.01 for all glass thicknesses. However, in a realistic load range (σbB = 200 N/mm²), all results will be considerably larger than 0.95.Thus, the linear beam theory represents the determination of the breaking strain in the flat glass test in a sufficiently accurate manner.
It can be shown that the effective edge stresses (Fig. 2b) are up to 11 % higher than the corresponding bending tensile stress, for a deformation five times the glass thickness. Consequently, this has to be adjusted with the correction factor ke in order to receive realistic results. With the aid of the correction factors, the influence of the non-linear load-bearing behaviour of the panels is considered for the determination of the bending strength of the flat glass tests. Additional effects in the testing of thermally curved glass (Weller and Engelmann 2012) will be quantified as part of the research project.
2.2.Determining the Strength of Thermally Curved Glass
In Germany, information on the strength of thermally curved glass is provided by the recommendations in Guidelines for Thermally-Curved Glass in the Building Industry (Bundesverband Flachglas 2017). The strength specified therein is based on the certifications given and the experiences gained in the industry. At the moment, there are five National Technical Approvals in Germany for thermally curved glass (approval numbers: Z-70.4-146; Z-70.4-163; Z-70.4-190; Z-70.4-223; Z-70.4-227).
On the European level, attempts at introducing application regulations for thermally curved glass and establishing product standards can be found as well (ETA 13/0362). In (CUAP 2012), a linear estimation is used to predict the load-bearing behaviour of the specimens, with which the strength can be determined. In the process, the non-linear load-bearing behaviour and the two-dimensional stress distribution for the glass surface is disregarded. Only a displacement of the contact point between the glass pane and the bearing roller is taken into account.
This geometric non-linear effect is relevant but is not the only contribution to the stress distribution on the glass surface (Weller and Engelmann 2012). In addition, the verification calculation is satisfied with a glass pane with a thickness of 19 mm. However, with that thickness the non-linear properties barely come into effect, which means that this comparison is not representative for commonly used glass thickness. The analogy that has been drawn to EN 1288-3 is flawed because the standard considers non-linear effects due to the correction factor. The international standard ISO 11485-3 merely ascertains that there is no method to determine the strength of thermally curved glass at the moment.
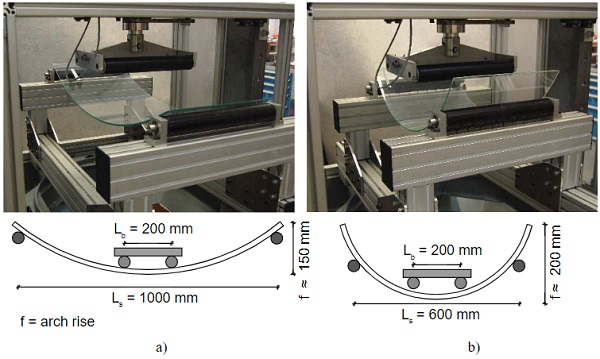
Various research results (Baatz 2002; Bucak 2009; Engelmann 2011; Weller and Engelmann 2012) show that it is possible to develop a test without the usually required strain measurements. Analogous to the flat glass test, the evaluation process has to be adjusted to cylindrically curved glass as well as to additional geometric properties, taking account of all occurring non-linear effects. Due to the geometry of the specimens, the test rig is stretched to its limit when testing with curved glass. If the radius is too small (R < 600 mm), the specimens do not rest completely on the bearing rollers and thus cannot be tested. Hence, adjusting the test rig is necessary in order to facilitate the testing of radii between 600 mm and 400 mm.
When adjusting, the strained area between the bending rollers remains 200 mm in width. Only the bearing rollers need to be displaced to reduced spans to 800 mm and 600 mm. Examining small radii is especially necessary in case of thermally pre-stressed glass as a uniform cooling process during pre-stressing is difficult with smaller radii (Hof 2013). A constant level of quality has to be ensured even for the smallest radius. In addition, specimens with a thickness of less than or equal to 6 mm deflect considerably during the bending test due to their low stiffness with regard to the span. Thus, they do not break but slide through the bearings. Reducing the width of the span also solves this problem.
3. Work Plan for the Research Project
In accordance with the procedure in the flat glass test, comprehensive experimental analyses are performed. These validate a numerical model, which is able to depict the actual two-dimensional stress distribution for thermally curved glass and includes all non-linear aspects. Based on the model, the effective stresses and the concomitant correction factors are determined in order to facilitate the standardisation of the procedure.
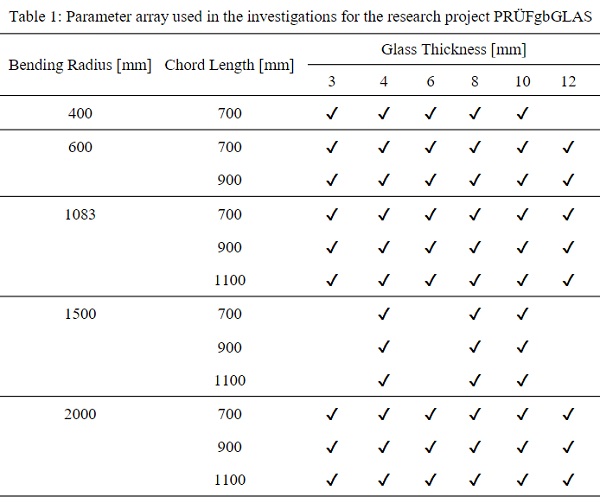
A wide range of parameters is needed in order to establish a scientific basis for standardisation. The studies presented so far have been conducted with only a few specimens. Hence, they do not have particular statistical significance. In close cooperation with the industrial partners, the range of parameters as presented in Table 1 was established. This includes the bending radii from 400 mm to 2000 mm and the glass thicknesses from 3 mm to 12 mm, which represents the current manufacturing possibilities and is consistent with industrial and architectural demand. Additionally, the chord lengths will be varied to arrive at the maximum number of testing combinations with unchanged span. As a result, the test rig does not need to be adjusted as often despite varying glass geometries.
There are three specimens for each set of parameters. With this, 186 panes were tested with the aid of a four-pointbending test. In the experiments, the input force is measured as well as the strain at the tension side. With use of the symmetry condition, the assembly of up to seven strain gauges is gathering information about the strain history of the loaded area (Fig. 3).
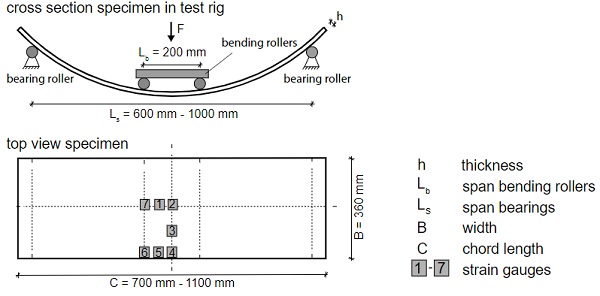
The test rig is reassembled for testing the panes with shortened chord lengths (900 mm and 700 mm) in order to reduce the span of the bearing rollers from 800 mm to 600 mm. In Fig. 4, the span is 1000 mm and 600 mm. More adjustments to the test rig might be necessary due to high rises. The rise is about 200 mm for a pane with a radius of 400 mm and a chord length of 700 mm (see Fig.4 b). The bearing rollers are raised in order to ensure enough space for the traverse way of the cross beam to the pane. As part of the project, comparison measurements are made at the test equipment of the industrial partners in order to further optimise the method and make it fit for universal use independent of the individual testing machine.
Manufacturing narrow (360 mm in width) and curved specimens can be disadvantageous because of the alignment in the bending furnace and depending on the process. Hence, narrow specimens may not display the distinctive quality of large-area glazing. As a result, the second test series is conducted on specimens with a width of 500 mm but a decreased number of combinations with regards to Table 1. This results in additional 177 and in total 363 tested panes.Consequently, the upcoming standard for testing curved glass will include a second type of specimen.
4. Results of the Four-Point Bending Test
Apart from the additional width of the specimens (500 mm), the three chosen spans are fundamental innovations in comparison to the established procedure. For this, exemplary test results for a specimen with a thickness of 6 mm and a bending radius of 1083 mm are shown in Fig. 7. The strain measured in the centre of the specimen (strain gauge 2, see Fig. 3) is compared to the test force of the three spans. The increase of the strain gets smaller with shorter spans as they have a greater stiffness. Consequently, the desired effect is achieved: greater stresses in the glass and reduced deflection.
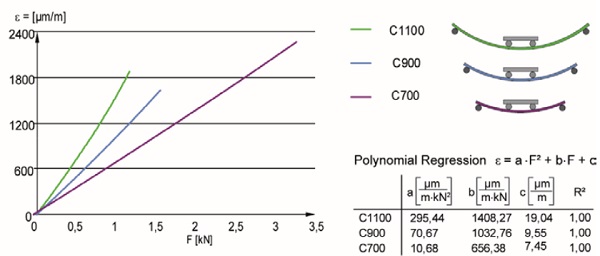
Due to metrological characteristics, only single values (25 Hz) were recorded during the test. Subsequently, these were analytically and continuously described with the help of regression. Previous studies have shown that the measured values (despite an apparently linear development) cannot be described with a linear function as a general rule (Engelmann 2011). A second-order polynomial lends itself as a regression function. Moreover, it emphasises the non-linear load-bearing behaviour in the bending test. Fig. 7 shows the regression parameters a, b and c.
Additionally, the coefficient of determination R2 is given in order to quantify the quality of the regression. For values of about one, the chosen regression function maps the run of the single values precisely. For the purpose of reproduction, the three specimens out of the same set of parameters were compared. The evaluation shows that the mean of each regression value represented one set of parameters satisfactory. Those mean regressions were directly compared with the analogous result of a finite element analysis, thus facilitating a quantifiable statement about the numerical model.
5. Numerical Model and Validation
A conclusive further development of the standardisation for flat glass into a standardisation of curved glass requires the full understanding of the four-point bending test for flat glass. Therefore, the present test for flat glass is reproducednumerically and afterwards is extended to the parameter radius. As an infinite radius (R→∞) describes flat glass, theextension of the model always includes the case of flat glass.
The curved glass model includes an investigation and implementation of the non-linear effects as presented in detailin Weller and Engelmann (2012). The second order theory is used to consider the effect of deflections that are bigger than the glass thickness on the internal forces. Furthermore, the support and loading conditions are in focus to describe the actual load bearing behaviour. The supporting rollers of the test rig remain in place but are free to rotate. During the test, the specimen deforms in the centre and changes its inclination above the roller. That means the supporting force changes in dependence of the contact area between glass and roller. For the model, this requires a contact approach at the support, which splits the force into a vertical and a horizontal component and causes bending moments in the centre of the glass. This contact approach and is generated with the use of appropriate springs.
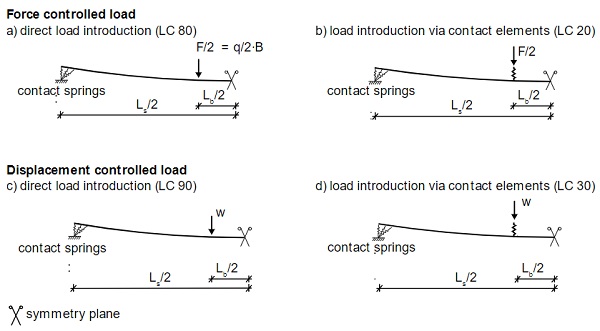
The influence of the bending rollers is investigated with four different loading conditions (LC). Therein, the force and displacement controlled load is examined as well as the load introduction through a direct linear load and contact elements (Fig. 8). Due to the symmetry, the model covers one quarter of the specimen.
To validate the numerical model at a high standard, the whole set of parameters form the experimental study (Table 1) is calculated. The model included the realistic glass thickness (nominal value reduced by tolerance) for a precise validation. To gain a general validity for a standardisation, the working model had to reach selected strength levels. For fully tempered glass (FT) a minimum tensile stress of 200 N/mm², for heat-strengthened glass (HS) tensile stressesof 120 N/mm² and for annealed glass (AN) tensile stresses of at least 70 N/mm² was chosen.
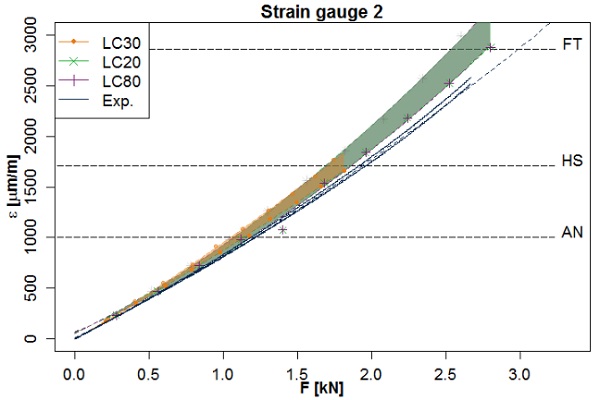
To compare the experiment with the numerical calculations, the numerical load-strain behaviour was evaluated at the position of the correspondent strain-measuring points of the experimental tests (as presented in Fig. 3). In conclusion, every set of parameters was compared at seven points with three different loading conditions. (The numerical calculation of the loading condition LC 90 only provides displacement values and is therefore not taken into account in the validation.) Fig. 9 gives an example of one validation diagram with regards to the strain assuming a constant Young’s modulus of 70.000 N/mm². The example shows the results at the measuring point strain gauge 2 of the specimens with a radius of 1083 mm, a thickness of 8 mm, a chord length of 1100 mm and a width of 360 mm.
The graph depicts the measured results (blue, continuous lines) as well as the result obtained by the polynomial regression (blue, dashed line). The coloured dots indicate the single calculated load step values, which are the basis for the polynomial regression of the numerical calculation. The shadowed, coloured areas describe the loading conditions within the thickness tolerance (green and purple are overlapping in this example, which resulted in a darker green). A visual look shows that the experimental data lines are very close to the shadowed numerical areas. With higher loads the numerical calculations are overestimating the measured strains. The force controlled loading conditions LC 20 (green) and LC 80 (purple) cover strains up to 2700 μm/m, the position controlled loading condition LC 30 (orange) reaches only a strain level of about 1700 μm/m.
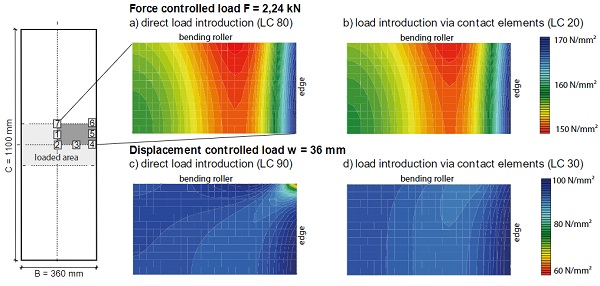
Thus, loading condition LC 30 cannot cover the strain area, which is reached in the experimental test. Overall, the displacement controlled load introduction through contact elements (LC 30) struggles especially with small thicknesses and small radii, as the large deformations of those parameters lead to convergence problems. Fig. 10 is showing the appropriate principle stress distributions between the bending rollers, which is defined as the loaded area.
The force controlled loading conditions are compared at an introduced force of 2.24 kN as an example. They nearly show the same distribution. In the middle of the specimen, the stresses are about 160 N/mm², towards the edge they first decrease by about 10 N/mm², before they increase to 170 N/mm². The distribution reflects the non-linear load-bearing behaviour, which occurs due to lateral stresses and underlines the need of correction factors to describe the uneven stress distribution respectively. The displacement controlled loading conditions are looked at an introduced load of 36 mm. The stress distribution of the direct load introduction (LC 90) is showing a peak stress at the edge under the bending roller. This result did not represent the experimental data sufficiently.
To rate the model, the numerical load values at each strength level (FT, HS, AN) are compared to the measured load. An accordance of minimum 80 % is assumed as valid. To get an overview of the validation, Fig. 11 shows all validated strength levels in dependence of the parameter combination. The radius is shown along the y-axis, the thickness along the x-axis. The altered green colour of the marks describes the chord length and in accordance the span of the test rig (dark green represents the chord length 1100 mm, green the chord length 900 mm and light green the chord length 700 mm).
The strength level reached is presented by different marks. A square indicates a minimum stress level of 200 N/mm², the triangle represents a minimum stress level of 120/mm² and the dot a minimum stress level of 70 N/mm². Everything below 70 N/mm² is marked with a red cross; empty boxes represent parameter combinations, which were not tested experimentally and therefore are not validated.
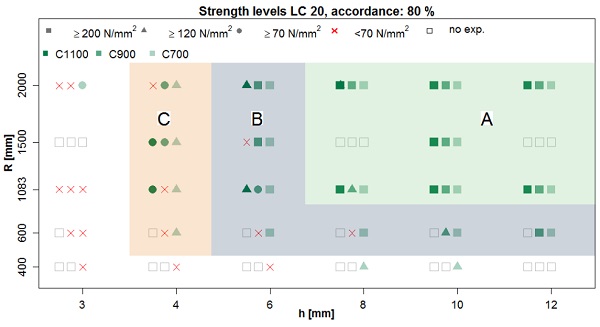
In summary, all parameter combinations in area A give a sufficient numerical description for a testing procedure according to EN 1288-3 with the common test rig span of 1000 mm. Areas B and C cannot be covered with the standard testing procedure but need a shorter test rig. Therefore, a span length of 600 mm or 800 mm is suggested. Area B covers specimens from a radius of 600 mm and a thickness 6 mm. They can be tested up to a strength level of 200 N/mm². Area C covers the thickness 4 mm and a radius of above 600 mm. Those specimens are validated up to astrength level of 120 N/mm². The last option is suitable for testing AN only.
With the validation of the model, the effective stresses were determined from the numerical stress distribution along the surface and on the edge (Equations 3 and 4). With those, the correction factors for curved glass are determined (Equation 5).
6. Summary and Outlook
At the moment, the evaluation procedures for thermally curved glass are discussed within the work group “Curved Glass” of the Federal Flat Glass Association. This will lay the foundation for a new standard and soon will be submitted to the German Institute for Standardisation.
Acknowledgements
The research project PRÜFgbGLAS was launched as part of the work group “Curved Glass” of the Federal Flat Glass Association (Bundesverband Flachglas e.V. | www.bundesverband-flachglas.de) and the Professional Association Structural Glass Constructions (Fachverband Konstruktiver Glasbau e.V. | www.glas-fkg.org). The Federal Flat Glass Association has more than 110 member companies with over 220 production facilities and about 50 supporting members.
It is central to all relevant companies. In addition, the Professional Association Structural Glass Constructions supports research and development tasks in glass constructions. This co-operation and the partnership with industry and economy are of central importance for realising this research project. With this in mind, sincere thanks are given to all members and contributors for their input.
Many thanks go to the Federal Ministry for Economic Affairs and Energy (Bundesministerium für Wirtschaft und Technologie) as well as to our industrial partners Hero Glas Veredelungs GmbH (www.hero-glas.de), Finiglas Veredelungs GmbH (www.finiglas.de), Flintermann GmbH & Co. KG (www.flintermann-glasveredelung.de) and Polartherm Flachglas GmbH (www.polartherm.de) for financing this research project.
References
Baatz, A.: Experimentelle und numerische Untersuchungen der Biegezugfestigkeit von gebogenen Glasplatten. Diploma Thesis. Rheinisch-Westfälische Technische Hochschule Aachen, 2002. (unpublished)
Blank, K.; Dürkop, D.; Durchholz M.; Grüters, H.; Helmich, G.; Senger, W.: Strength tests on flat glass by means of four-point bending. In: Glass Science and Technology 67, No. 1, 1994. p. 9-15
Bucak, Ö.: AiF Abschlussbericht Trag- und Resttragfähigkeitsvergalten von unterschiedlich gebogenen Glasscheiben im Bauwesen, Entwicklung von Berechnungsmethoden, Prüf- und Qualitätssichernde Kriterien. FH München, 2009.
Bundesverband Flachglas (Hrsg.): Leitfaden für thermisch gebogenes Glas im Bauwesen. Merkblatt 009/2011, Änderungsindex 1, März 2017. Troisdorf, 2017. surface areas. Berlin: Beuth, 2000.
CUAP – Common Understanding of Assessment Procedure – Thermally Curved Glass. ETA request No. 04.04/57. 3rd draft, 2012.
EN 1288-2 Glass in building - Determination of the bending strength of glass - Part 2: Coaxial double ring test on flat specimens with large test surface areas. Berlin: Beuth, 2000.
EN 1288-3 Glass in building - Determination of the bending strength of glass - Part 3: Test with specimen supported at two points (four pointbending). Berlin: Beuth, 2000.
EN 1288-5 Glass in building - Determination of the bending strength of glass - Part 5: Coaxial double ring test on flat specimens with small test surface areas; Berlin: Beuth, 2000.
Engelmann, M.: Gebogenes Glas im Vierpunkt-Biegeversuch. Diploma Thesis, Technische Universität Dresden, 2011. (unpublished)
ETA 13/0362 European Technical Approval: Curved glass for use in buildings; BTH & BAG curved glass; Sunglass SRL; 27.06.2013-26.06.2018. Brussels: ubatc, 2013.
Hof, P.: Test program for a general technical approval for curved tempered glass in Germany. In: Glass Performance Days 2013. Tampere, Finland, 2013. p. 90 91.
ISO 11485-3 Glass in building – Curved Glass – Part 3: Requirements for curved tempered and curved laminated safety glass. Berlin: Beuth, 2014.
Weller, B.; Engelmann, M.: Nonlinear effects in testing of flat and curved glass. In: Tagungsband engineered transparency 2012. Düsseldorf, 2012. p. 259 272.
Weller, B.; Krampe, P.; Engelmann, M.: Prüfung vorgespannter, gebogener Gläser. In: Glasbau 2012. Berlin: Ernst & Sohn, 2012. p. 246-257.
Z-70.4-146 Allgemeine bauaufsichtliche Zulassung 70.4-146: Thermisch gebogene, liniengelagerte Glasscheiben "Fini Curve Float" und "Fini Curve VSG";12.08.2013 – 16.02.2020. Berlin: DiBt 12.08.2013.
Z-70.4-163 Allgemeine bauaufsichtliche Zulassung 70.4-163: Thermisch gebogene, liniengelagerte Glasscheiben 'SGG CONTOUR' und 'SGG CONTOUR STADIP'.05.12.2015 -05.12.2020. Berlin: DiBt 05.12.2013.
Z-70.4-190 Allgemeine bauaufsichtliche Zulassung 70.4-190: Thermisch gebogene, liniengelagerte Glasscheiben „Flisa Curve“ und „Flisa Curve Save“;12.06.2013 – 16.06.2018. Berlin: DiBt 12.06.2013.
Z-70.4-223 Allgemeine bauaufsichtliche Zulassung 70.4-223: Thermisch gebogene, linienförmig gelagerte Glasscheiben „Hero-Form Float“ und „Hero-Form VSG“;18.11.2015 -18.11.2020. Berlin: DiBt 18.11.2015.
Z-70.4-227 Allgemeine bauaufsichtliche Zulassung 70.4-227: Thermisch gebogenes, linienförmig gelagertes Einscheibensicherheitsglas "Flisa Dur Curve", "Flisa Dur Curve Safe" und "Flisa Dur Curve H"; 15.01.2016 -15.02.2021. Berlin: DiBt 27.06.2013.