ABSTRACT
As a result of construction activities, high-wind events, explosions, and façade maintenance or repair activities, glass cladding surfaces on exterior building envelopes may become scratched or otherwise blemished. In some cases, the blemished glass can be restored to an acceptable aesthetic condition using a combination of wet and dry polishing methods.
These polishing methods remove a thin layer of glass in proximity to the surface blemish locations. The reduction in glass thickness may cause some concern regarding the structural integrity of the glass, particularly with heat-treated glass.
Heat-treated glass may be either heat-strengthened or fully tempered. Heat-treated glass has enhanced strength relative to annealed glass. The enhanced strength results from a thin compressive stress layer at the exposed surfaces induced by the heat treatment process.
Intuitively, reducing the thickness of the compressive stress layer through polishing weakens the heat-treated glass; however, no research literature exists to facilitate prediction of the degree of strength reduction.
The methodology for assessing the structural capacity of polished heat-treated glass described herein was developed for past projects involving glass surface blemishes arising from construction activities and small explosions. Initial assessment findings are somewhat unexpected based on simplistic analytical predictions of reductions in compressive glass stresses.
BACKGROUND
With the advent of more sophisticated glass products that cater to the aesthetic and energy saving demands imposed by owners, architects, and code bodies, replacement of unacceptably blemished glass products can be a costly proposition. As such, remedial polishing provides a cost-effective alternative to glass replacement for many blemishes.
Unacceptable glass surface blemishes are defined in the standard, ASTM C1036.(1) This standard was originally intended for in-plant quality control for the benefit of the initial raw glass purchaser.
Since 2001,(2) ASTM C1036 has adopted language indicating its applicability for field evaluation. Flaws or blemishes are evaluated based on prescribed viewing conditions (e.g., not under direct sunlight), viewing distances, blemish sizes, and blemish spacial distributions given in the standard.
Neither ASTM C1036 nor the previous edition of the glass design standard, ASTM E1300 (3), are helpful in determining the structural significance of surface flaws or the structural effects of polishing glass into aesthetic conformance with ASTM C1036.
The 2016 edition of ASTM E1300 (4) provides a method to determine the load resistance of glass with a nonstandard thickness and a measured residual compressive surface stress (RCSS); thus, the changes in glass thickness and RCSS due to polishing can be used to determine a reduced load resistance.
Since many major glass manufacturers and fabricators include polishing (typically with cerium oxide) as a recommended surface restoration technique, it has often been assumed that such polishing does not significantly reduce the glass strength for either annealed or heat-treated glass.
With no available test data or established standard procedure, the authors previously attempted to analytically predict the reduction in surface stress (i.e., RCSS) resulting from glass polishing.
As occasioned by projects where a considerably large quantity of glass was unacceptably blemished after installation, the authors developed an empirical methodology for determining whether polished glass could adequately resist design loads. This methodology is explained in the following sections, and it is briefly compared with the previously developed analytical models.
ANALYTICAL METHODS FOR ESTIMATING RCSS REDUCTION
A simple method for estimating the reduction in RCSS due to glass polishing is to assume that the surface stress after polishing is similar to the stress at that location within the prepolished glass cross-section, assuming a parabolic stress distribution through the glass thickness.
Refer to Figure 1, which illustrates the commonly accepted stress distribution through the thickness of heat-treated glass. Consider that a relatively deep blemish will require removal of approximately 0.009 inches of glass. For an initial RCSS (σo) of 13,000 psi in nominally ¼-in.-thick tempered glass, the prepolished stress at a depth of 0.009 inches from the surface (σpolish) is approximately 9,900 psi.
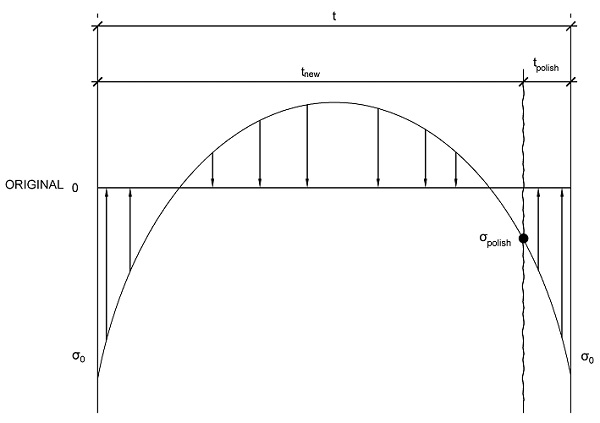
If this is the state of stress after polishing, it would represent an RCSS reduction of 24 percent. As another example, for a relatively shallow blemish, only 0.003 inches of glass removal may be required. For the same tempered glass specimen, the prepolished stress at a depth of 0.003 inches from the surface (σpolish) is approximately 11,900 psi, an RCSS reduction of approximately 8 percent.
Presumably, this simplistic method yields conservative estimates of compressive surface stress reduction, since the glass is reasonably expected to behave linearly (i.e., linear stress and strain distribution due to load effects) and redistribute internal stresses upon removal of glass during polishing.
The anticipated behavior would be similar to a post-tensioned reinforced concrete beam upon localized removal of a layer of concrete cover. This behavior is illustrated in Figure 2. Upon removal of a certain depth of glass during polishing (tpolish), the force corresponding to the stress in the removed portion (Fo) is applied to the remaining cross-section of glass.
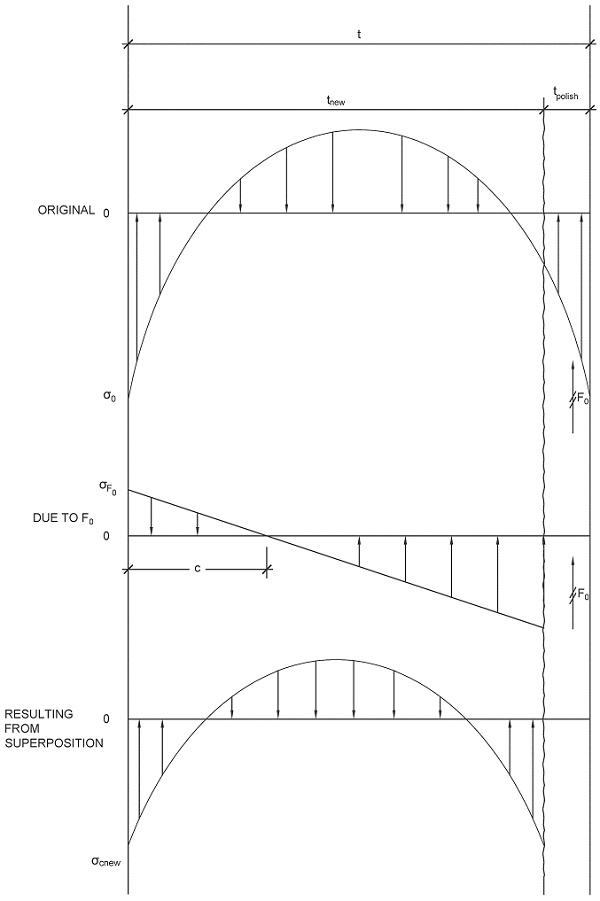
Due to the eccentricity of Fo with respect to the centroid of the remaining cross-section, a linear stress distribution is applied. The anticipated stress distribution after polishing is equal to the original stress distribution (see “Original” in Figure 2) plus the linear stress distribution due to polishing (see “Due to Fo ” in Figure 2). This anticipated stress distribution, which is symmetric through the cross-section for equilibrium, is labeled “Resulting from Superposition” in Figure 2.
Using this less conservative approach, consider the same examples as for the simplistic method. For an initial RCSS (σo) of 13,000 psi, nominally ¼-in.-thick tempered glass, and removal of 0.009 inches of glass, the resulting compressive surface stress after polishing is approximately 12,000 psi.
This approach, therefore, predicts an RCSS reduction of 8 percent. For the shallow blemish example, removal of 0.003 inches of glass results in an RCSS after polishing of approximately 12,600 psi, a reduction of 3 percent. In both examples, the RCSS reduction is significantly less (about three times) than the estimates from the simplistic method.
INITIAL FIELD MEASUREMENTS
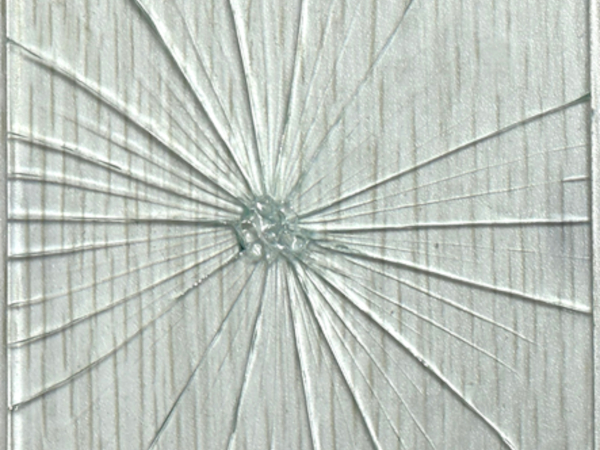
On the subject projects, an initial inspection of the reportedly blemished glass was performed in accordance with ASTM C1036. The number, location, and depth of nonconforming surface blemishes were also documented. Of particular concern were the deeper blemishes termed “crushes” in ASTM C1036.
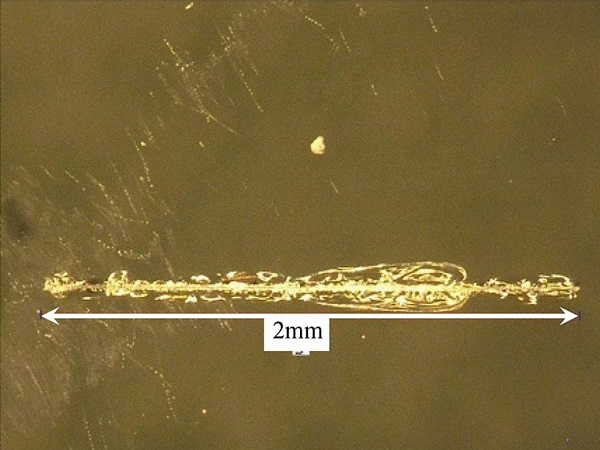
The maximum crush depth was approximately 0.006 inches, as measured using a digital dial gauge mounted in an acrylic plastic block (see Figures 3A and 3B). From the windows determined to have nonconforming blemishes, a subset including glass with maximum blemish depth was selected for trial polishing.
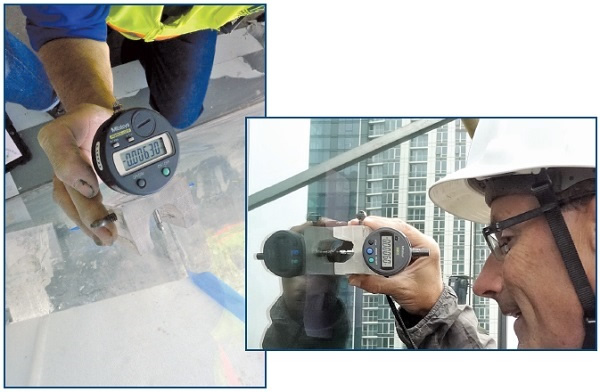
Figure 3B – Depth measurement of “crush” at exterior lite.
Prior to polishing, the initial glass thicknesses and RCSS values were also measured in the vicinity of the blemishes. In order to measure RCSS using the standard procedures with a grazing angle surface polarimeter (GASP) outlined in ASTM C1279,(5) access to the tin side of the glass (i.e., the bottom surface in the production furnace) is required.
By using a tin-side detector, it was determined that in all cases, the blemished face of the heat-treated glass lite was not the tin side of the glass. Therefore, stresses had to be measured using more recently developed technology known as a scattered light polariscope (SCALP).
The equipment consists of a measuring device placed on the glass with isopropyl alcohol as the index liquid. The device is connected to a laptop computer, which is equipped with proprietary software. Glass thicknesses were also measured to the nearest 0.001 inch using the SCALP instrument.
Multiple measurements were taken at each location, and at randomly selected locations within the perimeter of the heat-treated lites. Initial nominal thickness of the affected lites was ¼ inch.
Figures 4 and 5 are demonstration photos taken in daylight; actual readings were sometimes taken before dawn or after dusk with no sunlight present due to the sensitivity of the SCALP instrument.
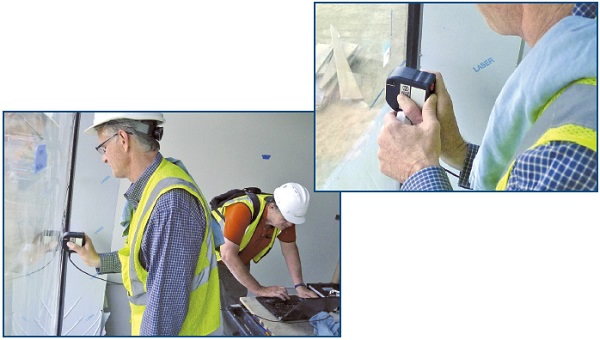
Figure 5 – Demonstration of SCALP use in daylight (note tether of equipment to laptop computer).
An interesting question arises (perhaps as a potential research topic) had the tin side of the glass been available for measurements with the GASP. That question is whether measurements taken after polishing would have been valid.
The GASP works based upon the presence of tin particles embedded near the glass surface during the initial cooling process.
Because polishing removes a thin layer of glass from the surface, it might remove the necessary tin particles, especially when polishing involves removal of relatively deep blemishes. With potentially inadequate quantities of tin at the surface of the glass, RCSS measurements taken with the GASP after polishing might be inaccurate.
TRIAL POLISHING AND RELATED MEASUREMENTS
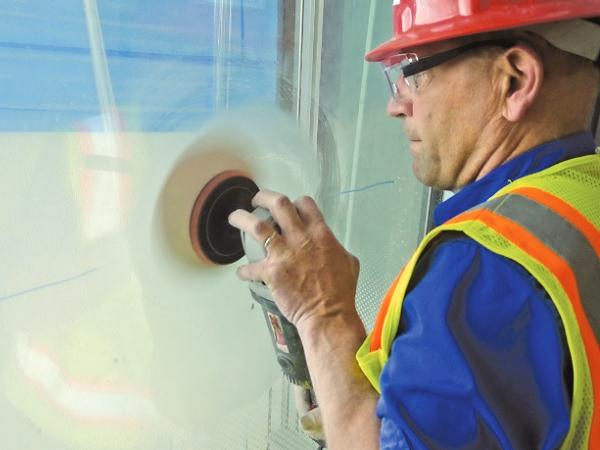
A contractor experienced in the removal of glass blemishes was selected to assist with mock-ups for each project. The contractors utilized various polishing techniques, all of which culminated with application of a cerium oxide-polishing compound.
The polished areas were generally circular and ranged from approximately 6 to 18 inches in diameter. Understandably, the polished area is centered over the blemish to be removed. However, the extent of the polished area is impacted by the blemish location within the lite.
Because of their location, edge blemishes may not be located within the center of the polished area. Without consideration of this condition, optical distortion may become an issue. During mock-ups, care was taken to minimize optical distortion in the vicinity of the polished area. In general, distortion at completed polished areas was imperceptible from typical vantage points on the building interior and exterior.
An infrared camera was used to measure glass temperatures during polishing. Maximum temperatures occasionally reached 300°F. The typical polished areas were a relatively low percentage of the total surface area of the blemished heat-treated lites. Selected steps in the polishing process utilized at one project are shown in Figures 6 through 8.
The glass thickness and RCSS were measured at each polished area. The ma ximum thickness of glass removed by polishing was 0.009 inches or roughly 4 percent of the original glass thickness.
As expected, greater glass removal generally resulted in higher reductions of RCSS. Unexpectedly, the percent reductions in RCSS values were often higher than predicted by either analytical method described above.
The measured reductions were, in fact, closer to the estimated reductions using the simplistic method. The findings also demonstrate that the assumptions made in the redistribution analytical method may not be valid and that more sophisticated analyses may be required. The fact that the reductions were still greater than the presumed conservative simplistic method is surprising and requires further study.
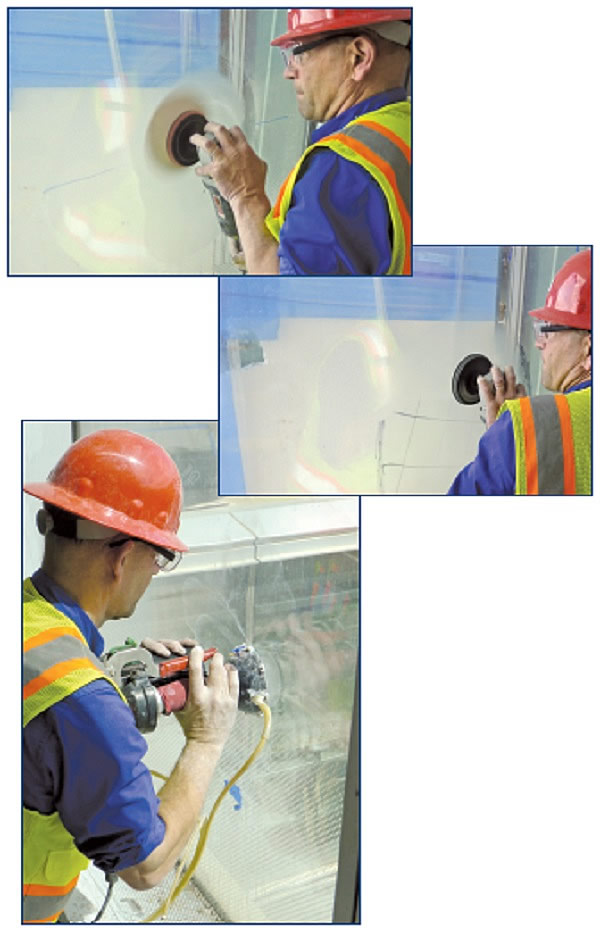
Figure 7 – Intermediate polishing step with hand polisher and fine grit sanding disk. |
Figure 8 – Final polishing step with commercial-grade, closed-wheel automated equipment that recirculates a thin slurry of a blended cerium oxide in water.
PROJECT-SPECIFIC WIND LOADS
Architectural design drawings, curtainwall shop drawings, and project specifications were reviewed for each project to determine the various glass types (including insulating glass units) and specified design wind loads.
From this review, critical wind-loading cases were identified for each affected window type considering the ratio of the original design capacity to design wind load. Original design capacities were calculated using the long standing provisions of ASTM E1300.
STRUCTURAL ANALYSES
The 2016 edition of ASTM E1300 provides a method to determine the load resistance of glazing configuration with custom lite thicknesses and RCSS values. The added alternate analytical procedure includes methods advanced in the paper “A Model to Describe the Load Resistance (Strength) of Heat-Treated Architectural Glass.” (6) written by two of the coauthors of this paper.
This procedure was utilized to determine load resistance of the polished glass for each critical load case. The procedure explicitly takes into account the measured RCSS of each glass lite when determining the load resistance of heat-treated lites of varying sizes and thicknesses. It calculates a three-second duration uniform load resistance associated with a probability of breakage less than or equal to 8 lites per 1000.
The new analytical procedure expresses the underlying theory utilized in ASTM E1300 to determine the load resistance of glazing constructions in a stepwise manner. The most significant difference between using the previous method embodied in ASTM E1300 and the new analytical procedure is that the analytical procedure directly determines the probability of breakage instead of calculating a load-resistance corresponding to a probability of breakage of 8 lites per 1000 (0.008).
Furthermore, this method naturally provides the ability to analyze glazing constructions not currently addressed by the previous ASTM E1300 (3) method, including laminated glass constructed with an interlayer other than polyvinyl-butyral (PVB), laminated glass comprised of glass plies with varying thickness and heat-treatment as a function of RCSS, and nonlinear load-sharing of insulating glass units (IGUs) that incorporates atmospheric loads due to climatic loads, changes in elevation, and changes in temperature.
Briefly, the method consists of calculating the in-plane surface tensile stresses using an appropriate stress analysis method that incorporates the nonlinear two-way bending and membrane action of plates using the actual thickness of the lite for the design load applied to the lite.
Then, the probability of breakage is calculated using the glass failure prediction model incorporating the RCSS for the lite using the ASTM E1300m- and k-surface flaw parameters, which define a two parameter Weibull distribution for weathered annealed glass.
For IGUs, the proportion of the specified design load carried by each lite in the IGU is determined using a method that maintains the ideal gas law equilibrium for the air space between IGU assembly and loaded conditions while accurately accounting for the displaced volumes of the IGU lites.
Several conservative assumptions were used in applying this analytical procedure. Prepolished lites were generally assumed to have the minimum allowable thicknesses per ASTM C1036 and minimum RCSS per ASTM C1048.(7) The maximum measured percent reduction in RCSS was assumed for all polished heat-treated lites.
While this reduction should be limited to polished areas only, it was conservatively applied to the entire heat-treated lite. Lastly, the maximum measured glass removal was utilized as a uniform reduction in glass thickness. Localized polishing of glass blemishes will only reduce the tempered glass thickness in isolated areas.
The results of the alternate analyses demonstrated that the calculated design capacities of the polished glass can be significantly higher than the ASTM E1300 design capacities for the unpolished glass and significantly higher than the design wind load demands, even with the noted conservative assumptions.
These calculations highlight the inherent conservatism in the “Basic Procedure” of the current ASTM E1300 standard. For the referenced projects involving glass surface blemishes arising from construction activities and small explosions, the methodolog y described above demonstrated that the polished lites still possessed adequate strength to resist the project-specific design wind loads.
Polishing surface damage due to normal weathering and cleaning over the service life of the glass is not recommended as this type of damage is less severe and distributed over the entire area of lites, and the corresponding reduction in strength is already included in the glass failure prediction model.
CONCLUSIONS
Based on the application of the developed structural assessment methodology for polished glass, the following conclusions/recommendations are offered:
- For the referenced projects, a maximum of 0.009 inches of glass was removed during polishing. While the method is suitable for more aggressive polishing, mock-ups are strongly recommended to aesthetically evaluate the repaired glass surfaces. In some instances, unacceptable distortion of the glass may occur, depending on the depth of glass removal and the skill of the glass technician.
- Currently, situations involving polishing of heat-treated glass must be handled on a case-by-case basis.
- Assumptions and limitations must be understood by the engineer utilizing the outlined methodology. Persons conducting the assessment should also be familiar with the equipment required to obtain the glass thickness and compressive stress values.
- Further research and experimental verification is desirable for obtaining additional data related to the reduction in load resistance of polished heat-treated glass. With sufficient data, more accurate predictive analytical models could be developed in the future.
Mark K. Schmidt, PE, SE
Wiss, Janney, Elstner Associates, Inc.
330 Pfingsten Road, Northbrook, IL 60062
Phone: 847-272-7400 • fax: 847-291-9599 • e-mail: mschmidt@wje.com
Stephen M. Morse, PhD
Texas Tech University
Department of Civil, Environmental, and Construction Engineering
911 boston ave., lubbock, TX 79409
Phone: 806-843-3268 • fax: 806-742-3488 • e-mail: stephen.m.morse@ttu.edu
H. Scott Norville, PE, PhD, FASTM
Texas Tech University
Department of Civil, Environmental, and Construction Engineering
911 boston ave., lubbock, TX 79409
Phone: 806-843-4534 • fax: 806-742-3488 • e-mail: scott.norville@ttu.edu
Jeffrey A. Caldwell, PE
Wiss, Janney, Elstner Associates, Inc.
225 south lake avenue, #1260, Pasadena, Ca 91101
Phone: 626-696-4650 • fax: 626-696-4699 • e-mail: jcaldwell@wje.com
REFERENCES
1. ASTM C1036-11ε1 , Standard Specification for Flat Glass. ASTM International, 2006.
2. ASTM C1036-01, Standard Specification for Flat Glass. ASTM International, 2001.
3. ASTM E1300-12, Standard Practice for Determining Load Resistance of Glass in Buildings. ASTM International, 2012.
4. ASTM E1300-16, Standard Practice for Determining Load Resistance of Glass in Buildings. ASTM International, 2016.
5. ASTM C1279-13, Standard Test Method for Non-Destructive Photoelastic Measurement of Edge and Surface Stresses in Annealed, Heat-Strengthened, and Fully Tempered Flat Glass. ASTM International, 2013.
6. H. Scott Norville and Stephen
M. Morse. “A Model to Describe the Load Resistance (Strength) of Heat-Treated Architectural Glass” in Glass Performance Days 2009 Conference Proceedings, 234-238. Glass Performance Days, Glaston Finland Oy, 2009.
7. ASTM C1048-12ε1 , Standard Specification for Heat-Strengthened and Fully Tempered Flat Glass. ASTM International, 2012.
“Reprinted with permission from the RCI 32nd International Convention & Trade Show, March 16-21, 2017, Anaheim California. RCI is an international association of building envelope consultants whose members specialize in design, investigation, repair, and management of building envelope systems. For more information, visit rci-online.org.”