First presented at GPD 2017
Results of highly publicized testing have shown that in some cases, the mean strength of freshly manufactured enameled glass is less than the mean strength of analogous uncoated glass [1,2,3,4]. Therefore, it has been proposed by some [1,4] that a strength reduction factor be incorporated into ASTM E1300 “Standard Practice for Determining Load Resistance of Glass in Buildings” [5] for the design of enameled glass.
Test results presented herein show that while the mean strength of freshly manufactured enameled glass appears to be reduced, the coefficient of variation is also significantly reduced. It is shown herein that the reduction in the coefficient of variation coupled with the fact that ASTM E1300 is based on the reduced strength of in-service glass combine to compensate for the apparent reduction of the mean strength of freshly manufactured enameled glass.
These results show that there is no need to incorporate an enamel glass strength reduction factor in ASTM E1300 for the heat-strengthened glass examined. The behavior of enameled glass is complicated and it will require a substantial amount of additional research before changes to ASTM E1300 can be justified by technical considerations.
Introduction
Recently, the uniform load resistance of enamel coated glass plates has become a topic of interest with respect to proposed changes to ASTM E1300. Of particular interest are reports that state that the breaking strength of enamel coated glass is reduced when compared to uncoated, freshly manufactured glass of the same type [1,2,3,4].
While it is clearly stated in the text of ASTM E1300 that the glass thickness selection criteria presented are referenced to the strength of in-service glass and not the strength of freshly manufactured glass [5], there may be implications for the use of ASTM E1300 for the design of enamel coated glass plates. This controversy has largely been confined to enamel coated heat-strengthened (HS) glass.
Much of the controversy that has developed regarding the use of ASTM E1300 to specify the uniform load resistance of enamel coated glass is apparently the result of a lack of understanding that the glass thickness selection charts presented in ASTM E1300 are based on the performance of in-service glass and not freshly manufactured glass.
Results of in-service glass strength tests conducted by Beason [6] showed that the strength of in-service glass is significantly less than freshly manufactured glass. Since this initial testing by Beason, additional testing has confirmed that the strength of in-service glass is in fact significantly less than that of freshly manufactured glass [7]. The in-service strength reduction has been reported to be as much as 50% when compared to freshly manufactured glass [7,8].
The fact that the strength of in-service glass is significantly less than that of freshly manufactured glass was one of the primary drivers for the original development of ASTM E1300. It is clearly stated in the Significance and Use section of ASTM E1300 that use of the practice assumes that “the surface condition of the glass is typical of glass that has been in service for several years, and is weaker than freshly manufactured glass due to minor abrasions on exposed surfaces” [5].
Therefore, if the applicability of ASTM E1300 to enamel coated glass is to be challenged, it must be on the basis of a comparison of the strength of enamel coated glass to the in-service strength of uncoated glass, as defined in ASTM E1300, and not the freshly manufactured strength of uncoated glass.
As stated above, most of the current controversy regarding the strength of ceramic enamel coated glass is focused on the performance of HS enamel coated glass. Therefore, it is important to have a clear understanding of the ASTM E1300 treatment of HS glass. Throughout most of the 20th century, glass thickness selection criteria presented in the United States incorporated a strength factor of 2.0 for HS glass. It was well understood in the glass design community at the time that the 2.0 HS strength factor was based on linear stress analyses and the conservative assumption that the level of residual surface compression for heatstrengthened glass would meet the minimum required value of 3,500 psi.
At the time that ASTM E1300 incorporated glass thickness procedures for HS glass, full discussions and debates were conducted within ASTM to determine the best way to accomplish this. As a part of these discussions, results of research conducted by Beason were considered [9]. These results included glass thickness selection charts corresponding to in-service glass with minimum residual surface compressions of 3,500 psi.
It was shown that the wellestablished HS strength factor of 2.0 provides a solid lower bound across the full range of glass sizes presented in ASTM E1300 [9]. Further, it was shown that for many glass geometries, a much higher HS strength factor could be justified [9]. This coupled with the fact that virtually all HS glass is fabricated with residual surface compressions that are significantly greater than the required minimum of 3,500 psi leads to the unavoidable conclusion that the ASTM E1300 treatment of HS glass is very conservative from a strength point-of-view.
This fact was fully understood by those involved with the inclusion of HS glass in ASTM E1300. When statistical inferences are being made regarding the probability of breakage (POB) of glass, the two most important factors are central tendency and dispersion. Central tendency is usually quantified with the mean and dispersion is associated with the standard deviation. Of particular importance, in historic glass design procedures, is the ratio of the standard deviation to the mean.
This statistic is usually termed the Coefficient of Variation (COV) and it tends to remain relatively constant for a particular type of glass, regardless of the geometries tested. Historically, glass designers conservatively assumed that the COV for annealed (AN) and HS glass are on the order of 20-25% and 15%, respectively [10].
The design strength associated with a specified POB reduces as the mean of the strength data reduces, and the design strength for a specified POB increases as the COV decreases. The glass thickness selection criteria presented in ASTM E1300 is based on the Glass Failure Prediction Model (GFPM) developed by Beason [11].
It is often erroneously assumed that the GFPM is nothing more than the application of the well-known two parameter Weibull probability distribution function [12] as an alternative to the normal distribution function that was widely used in historic glass design procedures throughout the United States. However, the GFPM is actually based upon a relatively obscure statistical failure theory for brittle materials that was also developed by Weibull [13].
The GFPM incorporates two parameters, m and k, that represent the distribution and severity of flaws across the surface of a glass plate. It must be emphasized that these two parameters represent the occurrence and severity of surface flaws [11] and are not an inherent material property of glass that can be determined by testing small glass specimens in a controlled laboratory setting.
It can be shown that the m surface flaw parameter corresponds more directly to the COV, while the k surface flaw parameter corresponds more directly to the mean [14]. At the time that ASTM E1300 was introduced, the value of the m surface flaw parameter was set to 7 to reflect the historic understanding of the COV that was typically used for the design of AN glass and the value of k was adjusted to reflect the in-service reduction in mean strength [14].
As stated above, these surface flaw parameters represent the severity and distribution of surface flaws and not the type of glass. Since there is little scientific reason to believe that HS glass attracts a different type of in-service surface damage than AN glass, it seems logical to assume that there would be no distinction between the populations of surface flaws associated with in-service AN and in-service HS glass.
Therefore, it is reasonable to use the in-service surface flaw parameters developed for AN glass to model HS glass provided that the residual surface compression is properly dealt with. If the GFPM is properly extended to the treatment of HS glass, it can be shown that the associated COV for HS glass reduces as the level of residual surface compression increases in a manner that is consistent with the historical design understandings discussed above. The surface flaw parameters that are incorporated into ASTM E1300 are representative of the character and distribution of surface flaws that were selected in the ASTM consensus process to be typical of in-service exposures [14].
The exact values selected were not the result of a curve fit to a particular set of data. Rather, the ASTM E1300 surface flaw parameters reflected the central tendency and dispersion of a wide group of data developed by industry and public interest groups combined with the collective judgment of those involved in the ASTM consensus process [14].
It is well known now, and at the time that ASTM E1300 was introduced, that if freshly manufactured glass is tested and analyzed for the best-fit surface flaw parameters, the values would be significantly different than those used in ASTM E1300. This notwithstanding, the ASTM E1300 surface flaw parameters were fully discussed and established through the ASTM consensus process and provide a demonstrably conservative set of glass thickness recommendations that retain strong continuity with the United States historical glass design process [14].
As discussed above, there are multiple levels of conservatism built into ASTM E1300 with regard to the treatment of HS glass. The inherent conservatisms built into ASTM E1300 with respect to HS glass makes it highly unlikely that enamel coated glass will have a lower design strength than that represented in ASTM E1300.
Full-Scale Test Results of Enamel Coated Glass Plates
The most direct procedure to determine if there are problems using ASTM E1300 to select the minimum thickness of enamel coated HS glass is to test a representative sample of full-scale, enamel coated HS glass plates and compare the design load thus determined to the corresponding design load presented in ASTM E1300. Either ASTM E1300 over predicts the strength of enamel coated HS glass or it under predicts the strength of enamel coated HS glass.
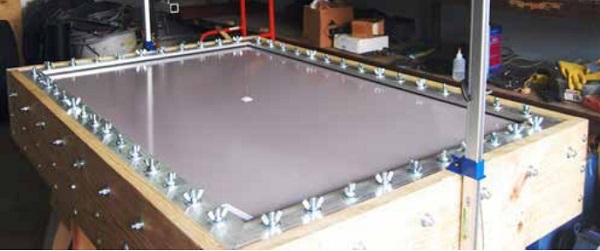
Any other comparison procedure involves projections and extrapolations. The first group of data discussed herein was collected by the writers. These data were developed by subjecting two sets of 40 x 60 x ¼ in. glass plates with four-sides of continuous support to linearly increasing uniform lateral loads to failure. The test setup is shown in Figure 1.
One set of specimens involved uncoated HS glass and the other set of specimens involved enamel coated HS glass with average thicknesses of 0.224 and 0.226, respectively. The enamel coating on the second set of glass was a full coat across the entire surface of the glass. All of the glass specimens tested were taken from the same batch of freshly manufactured glass. The glass plates were tested with the coated side in tension.
The test statistic of primary interest was the 3-second equivalent duration breakage load for each glass plate. Standard understandings of “static fatigue” were used to convert the failure strength data measured to equivalent 3-second durations [8]. Statistical analyses were used to determine the equivalent mean 3-second breakage load, the associated standard deviation and COV, and the equivalent 3-second duration failure load corresponding to a POB of 8 lites per 1,000.
These analyses were performed for both the coated and the uncoated specimens. Calculation of the equivalent 3-second duration failure load corresponding to a POB of 8 lites per 1,000 was accomplished using standard normal distribution assumptions. In addition, the residual surface compression was measured for each specimen. These data are presented in Table 1 [12].
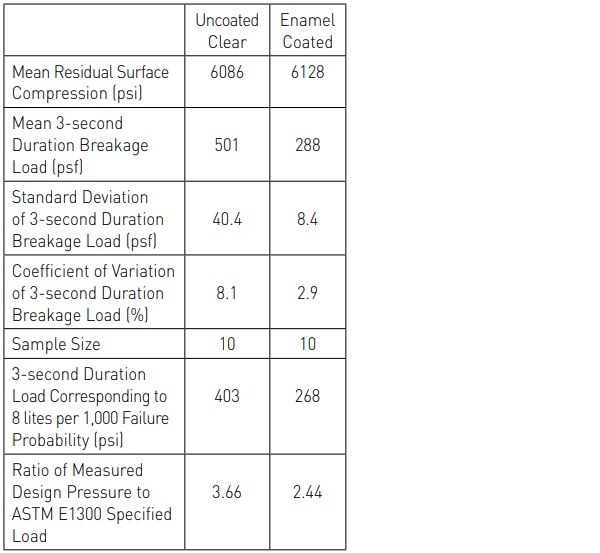
The information presented in Table 1 is extremely interesting. First, it can be observed that the mean 3-second duration equivalent failure load of the enamel coated specimens is about 43% less than that for the uncoated specimens. This strength reduction is on the order of that which has been reported for in-service glass as discussed above [7,8].
The COV of the uncoated specimens was determined to be 8.1%, while the COV for the coated specimens was determined to be 2.9%. This is a tremendous difference. As stated above, the COV for HS glass has been historically assumed to be closer to 15% for design purposes. This means that the measured COV for enamel coated HS glass is about 5 times less than the COV that has historically been assumed for the design of uncoated HS glass. An extremely low COV tends to be an emerging characteristic of enamel coated HS glass that is supported by a wide range of testing [1,2,3,4].
As stated above, statistical techniques were used to estimate the loads corresponding to a POB of 8 lites per 1,000 assuming the data are normally distributed. It was found that the design load is 403 psf for the uncoated HS glass and 288 psf for the enamel coated glass. This means that the design load for the enamel coated HS glass is about 29% less than that for the uncoated glass.
While this comparison is of some interest, it has no bearing on the use of ASTM E1300 for specifying the appropriate thickness of enamel coated HS glass. If the glass thickness selection charts presented in ASTM E1300 are consulted, it is found that the in-service design load corresponding to a POB of 8 lites per 1,000 for a 40 x 60 x ¼ in. AN glass plate is approximately 55 psf [5]. Then, if a factor of 2.0 is applied to this value, as directed for HS glass, it can be determined that the ASTM E1300 design load for a 40 x 60 x ¼ in. HS glass plate is 110 psf [5].
If this information is combined with the data presented in Table 1, it can be shown that the measured design load for uncoated, 40 x 60 x ¼ in. HS glass is about 3.7 times greater than is required by ASTM E1300. This is the case because of the inherent conservatisms discussed above. In addition, it can be seen that while the enamel coated HS glass is weaker than freshly manufactured clear HS glass, it is still more than 2.4 times greater than it has to be to comply with ASTM E1300.
It is difficult to imagine how this can be considered a problem. The second group of full-scale data discussed herein involved 38 x 76 x ¼ in. glass plates with four-sides of continuous lateral support that were subjected to an increasing lateral pressure until failure [4]. These tests involved five different sets of specimens. The first set of glass specimens was uncoated HS glass.
The other four sets of glass specimens had different patterns of enamel coatings. The second set had a dot pattern that covered 40% of the surface, the third set had a line pattern that covered 50% of the surface, the fourth set had a hole pattern that covered 60% of the surface, and the fifth set had a uniform coating with 100% coverage. Complete details of the specimens and testing methods are presented elsewhere by Berger et al. [4].
Berger et al. presented processed data including the mean equivalent 3-second breakage load, the associated standard deviation and COV, the percent reduction in strength compared to uncoated glass, and the equivalent 3-second duration failure load corresponding to a POB of 8 lites per 1,000 for both the coated and the uncoated specimens. Calculation of the equivalent 3-second duration failure loads corresponding to a POB of 8 lites per 1,000 was accomplished by Berger et al. by calculating unique m’s and k’s for each data set. These data are presented in Table 2. [4]
![Table 2. Equivalent 3-Second Duration Breakage Load Statistics for 38 x 76 x ¼ in. HS Glass Plates. [4]](/sites/default/files/inline-images/Tab2_20.jpg)
If the glass thickness selection charts presented in ASTM E1300 are consulted, it is found that the in-service design load corresponding to a POB of 8 lites per 1,000 for a 38 x 76 x ¼ in. AN glass plate is approximately 41.8 psf [5]. Then, if a factor of 2.0 is applied to this value, as directed for HS glass, it can be determined that the ASTM E1300 design load for a 38 x 76 x ¼ in. HS plate is approximately 83.6 psf [5].
This means that the design load for the 38 x 76 x ¼ in. uncoated HS glass is about 3.25 times greater than is required by ASTM E1300. In addition, it can be seen that while the enamel coated HS glass specimens are weaker than freshly manufactured, uncoated glass, the ratios of the reported design loads of the enamel coated HS glass specimens compared to that required by ASTM E1300 range from 2.02 to 2.58.
Therefore, in the worst case situation, the enamel coated HS glass is more than 2.0 times stronger than it has to be to comply with the requirements of ASTM E1300. Again, it is difficult to imagine how this can be considered to be a problem.
Conclusions
Presented above are the results of fullscale testing performed on two independent groups of enamel coated HS glass plates to evaluate their load resistance and compare these results to information presented in ASTM E1300. This testing involved one group of specimens tested by the writers, and one group of specimens tested by Berger et al. [4]. All glass tested was freshly manufactured HS glass. For both groups of glass plates tested, it was determined that the mean strengths of freshly manufactured enamel coated HS glass range from 29% to 48.3% less than the analogous mean strength of uncoated HS glass.
All glass design procedures in common use in the United States since the middle of the last century have incorporated central tendency and dispersion into the process to estimate either design stresses or design loads to meet a specified POB. In general the design strength corresponding to a specified POB, such as 8 lites per 1,000, is directly proportional to the mean strength and inversely proportional to the COV of the strength data. Thus, as the mean strength decreases, the design strength decreases, and as the COV decreases, the design strength increases.
One observation that needs to be emphasized with respect to the performance of enamel coated HS glass, regardless of manufacturer or test organization, is that the attendant COV of enamel coated HS glass seems to be significantly less than is the case with uncoated HS glass and is substantially less than the COV traditionally assumed for the design of uncoated HS glass. This trend compensates to some extent for the reduction of the mean strength of enamel coated glass compared to uncoated glass.
The fundamental assumption incorporated in ASTM E1300 is that glass strength is referenced to the strength of in-service glass and not the strength of freshly manufactured glass [5]. Therefore, evaluation of the design strengths of the enamel coated glass must be made with respect to the in-service design strengths derived from ASTM E1300 and not the measured strengths of freshly manufactured glass.
Results of the full-scale plate tests presented herein shows that the measured design loads for enamel coated HS glass associated with a POB of 8 lites per 1,000 range from about 2.0 to 2.73 times greater than is required to be in compliance with ASTM E1300. Therefore, it is concluded that the types of enamel coated HS glass that were investigated by the two groups of independent researchers presented herein meet all requirements for ASTM E1300 and that a reduction factor is not warranted.
The only issue that is not addressed in the data presented herein is the effect of in-service exposures on the long-term strength of the enamel coated HS glass. Based upon the collective experience of the writers, it seems clear that the in-service strength reduction incorporated in ASTM E1300 is largely the result of the accumulation of mechanical damage over years of in-service exposure. This damage consists of scratches, pits, abrasions, etc. that occur as the result of things such as cleaning, human contact, windborne debris, etc. Further, the writers are not aware of any credible evidence that other noncontact in-service exposures such UV exposure significantly reduce the strength of glass.
Whatever is responsible for the reduction in the mean failure strength of enamel coated glass, it is clear that once the enamel coating has been applied it provides a protective barrier over the coated surface that should make it more difficult for the glass surface to accumulate additional mechanical damage.
In addition, most enamel coated HS glass is used in spandrel applications where the coated surface is protected from in-service mechanical exposures that are believed to be the cause of the in-service strength reduction incorporated into ASTM E1300. At this time there is no credible evidence to suggest that the enamel coated glass surface will experience additional mean strength reductions with in-service exposure.
Finally, before enamel coated glass plates of the type discussed herein fall out of compliance with ASTM E1300, the strength of the enamel coated HS glass would have to be reduced by another 50% as the result of in-service exposures. This does not seem realistic. Based upon information presented herein, it can be concluded, at this point, that there is no technically defensible reason to include a strength reduction factor in ASTM E1300 for the design of enamel coated HS glass that is subjected to uniform lateral pressure loads.
References
[1] Natividad, K., Fonseca, J.C., Erickson, B., Morse, S.M., and Norville, H.S. (2016), “Bending Tests of Heat Treated Glass with Ceramic Frit”, GlassCon Global, pp165-172.
[2] Maniatis, I. and Elstner, M. (2016), “Investigations on the Mechanical Strength of Enameled Glass”, Glass Struct. Eng., Springer, pp 277-288.
[3] Elstner, M. and Maniatis, I. (2016), “Enameled Glass – New Research Studies GlassCon Global, pp 69-76.
[4] Bergers, M., Natividad, K., Morse, S.M. et al. (2016), “Full Scale Tests of Heat Strengthened Glass with Ceramic Frit”, Glass Struct. Eng., Springer, pp 261-276.
[5] ASTM Standard E1300, (2012), “Standard Practice for Determining Load Resistance of Glass in Buildings,” E 1300, ASTM International, West Conshohocken, PA.
[6] Beason, W. L., (1980), “A Failure Prediction Model for Window Glass”, Ph.D. Dissertation, Texas Tech University, Lubbock.
[7] Norville, S.H., and Minor, J.E., (1985), “Strength of Weathered Window Glass”, American Ceramics Society Bulletin, Vol. 64, No. 11, pp 1467-1470.
[8] Beason, W.L., and Lingnell, A.W., (2000), “Emerging Uses for Window Glass”, Emerging Materials for Civil Infrastructure – State of the Art, ASCE, Reston, VA, pp 190-216.
[9] Beason, W.L., (1993), “Development of a Failure Prediction Model for Heat-Treated Glass”, Final Report submitted to Cardinal IG, W. Lynn Beason, Ph.D., P.E., Engineering Consultant, College Station, TX.
[10] ASTM Standard E997, (1984), “Standard Test Method for Structural Performance of Glass in Exterior Windows, Curtain Walls, and Doors Under the Influence of Uniform Static Loads by Destructive Methods”, E 997-84, Philadelphia, PA.
[11] Beason, W.L. and Morgan, J.R., (1984), “Glass Failure Prediction Model”, Journal of Structural Engineering, ASCE, Vol. 110, No. 2, pp 197-212.
[12] Ostle, B. and Mensing, R.W. (1975), Statistics in Research, 3rd Edition, The Iowa State University Press, Ames, IA.
[13] Weibull, W., (1939), “A Statistical Theory of the Strength of Materials, Handlinger NR 151, Royal Technical University, Stockholm.
[14] Beason, W.L. and Norville, H.S., (1989), “Development of a New Glass Thickness Selection Procedure”, Proceedings 6th U.S. National Conference on Wind Engineering, Vol II, University of Houston, Houston, TX.