Authors: Vlad-Alexandru Silvestru, Zhikang Deng, Julien Michels, Lingzhen Li, Elyas Ghafoori & Andreas Taras
Source: Glass Structures & Engineering | https://doi.org/10.1007/s40940-022-00183-z
Abstract
Previous research has evidenced that by adding a ductile reinforcement on the tension side of a glass beam, for instance by adhesive bonding, its post-cracking behaviour and redundancy were improved, while an additional pre-stressing of this reinforcement further helped to increase the initial cracking resistance. Past investigations used steel tendons or stainless steel strips, which required rather complex setups and procedures for mechanical pre-stressing. This study aims to introduce an easier-to-apply procedure with strips made of an iron-based shape memory alloy (Fe-SMA), which has the property of remembering its initial shape after a phase transformation from austenite to martensite. The Fe-SMA strips can be anchored to a parent structure as pre-strained strips, in case of a glass substrate by adhesive bonding. After activation of the Fe-SMA through a heating and cooling process, a tensile stress is generated in the strip, which applies a compressive stress field into the parent structure.
This work discusses the results from first feasibility investigations dealing with the choice of adhesive and identifying a suitable activation procedure for Fe-SMA strips adhesively bonded to glass elements. The effective bond length, which needs to be considered when defining the anchorage length, was determined for two structural adhesives. While for the high-strength, brittle 2c-epoxy adhesive SikaPower®-1277, shorter bond lengths of a little more than 120 mm were sufficient, for the more ductile 2c-methacrylate adhesive Araldite® 2047-1, longer bond lengths were necessary for the same load level (more than 240 mm). Furthermore, an activation procedure by electrical resistive heating was applied, which (i) allowed sufficient heating of the Fe-SMA for activation, (ii) avoided too high instant temperature changes in the glass and (iii) did not affect the required anchorage bond length.
Introduction
In the past twenty plus years, an increase in structurally used glass elements can be observed. This is for example the case for supporting structures of medium-size transparent facades in the form of glass fins or in the case of walk-on glazing in the form of glass stairs. To improve the residual load-carrying capacity as well as to obtain a safer failure mode of the brittle material glass, laminated safety glass (LSG) is used nowadays for such elements. The residual load-carrying capacity of LSG, which depends on the type of glass and on the stiffness of the interlayer material, is significantly lower than the initial load-carrying capacity. Furthermore, load cases without the exterior glass plies are often considered in the structural design, since it is assumed that they might be damaged accidentally or by vandalism. Therefore, a certain over-dimensioning is taking place in current practice.
This contribution proposes a partially novel and easy-to-apply method for (i) increasing the structural resistance, (ii) ensuring a ductile failure mode and (iii) reaching an increased residual load-carrying capacity by using an iron-based shape memory alloy (Fe-SMA, see Sect. 2.2 for details on the material) for post-tensioning glass elements. Strips made of this Fe-SMA, which has the property of remembering its initial shape after a crystal lattice transformation from austenite to martensite, are fixed in a pre-strained state to the glass elements by adhesive bonding. Afterwards, a compressive stress is induced into the glass elements by activating/pre-stressing the Fe-SMA strips by heating them to a target temperature.
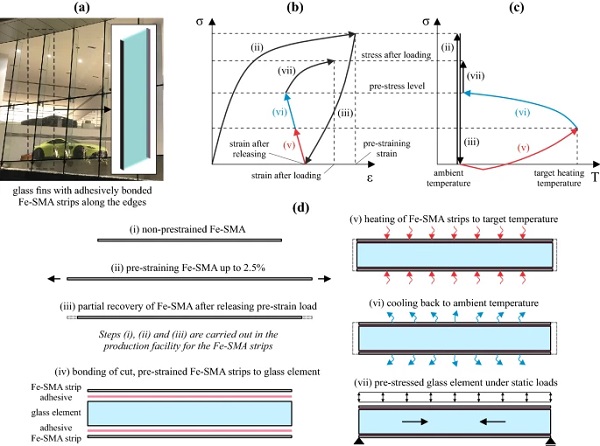
By this heating procedure, a certain fraction of the previously induced martensite transforms back to austenite, which translates into an effort to go back to its initial length before pre-straining. Figure 1a illustrates a potential application of this method for pre-stressing glass fins, while the necessary steps for this method along with qualitative stress versus strain and stress versus temperature developments in the Fe-SMA strips over the different steps are shown in Fig. 1b–d adapted from Ghafoori et al. (2017) and Izadi et al. (2018). The illustrations in Fig. 1d symbolize a glass fin from a transparent façade with Fe-SMA strips along both edges, since both of them can be under tension due to wind pressure and wind suction on the façade. In cases where tension occurs only on one side of the glass element, a pre-stressed Fe-SMA strip could be applied only on that side.
Efforts in increasing the structural resistance of glass elements, ensuring a rather ductile failure mode, and reaching an increased residual load-carrying capacity have been conducted in the past. For glass beams, composite systems with different materials (see overview by Martens et al. 2015) as well as reinforced and post-tensioned systems (see overview by Martens et al. 2016) have been investigated. By adding a ductile reinforcement on the tension side of a glass beam, for instance by adhesive bonding, its post-cracking behaviour and its redundancy are improved, while an additional pre-stressing or post-tensioning of this reinforcement helps to increase as well the initial cracking resistance.
For the previously investigated post-tensioned glass beams, steel or stainless steel rods have been used as tendons. Systems with rods only on one side (pre-cambering) or on both sides (uniform pre-stress) have been analysed. The rods have been positioned either internally, at the edge of the glass beams (e.g. Bos et al. 2004; Louter et al. 2006, 2013; Schober et al. 2004), or externally, laterally outside the glass beams (e.g. Engelmann and Weller 2016; Jordao et al. 2014; Louter et al. 2013).
More recently, Cupac et al. (2021a) used stainless steel tendons with rectangular cross-section, adhesively bonded to the glass edge (one-sided and two-sided) after being mechanically post-tensioned. For the one-sided version, Cupac et al. (2021b) presented an analytical method for determining the allowable pre-load in the tendon. All post-tensioned glass beams investigated previously required rather complex setups and procedures for mechanical pre-stressing. The proposed method is considered to potentially represent an easier-to-apply alternative in the future.
In addition, reinforced glazing panels have been investigated in the past for improving their initial and residual load-carrying behaviour under out-of-plane loading. Nhamoinesu et al. (2014) investigated medium-scale glass panels reinforced with steel profiles, Pascual et al. (2019) presented results on large scale steel-framed composite glazing panels, while Pascual et al. (2017) analysed adhesively bonded GFRP-glass sandwich components. However, no investigations have been conducted for post-tensioning of such elements.
This contribution focuses on the following essential aspects for proving the feasibility and the applicability of the proposed method: (i) relevant mechanical properties of the Fe-SMA, (ii) selection of suitable structural adhesives for bonding the Fe-SMA to glass elements, (iii) performance of linear adhesive joints between Fe-SMA and glass subjected to shear loading and (iv) procedure for activating the Fe-SMA.
Materials
The materials used in the investigations discussed in this paper are glass, the Fe-SMA and two adhesives assessed for bonding the Fe-SMA strips to glass. These materials and their relevant properties are described briefly in the following subsections.
Glass
The glass used for the experiments presented in this contribution was annealed soda-lime silicate glass, without any thermal or chemical tempering. For this glass, a Young’s modulus of 70,000 MPa, a Poisson’s ratio of 0.2, a characteristic tensile bending strength of 45 MPa, a thermal shock resistance of around 40 K and a thermal expansion coefficient of 9 × 10⁻⁶ K−1 are generally assumed based on EN 572-1 (2016). Tempered glasses have both higher strength values and a better thermal shock resistance. Therefore, it is assumed that, in general, the concept of applying a Fe-SMA strip for post-tensioning glass elements would work as well for tempered glass, if proved feasible for annealed glass.
Iron-based shape memory alloy (Fe-SMA)
Shape memory alloys (SMAs) are materials that are able to remember their shape after two lattice transformations. The first transformation is realized by deforming the material, while the second one is triggered by heating it. While different SMAs are already being used in various fields, like medical technology, space engineering or robotics, the iron-based shape memory alloy (Fe-SMA) memory®-steel investigated in this study was developed by re-fer AG especially for the construction sector with the objective to create permanent pre-stress forces in structural elements. The Fe-SMA is produced as austenite and then it is pre-strained (2.5%) in the production facility (transformation to martensite) and eventually delivered on site.
Here, it is fixed to the structural element and afterwards activated by heating, resulting in a second transformation partially back to austenite. Due to a restrained shape recovery, a pre-stress can be induced in the parent structural element. Currently the Fe-SMA is available as plates with a width of 120 mm and a thickness of 1.5 mm, as ribbed rebars with diameters of 10 mm and 16 mm or as rods with a diameter of 18 mm. The current applications of these products are strengthening existing concrete and steel structures, but they are also suitable for new structures.
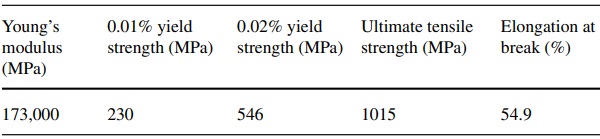
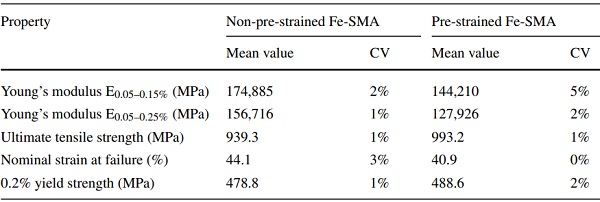
This contribution deals with the application of Fe-SMA plates (strips), adhesively bonded to structural glass elements. Ghafoori et al. (2017) presents selected mechanical properties obtained for non-pre-strained Fe-SMA (Fe-17Mn-5Si-10Cr-4Ni-1(V,C) SMA) strips in static tensile tests as given in Table 1. In terms of thermal elongation, the Fe-SMA behaves similarly to stainless steel with a thermal expansion coefficient of around 16 × 10−6 K−1.
Table 1 Selected mechanical properties of the Fe-SMA obtained from tensile testing by Ghafoori et al. (2017) - Full size table
Currently, pre-strained strips are fixed mechanically to concrete elements with bolts at their ends. The activation is carried out by heating with gas torch or with an infrared radiant heater. Whereas the former guarantees the threshold temperature of about 300 °C after which no recovery stress increase is possible (see Shahverdi et al. 2018), the latter allows for targeting a precise temperature level and hence also causes lower recovery stresses. Another activation method, which can be applied for Fe-SMA rebars and was assessed as well for Fe-SMA plates for strengthening metallic girders (Izadi et al. 2019), is by applying an electric current to the Fe-SMA (electrical resistive heating (ERH) technique). Izadi et al. (2018) provided details on this procedure. Resistive heating also gives the possibility to target specific temperature values.
Adhesives
The large variety of structural adhesives available on the market makes the selection process for novel applications difficult. For the present application of bonding pre-strained Fe-SMA strips to glass with subsequent pre-stressing of the glass by heating up the Fe-SMA strips, the following primary criteria were considered: (i) good bonding behaviour to both substrate materials (glass and Fe-SMA); (ii) high shear strength and shear stiffness; (iii) possibly high glass transition temperature. Furthermore, it was aimed to select at least one brittle and one rather ductile structural adhesive.
While, generally, a ductile material would be preferred for its ability to allow redistribution of stress peaks, brittle adhesives are sometimes advantageous because they exhibit higher shear strength and stiffness values. In later steps, additional criteria, like ageing, temperature variations, aesthetics (colour), etc. will need consideration. In the current steps, interior applications (e.g. glass stairs) or applications on the interior side of transparent insulated facades (e.g. glass fins) were mainly aimed.
Two structural adhesives available on the market were selected for these investigations, by considering the above criteria and their previous successful application with the substrate materials Fe-SMA and glass in other research projects:
- SikaPower®-1277: a two-component epoxy that showed a good behaviour in research on Fe-SMA strips bonded to steel substrates. Wang et al. (2021a) and Wang et al. (2021b) used it for shear connections between Fe-SMA and steel, while Cardoso et al. (2020) carried out experiments to characterize its strength and fracture behaviour. No previous use of this adhesive with glass substrates was found in literature.
- Araldite® 2047-1: a two-component methacrylate that was used previously with success for structural linear glass-metal connections in several research studies. Among others, Cupac et al. (2021a) used it for post-tensioned glass beams, while Nhamoinesu et al. (2014) and Pascual et al. (2019) used it for steel-glass composite panels.
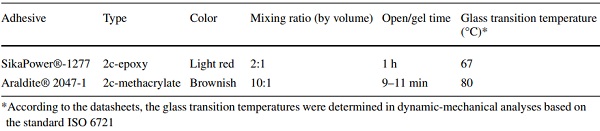
Selected relevant specifications from the datasheets for the two considered adhesives are provided in Table 2.
Table 2 Selected specifications for the investigated structural adhesives based on SikaPower®-1277 (2019) and Araldite® 2047-1 (2016) - Full size table
Methods
In this section, the applied methods for characterizing the materials and for analysing the proposed concept for post-tensioning glass elements by adhesively bonded Fe-SMA strips are described.
Uniaxial tensile tests on Fe-SMA
The Fe-SMA strips can be used non-pre-strained (austenitic phase) or pre-strained (martensitic phase). Uniaxial tensile tests were conducted for these two situations to determine variations in the mechanical properties. A double-tapered geometry of the tensile test specimens was used, as illustrated in Fig. 2a. This shape allowed a better clamping (by contact instead of friction) and ensured that there was no slip of the specimen during testing due to bad grip (see setup in Fig. 2b). The specimens were cut into shape from the same strips as those used for the lap-shear tests and the activation procedure (see Sects. 3.3, 3.4). The surfaces of the specimens were sandblasted, as this is the surface preparation later used for adhesive bonding.
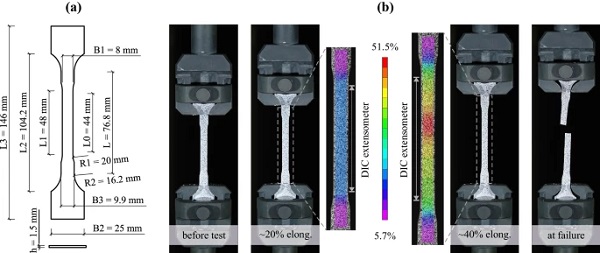
The tests were performed under displacement control on a Zwick universal testing machine at approximately 20 °C and 50% relative humidity. A displacement rate of 0.012 mm/s was used, determined to approximately correspond to a strain rate of 0.00025 s−1 according to EN ISO 6892-1 (2017). Beside the applied load (200 kN load cell) and the displacement of the jack, a digital image correlation (DIC) system was used to measure the displacements and the strains on the front surface of the specimens. A virtual extensometer was applied over a length of 44 mm of the specimen part with constant width to evaluate the strains (see Fig. 2b).
For the DIC measurements, a white flat paint and a black speckle pattern were applied on the specimens. For obtaining a fine enough speckle pattern, an airbrush system was used. A VIC-3D 9 system from Correlated Solutions, Inc. with two FLIR 12.3 MP (4096 px × 3000 px) cameras and Rodagon lenses with a focal length of 80 mm were used for the measurements. For a field of view with a height of 120 mm, the cameras were positioned at a distance of around 700 mm from the specimens and a distance of approximately 350 mm to each other. Four non-pre-strained and four pre-strained test specimens were evaluated for this contribution.
Uniaxial tensile tests on adhesives
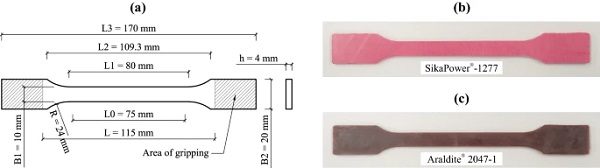
Although certain mechanical properties of the selected adhesives were available either in the product data sheets or in literature, a series of uniaxial tensile tests on the two adhesives was carried out to allow direct comparison. The test specimen of Type 1A according to EN ISO 527-2 (2012) was chosen for these tests (see geometry depicted in Fig. 3a). The specimens were manufactured with a Teflon mould in which the adhesives were injected from dual cartridges (195 ml cartridge for SikaPower®-1277, 480 ml cartridge for Araldite® 2047-1) by hand application guns. The test specimens were left to cure for 14 days in a climate chamber at 20 °C and 50% relative humidity before testing. Figure 3b, c show examples of test specimens for the two adhesives after demoulding.
The tests were carried out under displacement control on a Zwick universal testing machine at approximately 20 °C and 50% relative humidity. Two displacement rates were used to assess an eventual strain rate dependency of the material properties: 1 mm/min and 10 mm/min. To improve the grip when clamping the specimens, sheets of sandpaper with grit size P100 were bonded on the clamping areas of the test specimens with the fast-curing adhesive Z70 from HBK (generally used for bonding strain gauges). Because of an erroneous functioning of the used extensometer, the strains for evaluating the material properties had to be calculated as nominal strains based on the displacement between the grips of the machine (115 mm) according to the Method A in EN ISO 527-1 (2019).
For each specimen the tests consisted of two steps:
- Three load cycles were carried out to assess the stiffness of the adhesives. For these cycles, the specimens were first loaded to a defined load F1 of 400 N for SikaPower®-1277 and of 200 N for Araldite® 2047-1 and afterwards unloaded to a defined load F2 of 5 N for both adhesives.
- One cycle of loading until failure. Before this cycle, the specimens were released and re-clamped.
The number of specimens evaluated for each adhesive and loading speed are provided in Table 5 from Sect. 4.2.
Single-lap-shear tests on Fe-SMA strips bonded to glass
For determining the shear strength of adhesive joints, in most cases a single-lap joint is described in literature (Adams 2005; Habenicht 2009). In most of the previous investigations on adhesive connections between glass and metal substrates under shear loading, rather short joints with lengths of up to 50 mm have been used (e.g. Overend et al. 2011; Belis et al. 2011). These joint dimensions, however, do not allow determining the maximum effective bond length, which is of essential importance for the aimed application of linearly adhesively bonded Fe-SMA strips.
The effective bond length is the length of the adhesive joint over which the load is transferred from one substrate to the other through shear stress. The maximum effective bond length varies with the stiffness of the applied adhesive, but is generally longer than the 50 mm used in most of the previous investigations on single-lap shear joints. Silvestru et al. (2018) analysed joints of up to 200 mm length under shear loading, but did not evaluate the effective bond length.
For the lap-shear tests discussed in this contribution, the test specimens were designed similarly to those used by Wang et al. (2021a) for Fe-SMA-to-steel joints. Figure 4 shows the geometry and the dimensions of the test specimens. The specimens consisted of an annealed glass pane and a Fe-SMA strip, bonded together over a length of 300 mm with one of the two investigated adhesives. The width of the adhesive joints was 25 mm, while the thickness of the joints was 1.5 mm.
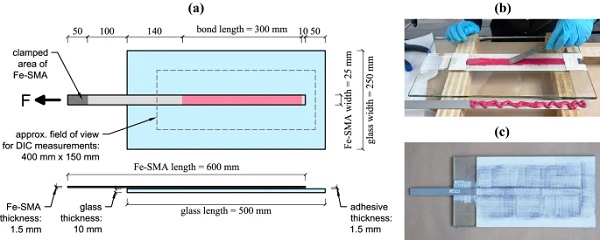
The Fe-SMA strips were cut from rolled plate material. Both the surfaces of the glass and the sandblasted surface of the Fe-SMA were cleaned with acetone before application of the adhesive. For Araldite® 2047-1, the glass surface was treated additionally with a primer (3 M VHB Silane Glas Primer as also used by Cupac et al. 2021a). First, the adhesives were applied from dual cartridges with hand application guns on both the glass and the Fe-SMA, then the adhesive beads were tooled to thin uniform layers and finally the two substrates were pressed together on thickness-ensuring spacers. The specimens were stored in a climate chamber at 23 °C and 50% relative humidity for 14 days before testing, allowing to have adhesives with the same age as for the tensile specimens presented earlier. Three specimens were tested per adhesive.
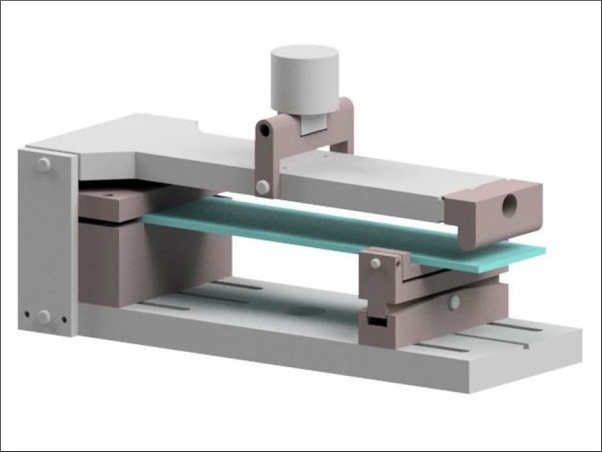
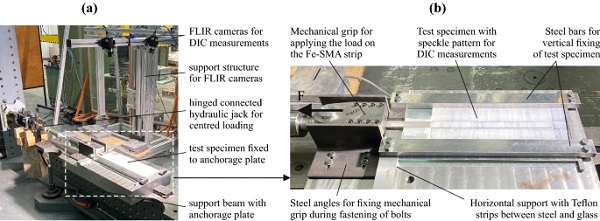
For these lap-shear tests, the same setup as used by Wang et al. (2021a) for Fe-SMA-to-steel joints was used. The setup with its main components is shown in Fig. 5a. The glass panes were fixed to a rigid support structure, while the Fe-SMA strips were mechanically clamped and pulled with a horizontally oriented, hinged connected hydraulic jack (see Fig. 5b). The tests were conducted under displacement control with a loading speed of 0.02 mm/s to allow observing the crack initiation and propagation. Beside the applied load and the displacement of the jack, a digital image correlation (DIC) system was used to measure the displacements and the strains on the top surfaces of the glass pane and the Fe-SMA strip.
Based on these measurements, (i) the relative slip between Fe-SMA strip and glass pane, (ii) the shear stress distribution at various stages of the test, and (iii) the effective bond length were evaluated. For the DIC measurements, a white flat paint and a black speckle pattern were applied on the top surfaces of the glass pane and the Fe-SMA strip. For the speckle pattern, a dot size of 0.33 mm was used based on the field of view of interest of around 400 mm × 150 mm. A VIC-3D 9 system from Correlated Solutions, Inc. with two FLIR 12.3 MP (4096 px × 3000 px) cameras and lenses with a focal length of 24 mm were used for the measurements. The cameras were positioned at a distance of around 800 mm to the specimen.
The evaluation of the DIC measurements was carried out based on the procedure presented by Wang et al. (2021a). To evaluate (i) the slip behaviour at the loaded end of the joint, (ii) the strain distributions in the Fe-SMA strip as well as (iii) the shear stress distribution in the adhesive along the length of the joint, a grid of nodes was defined in which the displacement and strain fields were evaluated. The grid with the position of the nodes is illustrated in Fig. 6.
The origin was set in the middle of the Fe-SMA strip at the loaded end of the adhesive joint, while the x-axis was defined in length direction of the joint and the y-axis perpendicular to it. Five rows of nodes were generated, three of them situated on the Fe-SMA strip surface along its middle axis and 7.5 mm on each side of the middle axis, and another two rows situated on the glass surface, one on each side of the Fe-SMA strip at a distance of 20 mm from its middle axis. On each row, 151 nodes were defined at a distance of 2 mm to each other.
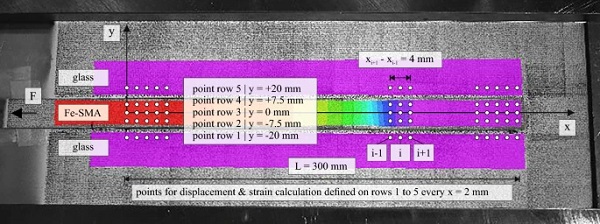
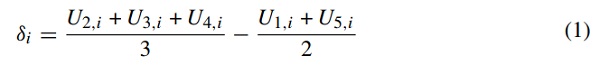
The displacement of the Fe-SMA strip relative to the glass surface, also known as the slip δi, was calculated at each position in the defined x-direction with Eq. (1). Here, the average displacement of the two nodes on the glass surface (U1,i + U5,i)/2 was subtracted from the average displacement of the three nodes on the Fe-SMA strip (U2,i + U3,i + U4,i)/3.
The strain development on the Fe-SMA surface and the shear stress development in the adhesive along the joint length of 300 mm were evaluated for six selected total displacement values (displacement done by the hydraulic jack, including elongation of the Fe-SMA strip and shear displacement of the adhesive). The strains on the surface of the Fe-SMA strip in length direction of the joints were calculated with Eq. (2), where the strains εj,i were engineering strains obtained from the DIC-measurements. A simplification was made here by assuming that the strains were constant along the width of the Fe-SMA, which was not fully correct based on the isolines shown in Fig. 14c, d. For this evaluation, a subset size of 21, a step size of 6 and a filter size of 25 were used in the software VIC-3D 9 (see Correlated Solutions 2022 for definitions).

Based on the strains determined on the Fe-SMA surface, the axial stress in the Fe-SMA strip was estimated by fitting the stress versus strain behaviour of the pre-strained Fe-SMA material. This was done based on the curves obtained from the uniaxial tensile tests on pre-strained Fe-SMA (see Fig. 10). By knowing the axial stress σi in the Fe-SMA strips at every 2 mm along the adhesive joint, a thickness independent shear stress in the adhesive τi was determined with Eq. (3). Here, tFe-SMA was the thickness of the Fe-SMA strip and the distance (xi+1 − xi+1) was chosen to 4 mm in the present investigations, in agreement with the suggestions in Wang et al. (2021a).

Activation of Fe-SMA strips bonded to glass by electrical resistive heating
Considering the previously used procedures for heating the Fe-SMA plates (see Sect. 2.2) and the investigated configuration of adhesively bonded Fe-SMA plates on glass elements, an activation of the Fe-SMA strips by electrical resistive heating was thought to be the most suitable. The feasibility of this procedure was assessed by so-called activation tests. For these tests, specimens consisting of a monolithic annealed glass pane with Fe-SMA strips bonded to both of its sides were used.
The geometric configuration and the dimensions of the specimens are shown in Fig. 7. This setup configuration was not reproducing a direct application, but was chosen to be as simple as possible for investigating the activation procedure. Both the adhesives SikaPower®-1277 and Araldite® 2047-1 were considered and the thickness of the joints was chosen to 1.5 mm. The specimens were manufactured in a similar way to the lap-shear test specimens.
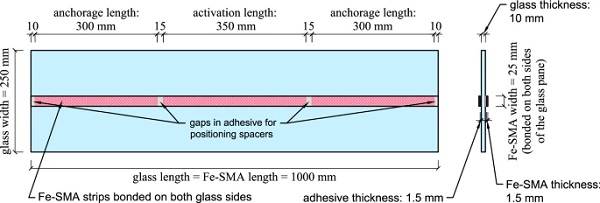
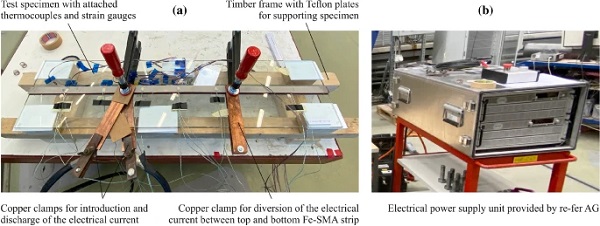
The Fe-SMA strips were heated over a predefined length of approximately 350 mm. This length was chosen in such a way that anchorage lengths of 300 mm were left at both ends of the strips. Over these anchorage lengths, it was aimed that the adhesive was not heated in order to not change its mechanical properties. The electrical current was applied via copper clamps with an electrical power supply unit provided by Re-fer AG. The copper clamps were fixed in such a way that a single circuit was obtained over both the top and the bottom Fe-SMA strips. A procedure with two circuits separately for the two strips was avoided due to concerns about ensuring an equal pre-stress of the strips. The activation test setup with all of its components is shown in Fig. 8.
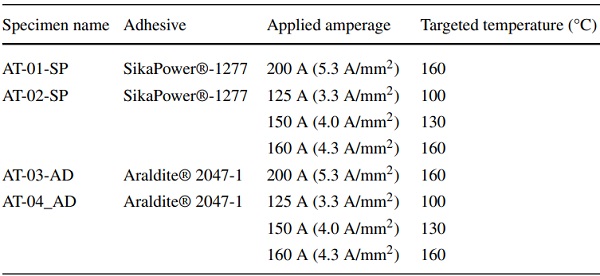
Four specimens were investigated, two for each adhesive. The applied amperage and the targeted temperatures for each of the specimens are provided in Table 3. First, the specimens AT-02-SP and AT-04-AD were activated, for which the amperage was increased empirically, with the objective not to heat up the glass (and the adhesive) too fast. The targeted end temperature of 160 °C was chosen based on previously used activation temperatures and was expected to lead to stresses in the strips of around 300 MPa (see Shahverdi et al. 2018). A higher temperature was avoided at this stage due to concerns in damaging the adhesive or the glass.
Table 3 Applied amperage and targeted temperatures for the activation test specimens - Full size table
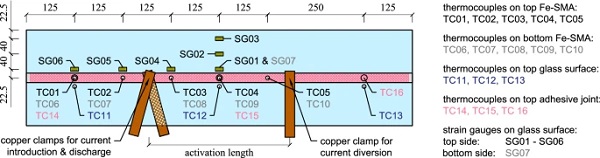
Sixteen thermocouples of type K were used to monitor the temperature development during heating and cooling on the exterior Fe-SMA surfaces, in the adhesive and on the top glass surface. The location of the thermocouples is shown in Fig. 9. Furthermore, seven strain gauges were positioned to monitor the strain development on the glass surface. Their position is as well illustrated in Fig. 9.
Results and discussion
The results evaluated from each of the performed test types are presented in this section and their relevance for future application of the Fe-SMA strips as adhesively bonded post-tensioning element on structural glass elements is discussed.
Tensile properties of the Fe-SMA
The results obtained from the uniaxial tensile tests performed on Fe-SMA specimens showed a slightly different behaviour of the pre-strained material compared to the non-pre-strained one. This can be observed from the representative stress versus strain relationships plotted in Fig. 10 for a non-pre-strained and a pre-strained specimen as well as from the determined mechanical material properties provided in Table 4. The strains were determined based on the relative displacement ΔL measured with a virtual extensometer over a length of L0 = 44 mm in the specimen part with constant width. For the displacement evaluation in the software VIC-3D 9, a subset of 21 and a step size of 6 were used (see Correlated Solutions 2022 for defining these values).
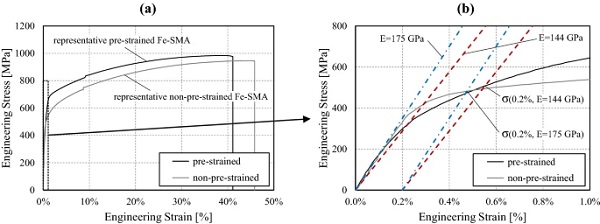
Table 4 Selected mechanical material properties as mean values and coefficients of variation (CV) determined based on the uniaxial tensile test results for the non-pre-strained and the pre-strained Fe-SMA specimens - Full size table
For the Young’s modulus, two different values were determined: one between 0.05 and 0.15% engineering strain and a second one between 0.05 and 0.25% engineering strain. The noticed differences indicated a certain non-linearity of the stress versus strain curves already before reaching the 0.2% yield strength. This confirmed previous observations by Lee et al. (2013) and Ghafoori et al. (2017).
The initial stiffness of the non-pre-strained material corresponded to a Young’s modulus value of around 175 GPa, which was similar to the value indicated by Ghafoori et al. (2017). When looking at the pre-strained material, its stress versus strain behaviour seemed to get non-linear at even lower stresses compared to the non-pre-strained one (see zoom-in diagram in Fig. 10b). For structural calculations/simulations, depending on the used material model (e.g. bi-linear), it might be necessary to use a lower Young’s modulus value in this case.
The determined nominal strains (elongations) at failure provided in Table 4 were in the range of previously published values, e.g. by Shahverdi et al. (2018). Elongations of around 40–45% indicated a very ductile material behaviour. This is an essential property for tendons to be used for post-tensioning glass elements (e.g. glass beams) in order to allow large deformations after glass breakage and before full collapse. The pre-strained material exhibited slightly lower elongations at failure compared to the non-pre-strained one. The observed differences were approximately in the range of the applied pre-strain of 2.5% and were less than 10% of the elongation at failure of the non-pre-strained material.
The determined strength values, being the ultimate tensile strength and the 0.2% yield strength, were slightly lower (up to around 5%) than values found in literature for the Fe-SMA (e.g. Ghafoori et al. 2017 or Shahverdi et al. 2018). Compared to stainless steels previously used for post-tensioning glass beams (e.g. in Cupac et al. 2021a), the determined ultimate strength values were higher and the 0.2% yield strength values lower. Based on the high ductility and the high ultimate strength, which are relevant for the post-fracture load resistance and the deformation capacity of post-tensioned glass elements, the Fe-SMA can be considered suitable for such applications.
The determined material properties seemed to be overall in a good agreement with previously published values. Besides indicating stable properties of the Fe-SMA material and its suitability to be used as a post-tensioning element, this fact also confirmed the suitability of the approach based on DIC measurements used for evaluating the tensile behaviour of such materials.
Tensile properties of the investigated adhesives
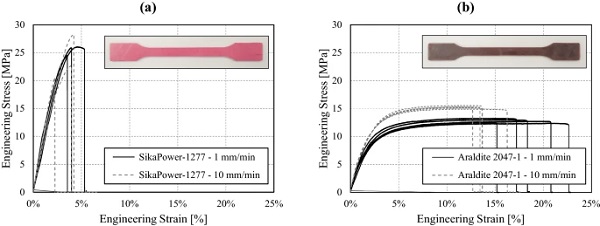
The results obtained from the uniaxial tensile tests performed for the two investigated adhesives showed significantly different material properties. While the epoxy SikaPower®-1277 was brittle with an almost linear behaviour until failure, the methacrylate Araldite® 2047-1 exhibited a ductile non-linear behaviour with substantial elongations before failure. These differences are illustrated by the stress versus strain curves from Fig. 11.
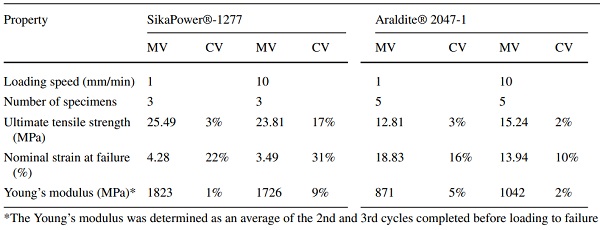
For calculating the Young’s modulus of the adhesives, the cycles performed before testing to failure were used. The Young’s modulus was determined as an average of the values determined for the second and third cycles between 0.05 and 0.25% engineering strain.
For discussing the determined material properties provided in Table 5 for the epoxy SikaPower®-1277, it has to be noted first that in the case of this adhesive, the tensile test specimen production was not ideal. Due to the rather high viscosity of the adhesive and the injection procedure into the mould with a hand application gun, isolated air inclusions in the specimens could not be avoided (this was not the case for the Araldite® 2047-1 specimens). This was the reason for the lower number of evaluated specimens and could as well be an explanation for the variation in the obtained results.
Nevertheless, the mean values provided in Table 5 for SikaPower®-1277 for the maximum engineering stress, the engineering strain at failure and the Young’s modulus are in the range of those provided by Cardoso et al. (2020), who also observed similar variations for the stress versus strain relationships. The slightly higher elongations and slightly lower Young’s modulus values from Table 5 compared to those determined by Cardoso et al. (2020) are with high probability because of calculating the strains with the grip-to-grip displacements instead of extensometer measurements.
Therefore, the values from Cardoso et al. (2020) should be regarded as more exact. For SikaPower®-1277, the two different applied displacement rates seemed not to have a significant influence on the mechanical properties. Nevertheless, no strong conclusion could be drawn here due to the wide scatter of the results, especially for the higher displacement rate of 10 mm/min.
Table 5 Selected mechanical material properties as mean values (MV) and coefficients of variation (CV) determined based on the uniaxial tensile test results for the investigated structural adhesives - Full size table
The average values determined for the maximum engineering stress, the engineering strain at failure and the Young’s modulus for Araldite® 2047-1 specimens tested with a displacement rate of 1 mm/min were in a good agreement with values available in literature for the same adhesive (e.g. Katsivalis et al. 2018; Cupac et al. 2021a). The Araldite® 2047-1 specimens tested with a higher displacement rate of 10 mm/min reached around 20% higher stresses, only around 75% of the elongations at break and an approximately 20% higher stiffness compared to those tested with 1 mm/min. These differences indicated a non-negligible strain rate dependency of the material.
The two investigated adhesives showed different material properties, SikaPower®-1277 being approximately two times stiffer and exhibiting an approximately two times higher strength, but at the same time allowing only almost five times smaller elongations compared to Araldite® 2047-1. However, both adhesives showed significantly higher strength and stiffness compared to more often applied structural silicone adhesives, used for bonding glass elements in structural sealant glazing systems. For shear connections between glass and the Fe-SMA—materials with different thermal expansion coefficients—both investigated adhesives could present advantages, depending on the exact application and boundary conditions, and are therefore potentially suitable.
Performance of the single-lap-shear connections
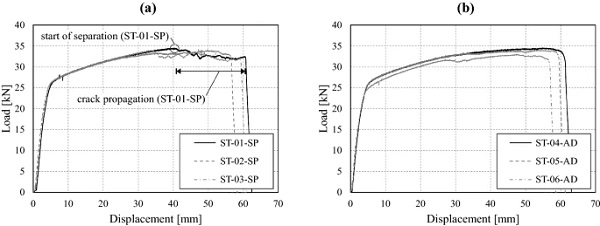
Three specimens were tested both for 1.5 mm thick joints with SikaPower®-1277 and for 1.5 mm thick joints with Araldite® 2047-1. The obtained load versus jack displacement curves are plotted in Fig. 12a for SikaPower®-1277 and in Fig. 12b for Araldite® 2047-1. At a first look, the curves exhibited for both adhesives a similar shape with a change of stiffness at loads of around 27 kN. Furthermore, especially for the specimens with SikaPower®-1277, less smooth parts of the curves with scattering load values could be observed after displacements of approximately 40 mm. The shapes of the curves in their smoother parts mainly depended on the behaviour of the pre-strained Fe-SMA strips, which could be confirmed by comparison with the shapes of the stress versus strain curves in Fig. 10a.
Moreover, the axial stress in the Fe-SMA strip at the point of stiffness change could be determined by σFe-SMA = F/A, with F = 27 kN being the recorded load and A = 25 mm × 1.5 mm = 37.5 mm2 being the cross section area of the Fe-SMA, to approximately 720 MPa. This corresponded to the stress value at which a significant change of stiffness was observed as well in the curves from Fig. 10a for the pre-strained Fe-SMA. The points at which the load started to scatter and the curves became less smooth indicated the start of separation between the Fe-SMA strip and the glass. The crack initiated at the loaded end of the adhesive joints and propagated through the 300 mm long joints towards their unloaded ends until total failure of the joints occurred. The scattering was more pronounced for the specimens with SikaPower®-1277 due to the more brittle behaviour of the adhesive.
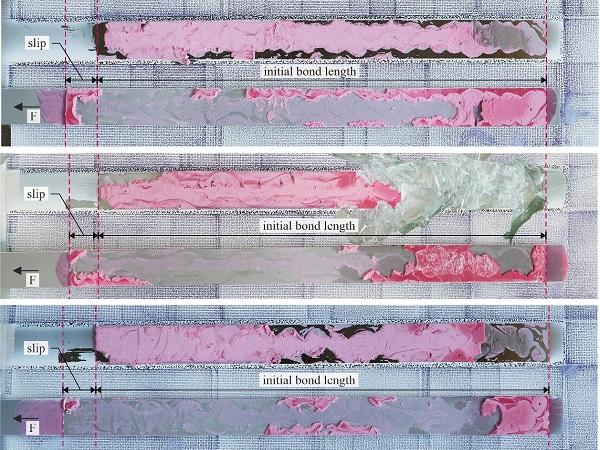
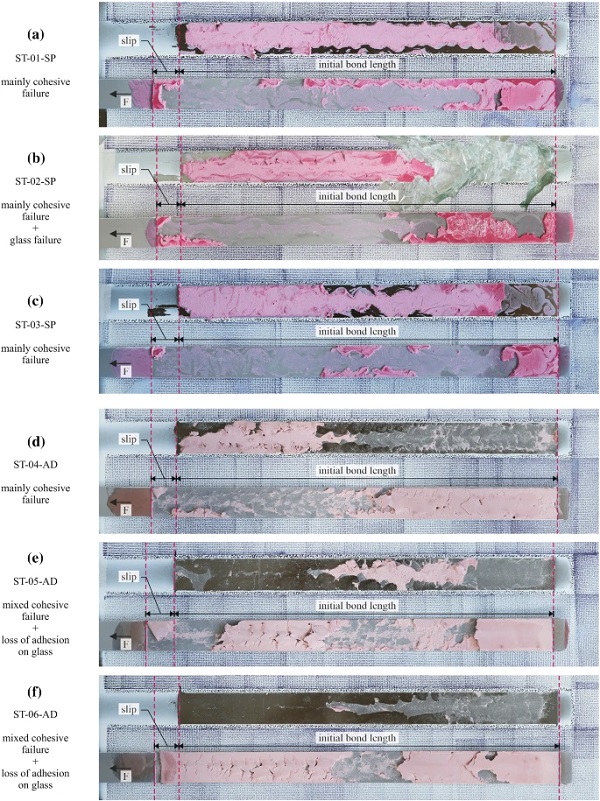
For structural adhesive joints, generally, a failure due to loss of adhesion to one of the substrates should be avoided. The failure patterns of the six evaluated specimens are illustrated in Fig. 13a, f. For the specimens with SikaPower®-1277 mainly cohesive failure was observed for all specimens. Most of the adhesive material remained bonded to the glass substrate. Nevertheless, a small film of adhesive could be identified as well on the Fe-SMA strips for all specimens.
For specimen ST-02-SP, glass failure occurred at the end of the test. Although, this might have been initiated by a small defect on the glass surface, glass failure cannot be excluded for brittle adhesives with high shear strength, if only a short bond length is available. In the case of the specimens with Araldite® 2047-1, mixed failure patterns of the adhesives were observed. Cohesive failure dominated, but non-negligible areas with loss of adhesion to the glass surface were noticed. This occurred, however, at rather high loads.
For better understanding about the behaviour of the adhesive joints and how the stresses were distributed in the Fe-SMA strip and in the adhesives, the performed DIC measurements were evaluated. Figure 14a, b show the relation between the relative slip at the loaded end of the adhesive joints and the tensile force applied on the Fe-SMA strip for one representative test specimen with each of the two adhesives (ST-03-SP for SikaPower®-1277 and ST-06-AD for Araldite® 2047-1). It was observed that the specimen with Araldite® 2047-1 exhibited a larger slip at lower loads, before the start of separation at the bonded end. This was in agreement with the more ductile behaviour of the adhesive. The parts of the curves in which the slip was growing while the force remained at the same level, indicated the propagation of the crack from the loaded bond end to the opposite one.
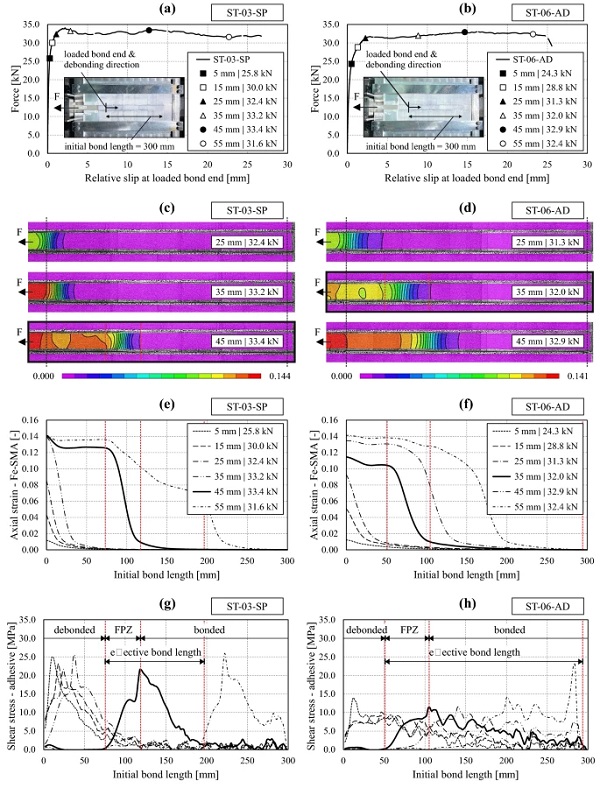
On each of the curves from Fig. 14a, b, six points were marked at selected total displacement values. For these points, the strain development on the Fe-SMA surface and the shear stress development in the adhesive are plotted in Fig. 14e, h along the joint length of 300 mm. For three of the points marked in Fig. 14a, b, the strain developments on the Fe-SMA strip in loading direction are provided as contour plots in Fig. 14c, d. The points were chosen in a way to have at least one point before separation started and at least one point during crack propagation. In Fig. 14e, f the strain distributions on the Fe-SMA strip are plotted as curves along the length of the joints for all six chosen points.
When looking at the distributions for the joint with SikaPower®-1277, it was observed that until a total displacement of 35 mm, the strains on the Fe-SMA were concentrated only in the area of the loaded bond end. Starting with the total displacement of 45 mm, a larger part of the Fe-SMA strip exhibited high strains, while the steep gradient of decreasing strains moved away from the loaded bond end. This indicated crack propagation. For the joint with Araldite® 2047-1, the gradient was less steep and started to move away from the loaded bond end already at 35 mm of total displacement. The less steep gradient was in agreement with the more ductile behaviour of the adhesive and indicated a distribution of the stresses over a larger area of the adhesive joint.
Figure 14g, h show the shear stress distribution over the length of the adhesive joints with SikaPower®-1277 and with Araldite® 2047-1 at the same six points chosen for different total displacements. The diagrams were positioned directly under the diagrams with the strain developments on the Fe-SMA strips along the same length in order to allow observing the correlations. For the specimen with SikaPower®-1277, the curve for a total displacement of 45 mm, and for the specimen with Araldite® 2047-1, the curve for a total displacement of 35 mm were chosen to explain the effective bond length and the different identified zones of the joints. Both of these points were chosen after separation between the Fe-SMA strip and the glass pane started.
The effective bond length is defined as the length of the adhesive joint over which stresses are transferred. Based on the completed lap-shear tests on the joints with an adhesive thickness of 1.5 mm, effective bond lengths of around 120 mm for SikaPower®-1277 and of around 240 mm for Araldite® 2047-1 were identified. The joints with SikaPower®-1277 exhibited higher shear stress values in the adhesive, but transferred the occurring stresses over a more concentrated area. These differences were in agreement with the different material behaviour of the two adhesives. The effective bond length is an essential feature to consider when choosing the anchorage length for adhesively bonded Fe-SMA strips. Generally, the anchorage length should be larger than the effective bond length to ensure structurally efficient joints that can fully exploit the strength of the selected adhesives.
Starting from the loaded end of the joint, the following three zones were observed in the diagrams showing the shear stress in the adhesive along the initial bond length:
- Debonded zone: this is the part of the joint in which separation between the Fe-SMA strip and the glass pane already occurred. This results in relatively high constant strains in the Fe-SMA and almost no shear stresses in the adhesive.
- The fracture process zone (FPZ): this is the part of the joint, in which fracture was already initiated. Therefore, the adhesive can still transfer some stresses, but they are below its strength. In the diagrams from Fig. 14e, f, this zone corresponds to the parts of the curves with high decreasing gradient, while in the diagrams from Fig. 14g, h, this zone can be identified as the part of the curves with increasing shear stresses.
- Bonded zone: this is the part of the joint in which the adhesive is still undamaged and transfers stresses up to its full strength.
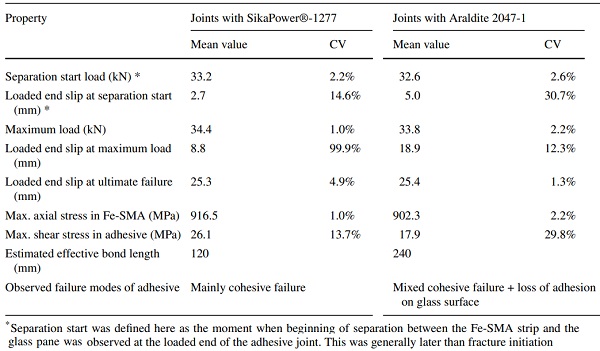
In addition to the results discussed above, which addressed primarily the qualitative behaviour of the joints with the two investigated adhesives, some quantitative values representing mechanical properties of the joints are provided in Table 6. It was observed that, while the determined maximum load and the load at separation did not vary a lot, their corresponding loaded end slips showed larger differences, especially for the joints with SikaPower®-1277. For the maximum load, this depended whether it was reached before or after the start of separation (see scattered parts of the curves in Fig. 12a).
The determined axial stress in the Fe-SMA showed that the strips were subjected to substantial plastic deformations before the adhesives started to fail. The determined mean values for the maximum shear stresses in the adhesives were in good agreement with shear strength values provided in the technical data sheets (see SikaPower®-1277 2019 and Araldite® 2047-1 2016). Although this indicated a good suitability of the approach based on DIC measurements chosen in this research, one should consider that despite a proper calibration and careful evaluation, DIC measurement data and values determined based on such data exhibit a certain scatter.
Table 6 Selected mechanical properties determined as mean values and coefficients of variation (CV) based on the single-lap-shear test results for linear Fe-SMA-to-glass adhesive joints - Full size table
Feasibility of the activation method by electrical resistive heating
The objectives of the activation tests were mainly (i) to evaluate the temperature development in the involved materials and (ii) to assess to what extent an activation of the Fe-SMA strips over a defined length is possible without influencing the adhesive bonding outside this length. This was done by evaluating the temperature measurements over a period of 20 min (1200 s).
The diagrams in Figs. 15a, b and 16a, b show the temperature developments on the Fe-SMA surface (average between TC03, TC04 and TC05 for the top strip and average between TC08, TC09 and TC10 for the bottom strip), on the top glass pane surface (TC12) and in the top adhesive joint (TC15) in the activated area for the four investigated specimens. The thermocouples, which were located outside the activated area, were not included in the diagrams from Figs. 15 and 16 because they recorded only a negligible change in temperature of less than 2 °C during the heating and the cooling phases.
This proved that by using the applied method based on electrical resistive heating, it was possible to activate the adhesively bonded Fe-SMA strips only in the desired area without influencing the defined anchorage zones of the adhesive joints. The adhesive in the anchorage zones was not heated and therefore its mechanical properties were not modified in these areas. This finding is of significant importance with respect to the temperature development of the adhesive in the anchorage zones, since it means that the loss of strength and stiffness at higher temperatures, which most of the available structural adhesives exhibit, is not relevant for transferring the occurring forces in the anchorage zones.
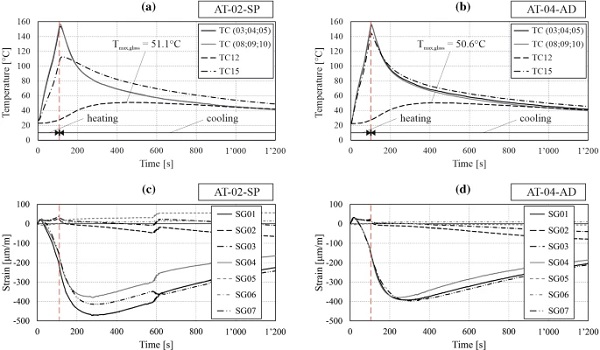
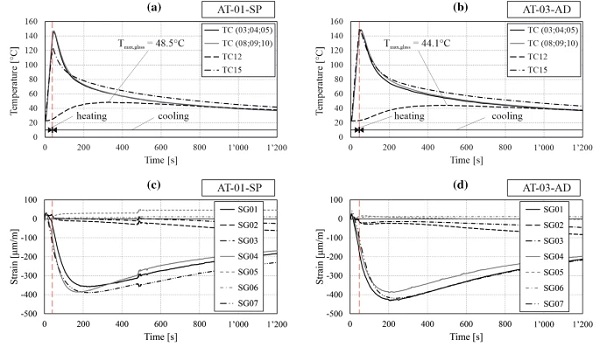
For the heating part, it was observed that the different heating procedures (different amperages) applied for the specimens AT-02-SP (Fig. 15a) and AT-04-AD (Fig. 15b) compared to AT-01-SP (Fig. 16a) and AT-03-AD (Fig. 16b) resulted in different heating rates (see Table 7). However, no influence on the cooling behaviour could be observed. Furthermore, both the diagrams in Figs. 15 and 16 as well as the values in Table 7 show that the adhesives reached their maximum temperatures approximately at the same time as the Fe-SMA, while the glass heated up with a certain delay. Here one has to consider that although the thermocouples on the glass surface TC12 were positioned as close as possible to the adhesive, it was not possible to measure the temperature on the glass surface directly below the adhesive.
Nevertheless, this delayed slower heating of the glass as well as the rather low size of the reached temperatures on the glass surface indicated that the applied activation procedure did not lead to thermal breakage of the annealed glass. For the adhesive, it was observed that Araldite® 2047-1 reached slightly higher temperatures than SikaPower®-1277. However, both adhesives reached temperatures that were higher than their glass transition temperatures. For polymeric adhesives as those used in these experiments, this might have degrading effects on their physical and mechanical properties. For cold-curing structural adhesives, Moussa (2011) observed a full recovery of the thermomechanical cohesive properties after heating and cooling across the glass transition temperature.
Damage of the adhesives or debonding could not be observed for the chosen geometry of the specimens with Fe-SMA strips bonded on both sides of the 10 mm thick glass panels. However, both local damages and local debonding in the activation area could not be excluded completely. Future investigations on specimens with suitable geometry (e.g. glass beams) should be conducted to assess the influence of heating and cooling across the glass transition temperature on the cohesive thermomechanical properties as well as on the behaviour of the adhesive-adherent interface.
Table 7 Selected detailed values from the temperature and strain measurements during the activation tests - Full size table
The diagrams in Figs. 15c, d and 16c, d show the strain developments at different points on the glass surface for the four investigated specimens. The kinks after approximately 600 s for AT-02-SP and 500 s for AT-01-SP were due to removing the copper clamps. It was observed, that for all specimens, the heating of the Fe-SMA strips lead to a simultaneous compressive straining of the glass in the activation area in direct vicinity of the strip (SG01, SG04 and SG07). During the cooling time, this initial rather local straining distributed over the cross section of the glass pane. This was indicated by a decrease of the compressive strains in direct vicinity of the strip (e.g. SG01) and an increase of the compressive strains towards the glass edge (SG02 and SG03).
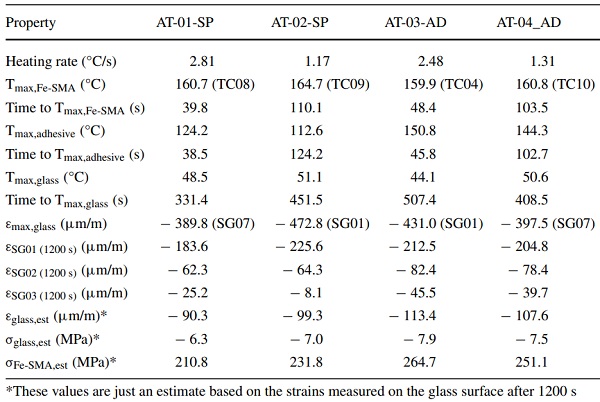
It is assumed that the compressive strains over the cross sections would reach a more or less uniform value after all the materials cool back to room temperature. Since the measurements were stopped after 1200 s, these values could only be roughly estimated based on the available data. The uniform compressive strain εglass,est was estimated by calculating an average between the strains measured with SG01, SG02 and SG03 after 1200 s. The determined values are provided in Table 7 and are probably slightly higher than the uniform strains that would remain after complete cooling to room temperature. Nevertheless, they are a suitable indicator of the expected size of the achievable strains. Based on these estimated strains, the approximate compressive pre-stress in the glass σglass,est and the approximate stress σFe-SMA,est in the Fe-SMA strips were calculated by Eq. (4) and Eq. (5), respectively.
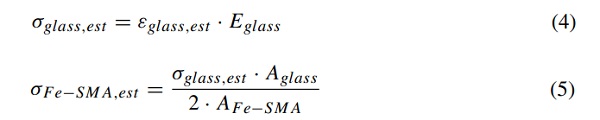
Here Eglass = 70 GPa was the Young’s modulus of glass, Aglass = 250 mm × 10 mm = 2500 mm2 was the cross section of the glass pane and AFe-SMA = 25 mm × 1.5 mm = 37.5 mm2 was the cross section of one Fe-SMA strip. The values in Table 7 show that the Fe-SMA strips were stressed to 200–250 MPa through the activation by electrical resistive heating, while a compressive pre-stress of around 7 MPa was applied on the glass pane by this procedure. In addition to the mechanical properties of the involved materials, the achievable pre-stress level depends on the cross-section ratio between glass and Fe-SMA strips and the temperature level to which the Fe-SMA strips are heated. Higher pre-stress values are expected to be possible, but this needs to be assessed experimentally in further investigations.
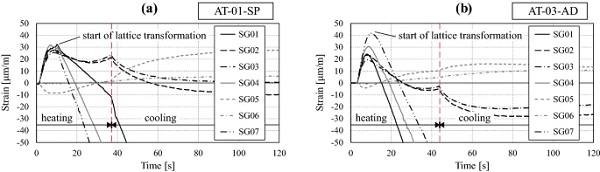
To explain the behaviour of the involved materials during the activation procedure, the first two minutes for specimens AT-01-SP (Fig. 17a) and AT-03-AD (Fig. 17b) were evaluated into more detail. It was observed that at the beginning of the heating, all strain gauges within the activation area recorded tensile strains, while the strain gauge outside the activation area, but in its vicinity (SG05), recorded compressive strains. This was because, first, all the materials expanded during heating. When the Fe-SMA reached a temperature of approximately 45 °C, the lattice transformation process started. This resulted in the change of strain direction that can be observed after approximately 10 s in the diagrams from Fig. 17. Another distinctive point in the strain versus time curves was observed as a kink after approximately 40 s. This was the moment when the temperature of approximately 160 °C in the Fe-SMA was reached and the electrical power supply was switched off.
Conclusions and outlook
The results discussed in this contribution prove the feasibility of and allow first conclusions on applying adhesively bonded Fe-SMA strips for post-tensioning structural glass elements:
- The Fe-SMA exhibited slightly different mechanical properties depending on being pre-strained or non-pre-strained. In future simulations and design concepts, the areas in which the Fe-SMA is pre-strained and those in which it is activated should be considered accordingly, since the different properties would slightly influence both stiffness and load-bearing capacity. For the activated Fe-SMA, similar properties to non-pre-strained Fe-SMA are expected, however this needs to be verified in future investigations.
- The effective bond length differed depending on the selected type of adhesive. While for the high-strength, brittle 2c-epoxy adhesive SikaPower®-1277, shorter bond lengths of a little more than 120 mm might be sufficient, for the more ductile 2c-methacrylate adhesive Araldite® 2047-1, longer bond lengths are necessary for the same load level (more than 240 mm). This needs to be considered when choosing the necessary anchorage length.
- The investigated activation procedure based on electrical resistive heating showed a high potential for the application of the Fe-SMA to post-tension structurally used glass elements. It was shown that this procedure allows inducing compressive stresses into the glass elements without damaging the glass or leading to failure of the adhesive joints in the anchorage zones. The size of reachable pre-stress and its positive effect on the structural behaviour of post-tensioned glass elements needs to be investigated in more detail based on defined applications (e.g. glass beams and/or glass panels). Furthermore, the development of a methodology to measure and/or control the reached pre-stress is necessary.
In addition to the above drawn conclusions and related necessary follow-up investigations when selecting an adhesive for application of the Fe-SMA together with glass, additional aspects (e.g. long-term behaviour, colour, environmental exposure to UV-radiation, moisture, temperature) need to be considered. Furthermore, the behaviour of the adhesives in the area of activation after heating and cooling needs to be investigated in detail regarding modified mechanical properties and debonding. In case of joints at the glass edge, future studies should address (i) the reduced annealed glass resistance in these areas and its influence on the bond strength and the effective bond length, as well as (ii) the interaction of the heated adhesive with interlayer materials.
Certain applications and boundary conditions might require to use different adhesives or even to develop/design different anchorage methods avoiding adhesive connections. A potential solution that could work without adhesive bonding and would be interesting to investigate would be fixing the Fe-SMA strips mechanically to custom metal parts at the ends of the pre-stressed glass elements and to transfer the compressive pre-stress loads by contact on the end glass edges via grouting. Moreover, future investigations should focus on static experiments and structural calculations on assessing the performance of glass elements (e.g. glass beams and glass panels) with adhesively bonded post-tensioned Fe-SMA strips in comparison to glass elements without such reinforcements.
Acknowledgements
The support of re-fer AG, Glas Trösch AG, Sika Schweiz AG and Huntsman Advanced Materials (Switzerland) GmbH in providing necessary materials for the test specimens is gratefully acknowledged. Furthermore, the authors would like to thank the laboratory staff of the Institute of Structural Engineering at ETH Zurich, the laboratory staff at the Structural Engineering Research Laboratory at Empa and re-fer AG for their support in performing the experiments. The commercial product names mentioned in this paper for the adhesives are provided only for the sake of factual accuracy, not as an endorsement of the products.
Funding
Open access funding provided by Swiss Federal Institute of Technology Zurich. This research was funded by Innosuisse – Swiss Innovation Agency through the innovation cheque application number 51447.1 INNO-ENG and was supported by re-fer AG.
Author information
Authors and Affiliations
Institute of Structural Engineering, ETH Zurich, Stefano-Franscini-Platz 5, 8093, Zurich, Switzerland
Vlad-Alexandru Silvestru, Zhikang Deng, Lingzhen Li, Elyas Ghafoori & Andreas Taras
re-fer AG, Riedmattli 9, 6423, Seewen, Switzerland
Julien Michels
Empa, Swiss Federal Laboratories for Materials and Technology, Structural Engineering Research Laboratory, Ueberlandstrasse 129, 8600, Duebendorf, Switzerland
Lingzhen Li & Elyas Ghafoori
Contributions
Conceptualization: V-AS, AT; Methodology: V-AS; Formal analysis and investigation: V-AS, ZD, LL; Writing—original draft preparation: V-AS; Writing—review and editing: V-AS, ZD, JM, LL, EG, AT; Funding acquisition: V-AS, JM, AT; Resources: JM, EG, AT; Supervision: V-AS, EG, AT.
Corresponding author
Correspondence to Vlad-Alexandru Silvestru.


 demonstrator at Glass Technology Live during Glasstec 2024 (© Cas Maertens).")