This paper was first presented at GPD 2023.
Link to the full GPD 2023 conference book: https://www.gpd.fi/GPD2023_proceedings_book/

Authors:
- Daniel Pfarr - Institute of Building Construction, Technische Universität Dresden, Germany
- Dr.-Ing. Michael Engelmann - Institute of Building Construction, Technische Universität Dresden, Germany
Abstract
The use of thin glass in construction promises a variety of potentials for a more sustainable use of resources. Innovative constructions can enable thin glass to become an important component of structural glass engineering. However, there is still a lack of in-depth knowledge and corresponding standards for a reliable and standardized use of thin glass. One particular challenge is the determination of the bending tensile stresses for building product standardization. Due to the low geometric stiffness, conventional test methods such as the four-point bending test can no longer be applied.
Alternative test methods have already been developed and investigated. Thereby, an increased influence of Poisson´s Effect with decreasing thickness of the glass has been suspected. The test specimens deform far beyond the small deformation field and activating non-linear behavior which leads to a significant shift from unidirectional to a multidimensional stress situation. Rather, it leads to a considerable bending along the width of the specimen, depending on the aspect ratio, thickness and the extent of the curvature.
This research investigates the influence of the geometric dimensions of a test specimen as well as the load magnitude on the stresses calculated by the linear elastic Euler–Bernoulli beam theory. For this purpose, an extensive parameter study is carried out by means of the finite element method. With more than 200 variants, the maximum stresses as well as their distribution over the width is compared. This leads to a more accurate understanding of the effect of lateral strain at large deformations and helps in the selection of geometry and a more realistic evaluation of ultimate stresses in thin glass.
1. Introduction
1.1. Bending Tensile Strength of Thin Glass
Thin glass has become an emerging field of research interest in the architectural glass industry due to its unique material properties and potential applications. With a thickness of usually 0,5 to 2 mm, thin glass can be used as a lightweight and transparent building material. Currently, glass thicknesses from 2 mm upwards are defined as architectural glass by the most recent standard DIN 18008 [2] and the approaching EU-wide regulation by Eurocode 10, which is being prepared by the pre-standard CEN-TS [4]. In order to determine the bending tensile strength, the established four-point bending test method according to its European standard EN 1288 3 [3] is used. With thin and high strength specimens (for example 3 mm fully tempered glass), there is a risk of slipping out of the supporting rollers before the maximum breaking stress is reached.
Considering even thinner glass and the expected higher strength of chemically toughened glass [5] with a laser-cut edge, this conventional test set-up can no longer be used to determine the bending tensile strength. To overcome this technical limitation, alternative methods and test equipment are being developed to determine the bending tensile strength for thin glass with a thickness of 0,5 to 3 mm and high expected breaking stresses of up to 400 N/mm2. According to very first studies [6], the traditional four-point bending test was scaled down to prevent the glass of slipping through the support rollers. Instead of the standardised support spacing of 1000 mm, 800 mm was considered suitable.
Furthermore, a buckling test was developed where two rotatable supporting rollers hold a vertical glass panel, which will be loaded by an in-plane force to generate a bending moment [6]. Neugebauer gives a summary of theoretical investigations and highlights that the approach of applying a constant bending moment by rotating the supporting rollers seems promising [7]. With the research by Oliveira et al. [8] the discussed buckling test was further investigated and its sensitivity to imperfection at the contact area between the glass specimen and the support rollers was underlined. In addition, numerical investigations of a four-point bending test with in plane loading as well as a pure tensile test were performed.
Particularly the pure tensile test seems to have some advantages over a bending test because it avoids geometric nonlinearities [8]. A comprehensive summary of the latest test methods and test equipment is provided by Zaccaria et al. [10]. The approach of applying a constant bending moment by rotating the support rollers resulted in the development of so-called clamp bender testing machines. The research shows very coherent and consistent experimental results of stresses (up to 230 MPa characteristic bending strength) with 1,1 mm chemically strengthened thin glass. Zaccaria et al. also emphasises, that geometric non-linearities have a significant influence on an accurate and consistent determination of the specimen’s strength.
“The uniformity of the stress along the specimen during the clamp bending test is only apparent: the large deformation leads to a bending along the width of the specimen, which is a function of the aspect ratio and the strength of the curvature” - This behaviour can named as “Poisson´s Effect”.
1.2. Poisson´s Effect
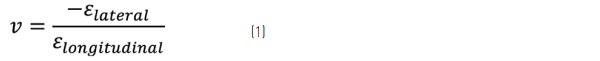
Poisson's Effect, described in its magnitude by the Poisson's Ratio (v), is a physical phenomenon that describes the relationship between the lateral and longitudinal strains of a material when subjected to an applied force and can be described with the following formula (1):
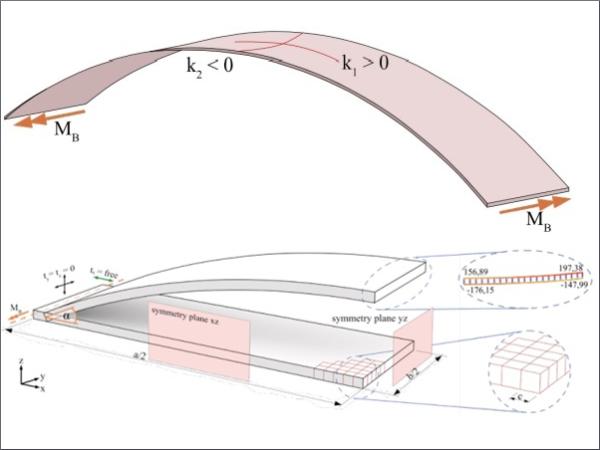
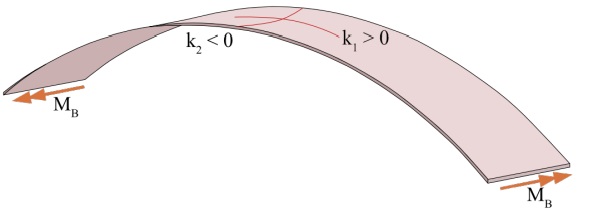
If a plate is bent uniaxially by an applied bending moment on the opposite sides, negative longitudinal strains occur on one surface of the plate and positive longitudinal strains on the opposite side. With a Poisson´s Ratio of glass of vglass=0,2 , each longitudinal strain unit will cause one-fifth negative lateral strain unit on the surface. Depending on the boundary conditions, lateral elongation may be restrained. This behavior will change the intended uniaxial curvature of the plate into a biaxial bending state resulting in the following depicted anticlastic shape in the center area of the specimen (Figure 1) with the two principal curvatures k1≠0 and k2≠0.
1.3. Problem Definition, Objective and Hypothesis
Not only the material-specific Poisson's Ratio, but also the geometry of the plate influences the intensity of the effect. Zaccaria et al. indicated by a simulation with the Finite Element Method (FEM), that Poisson´s Effect leads to stresses that are up to 12 % higher than the conventional calculation with the linear Euler-Bernoulli beam theory (Figure 2) [10]. It also became apparent, that the effect depends on the ratio of the width to length of the test specimen. A larger aspect ratio (1:2 > 1:10) seems to lead to larger deviations in this study.
![Figure 2: Difference between numerical and analytical calculated values for a specimen with 200 mm length, 1.1 mm thickness and variable width [10].](/sites/default/files/inline-images/Fig2_355.jpg)
This result would also correlate with the limitations of the linear beam theory used, which is only valid for theoretical beams without width at low deformations. The DIN EN 1288-3 [3] already considers the increased edge stress, caused by the restrained transverse strain, with a correction factor k in its calculation of the bending strength. Thereby, a homogeneous averaged stress distribution over the specimen cross section is assumed [1]. In addition to the two influences described, the loading (see Figure 2) and boundary conditions also affect the actual stress during a bending test.
This leads to the question, what is the effect of material property as well as test specimen geometry on the stress distribution in a test specimen and how can it be quantified correctly? Further, if the linear beam theory used so far, can still be used as a reasonable simplification for the calculation of the breaking stress of thin glass specimens with large deformation. The resulting objective of this paper is to quantify the geometric influence of the thin glass test specimens used at different loading steps by means of a Finite Element Analysis (FEA).
According to the theory of the Poisson´s Effect, the mentioned literature (see Figure 2) as well as the theory of plates and shells [9] we can assume the following hypothesis for deviation between analytical calculated values according to the linear beam theory and the numerical determined values:
- With decreasing width to length ratio, the deviation will increase.
- With decreasing thickness, the deviation will increase.
- With increasing load, the deviation will increase.
Numerical Analysis
2.1. Setup
The numerical simulation used in this study is intended to represent the thin glass bending test setup at the Technische Universität Dresden called “clamp bender” [10]. In order to ensure a reliable convergence of the system and a time efficient solution, the physical model was simplified and is shown in Figure 3. The geometry of the test specimen is represented as a quarter model through a surface. The lengths of the edges as well as the thickness are linked as parameters accordingly. With respect to the quarter model, symmetry axis are defined along each of the longitudinal and transverse directions. The support roller is defined by a horizontally unrestricted bearing and loads the specimen by rotation about its longitudinal axis. In order to ensure consistent element quality, shell elements with 8 knots are used, their edge length corresponds to the glass thickness (Figure 3 lower right corner).
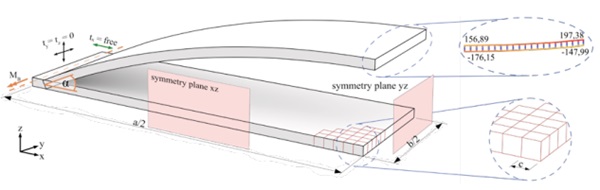
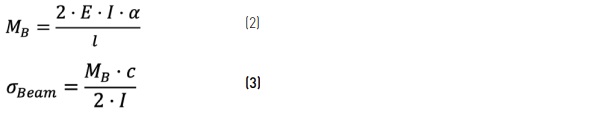
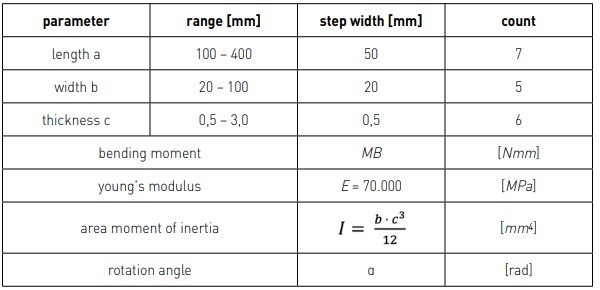
According to the defined objective of this research, the geometric parameters length, width and thickness are varied as summarised in Table 1. They cover possible thin glass specimen sizes suitable for the clamp bender. This results in 210 different geometric variants that can be evaluated at six load levels (α = 10 ° - 60 °). The maximum stress along the cross section of the test specimen at one half of its length can be evaluated (Figure 3 top right corner). With respect to Poisson’s Effect, the first principal stress (σ1,max) can be found at the upper edge of the bended specimen. This maximal value will be compared to the analytical calculation (σBeam) according to Navier´s formula (3).
2.2. Results - Deviation between Analytical and Numerical Calculation
2.2.1. Influence of Geometrical Parameters
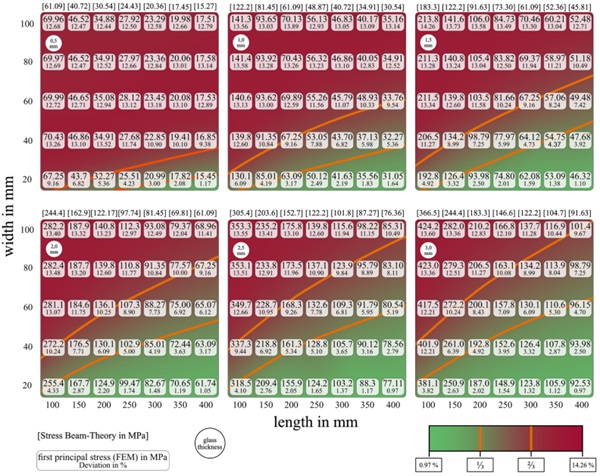
To obtain the percentage influence of lateral strain on the stress distribution, the results are here evaluated exemplary for the applied rotation angle of 10 °. In order to visualise the influence of the geometric parameters, the first principal stress (σ1,max) and its percentage deviation to the analytical calculation based on Euler-Bernoulli´s beam theory (σBeam) is shown in Figure 4. Since the calculated stresses are dependent on the length of the specimen, the values can be best compared in columns per glass thickness.
The maximum principal stress values obtained by the FEM show a deviation over the specimen width as expected. The magnitude of the deviation is indicated by an increasing value in the colour scale printed in Figure 4. It increases with the ratio between width and length as well as the thickness of the geometries. It can be noticed that the orange marked transition between low deviations (0,97 – 4,43 %) and high deviations (9,83 – 14,26 %) is rather small and a clear field of subdivision between appears. Depending on the width to length ratio of the geometry, a plateau between 11 – 14 % develops which is not further influenced by an increase in the affecting parameters. However, it can be seen that the green area with smaller deviations becomes larger with increasing glass thickness the area and inclination of the field of subdivision change.
2.2.2. Influence of Load Magnitude
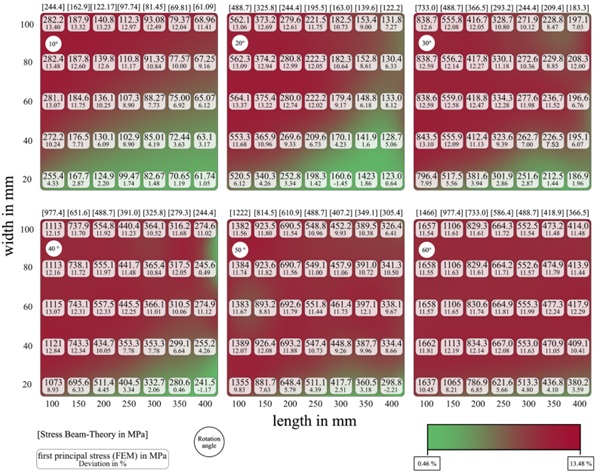
To investigate the influence of the load magnitude on the deviation between the analytical and numerical approach, the results are evaluated exemplary in Figure 5 for a thickness of 2 mm and variable load levels described by the rotational angle between 10 ° and 60 °. Again, the dependence of the aspect ratio can be observed. Furthermore, the red marked area of higher deviation becomes larger with an increasing load. The maximum deviation, however, is slightly reduced from about 13 % at 10 ° to about 11.5 % at 60 °. But the described plateau remains unaffected despite the increasing load.
Figure 5: Heatmap of the deviation between analytical calculation with Euler-Bernoulli Beam Theory and numerical simulation with variation in load magnitude by rotation angles from 10 ° to 60 ° for 2 mm specimen thickness.
3. Discussion
The results were evaluated regarding the initial hypothesis by considering two perspectives. The analytical calculation method used in practice according to Euler-Bernoulli's beam theory was used as a reference. The variation of the geometric parameters confirmed that compact test specimens with a small aspect ratio tend to respond more sensitive to the influence of transverse strain. However, this effect is strongly degressive and, depending on the glass thickness, converges to a deviation of 12 – 14 % between the calculation by FEM and Navier´s formula. This behavior also confirms the reported deviations published by Zaccaria et al. [10].
By changing the glass thickness, the limit at which high deviations are to be expected is shifted slightly and a wider range of possible aspect ratios with low deviation are possible. Therefore, it can be argued that the investigated influence is not only related to the area aspect ratio (b : a), but also the thickness c has to be taken into account in a volume aspect ratio (b : a : c). This assumption can be supported since Poisson's Ratio for an isotropic material like glass effects all three spatial directions equally. However, once the deviation plateau is reached, no significant influence of the glass thickness on the amount of percentage change can be identified.
Consequently, the effect has a certain threshold value. With the results obtained, the initial first and second hypotheses related to the geometric influence must be adjusted. They are not false in their general statement but require an important constraint that the influence of the geometric non-linearities does not exceed a limit value of 14 % in this study. The third hypothesis however, which described a direct correlation between load magnitude and the deviation between the used calculations, could not be reproduced here. As soon as the plateau described above is reached, depending on the geometry of the test specimen, an increase in the load does not lead to an increase of the assumed Poisson´s Effect. Although this statement can be made, the authors noted that a load defined by an angle of rotation should be reconsidered. The stress on the glass surface varies for each angle of rotation with the length and thickness of the test specimens. To better compare the effect of loading for different geometries, stress levels should be compared directly at certain levels which leads to changing angles of rotation.
How can the results obtained in this study help to improve the understanding of thin glass and its determination ultimate strength in the future? First, it must be mentioned that the method of testing leads to the inhomogeneous stress distribution discussed here. If the conventional test of the strength of glass by bending is maintained, geometric non-linearities have to be taken into account. When looking at thin glass, the investigations performed here showed that the effect of about 12 – 14 % can be quite relevant. But since a strong dependence of the geometric parameters can be verified, a specific consideration through the selection of a standardized test geometry based on Poisson´s Effect is not very practicable. As the analytical calculation considers the actual maximum stresses is conservative and on the safe side, the knowledge of the deviation is important but can be considered as additional safety.
With this knowledge, the linear EulerBernoulli beam theory can still be applied for the determination of bending tensile strength of thin glass. However, a correction factor comparable to DIN EN 1288-3 should also be considered for thin glass with a thickness of less than 3 mm. However, this research shows the differences between a simplified beam theory and the “actual” maximum stress calculated with the FEM. It is reasonable to assume that this difference is influenced by the material law, here called the Poisson´s Effect. But it does not necessarily have to be exclusive. According to the elastic plate theory for large deformations, additionally to the material law, further geometric non-linearities might influence the transverse strain.
4. Summary and Outlook
This paper investigates the influence of Possion´s Effect on the accuracy and applicability of the used linear elastic Euler-Bernoulli beam theory for the determination of the tensile bending strength of thin glass. Geometrical parameters such as length, width and thickness of a test specimen as well as the height of the load magnitude are investigated for their influence between the analytical calculations and numerically determined values. Therefore, a numerical simulation using the Finite Element Method (FEM) with 210 geometric variants and 6 load levels was performed. The results confirmed the correlation between aspect ratio and increased stress due to lateral strain induced in a uniaxial bending test. Besides the area of the specimen, the effect of the thickness was also confirmed. But this effect does not increase linearly with the associated parameters.
After an area of subdivision, a plateau of about 12 – 14 % deviation is reached and not further influenced in its magnitude. With increased load, the plateau does not increase any further, so that the maximum error between the beam theory and the FEM was found to be maximum 14.26 %. For the determination of the maximum bending strength, this knowledge is helpful in order to assess the results more accurately. However, the linear beam theory always calculates conservative on the safe side. The identified dependency of the geometry did not allow for a precise specification of optimal test specimen geometries. In general, it can be recommended to use test specimens that are as slim as possible. However, further boundary conditions such as the feasibility to manufacture and pre-stress the glasses on industrial level must be considered.
For further research it can be recommended to consider the geometric non-linearity by a correction factor, as in the case of DIN EN 1288-3, in the analytical calculation of the effective bending stress.
In addition, it should be investigated more precisely if the deviations found here can be explained exclusively by the Poisson Effect.
5. Acknowledgements
The research is part of a joint project the Technische Universität Dresden, Innovent e.V. Technologieentwicklung, INGLAS Produktions GmbH (ING), Sollingglas Bau u. Veredelungs GmbH & Co. KG, Josef Gartner GmbH, EurA AG supported by the German Federal Ministry of Economic Affairs and Climate Action. The author thanks all project partners for the great collaboration within the research project as well as all members of the Institute of Building Construction connected with this research.

6. Conflict of Interest
The authors declare that they have no conflict of interest.
7. References
[1] Blank, K. 1994. Strength tests of flat glass by means of four-point bending. (1994).
[2] DIN 18008-1 2020. Glas im Bauwesen – Bemessungs- und Konstruktionsregeln – Teil 1: Begriffe und allgemeine Grundlagen.
[3] DIN EN 1288-3 2000. Glas im Bauwesen - Bestimmung der Biegefestigkeit von Glas.
[4] Feldmann, M. et al. 2023. The new CEN/TS 19100: Design of glass structures. Glass Structures & Engineering. (Mar. 2023). DOI:https://doi.org/10.1007/s40940-023-00219-y.
[5] Guglielmo, M. 2017. Chemical strengthening of glass by Ion-exchange. (Oct. 2017).
[6] Maniatis, I., Nehring, G. and Siebert, G. 2016. Studies on determining the bending strength of thin glass. Proceedings of the Institution of Civil Engineers - Structures and Buildings. 169, 6 (2016), 393–402. DOI:https://doi.org/10.1680/jstbu.14.00003.
[7] Neugebauer, J. 2016. Determination of Bending Tensile Strength of Thin Glass. Challenging glass 5. (Jun. 2016).
[8] Oliveira Santos, F., Louter, C. and Correia, J.R. 2018. Exploring Thin Glass Strength Test Methodologies. Challenging Glass Conference Proceedings. (May 2018), 713-724 Pages. DOI:https://doi.org/10.7480/CGC.6.2192.
[9] Timošenko, S.P. and Woinowsky-Krieger, S. 1996. Theory of plates and shells. McGraw-Hill.
[10] Zaccaria, M., Peters, T., Ebert, J., Lucca, N., Schneider, J. and Louter, C. 2022. The clamp bender: a new testing equipment for thin glass. Glass Structures & Engineering. 7, 2 (Aug. 2022), 173–186. DOI:https://doi.org/10.1007/s40940-022-00188-8.