Authors: Ioannis Katsivalis, Ole Thybo Thomsen, Stefanie Feih & Mithila Achintha
Source: Glass Structures & Engineering 3, 183–196 (2018).
DOI: https://doi.org/10.1007/s40940-018-0070-0
Abstract
This paper investigates the use of bolted and brittle/ductile adhesive connections in glass structures. Two benchmark designs of shear connections are introduced and tested experimentally in quasi-static tensile tests. The designs consist of tempered glass and aluminium substrates while steel splices are used for the load application. In addition, material characterisation testing for the glass and the adhesive is performed and the outputs are used for the numerical simulation of the same joints. Pressure-sensitive, plasticity and failure models are introduced and calibrated to accurately capture the behaviour of the adhesives. Good agreement between the experimental observations and numerical predictions is achieved. The results show that both types of adhesive joints outperform bolted joints while counter-intuitively the lower strength ductile adhesive achieves consistently higher joint strength compared to the brittle adhesive. The numerical analyses highlight that while brittle adhesive joints fail once the fracture strain of the adhesive has been reached, while for ductile adhesives an extensive plastic zone develops near the areas of stress concentrations thereby delaying the damage initiation.
1 Introduction
Over the last decades the use of glass in the building industry has increased significantly. However, a number of challenges related to the structural use of glass still remain, such as the uncertainty of glass strength, the lack of design standards and, most importantly, the lack of an effective and durable connection method to other structural building materials such as steel (IStructE 2014).
One of the main challenges when using glass as a structural material is its brittleness. Failure of glass can happen without any warning in a catastrophic manner once the critical fracture toughness is exceeded, with failure originating at small surface cracks or internal flaws. Areas of stress concentration, such as load introduction or connection points, are particularly dangerous for any glass structure due to the material’s inability to plastically deform. While bolted joints have been and are still being used extensively, they lack structural efficiency and reliability as the drilling/cutting required may introduce flaws and discontinuities on the glass surface (Haldimann et al. 2008).
In contrast, adhesively bonded joints have structural advantages as they minimize the development of high stresses, as well as avoid the formation of additional surface flaws. Unlike conventional mechanical joints, adhesive joints do not increase the weight of the structure and have aesthetic advantages since they offer uninterrupted and smooth surfaces and possible transparency. Adhesives can exhibit a wide range of mechanical properties depending on their chemical classification and curing mechanism. Soft elastic adhesives like silicone are being used extensively in glazing systems for gap-filling roles, but are rarely used for load-carrying structural connections (IStructE 2014). On the other hand, stiff and high strength adhesives such as acrylics and epoxies have been used in other industries, for example as structural adhesive joints in FRP composite materials (Adams et al. 1997), but are relatively unproven in applications relating to structural glass (Haldimann et al. 2008). It is currently unclear how adhesive characteristics influence the strength of hybrid glass/steel joints.
Several research groups have investigated adhesive glass connections and related modelling approaches. Single lap steel-glass connections have been tested in the past, comparing the performance of different adhesives while using different modelling approaches (Nhamoinesu and Overend 2012; Overend et al. 2013). In addition, extensive research has taken place on the use of adhesively bonded point fixings in canopies and facades (Belis et al. 2012; Dispersyn et al. 2014, 2015a, b; Dispersyn and Belis 2016). Machalicka and Eliasova (2017) also performed a series of tests with adhesive joints connecting glass-glass, glass-steel and glass-aluminium. In their study, they also considered different glass surface treatments and the long-term performance of the joints. Recently, the Crystal Houses façade project (Oikonomopoulou et al. 2016) has shown that the use of stiff adhesive glass joints can be extended to real-life building construction. However, a thorough experimental and numerical assessment of bolted versus bonded joints including the joint’s failure prediction is currently lacking.
In this study tempered glass/mild steel joints with bolted and adhesive shear connections are investigated. The joints have the same load-bearing characteristics and are tested under quasi-static uniaxial tension. For the bolted joints, steel bolts were used to ensure failure in the glass. Two different adhesives were used for the bonded joints. The first one is a brittle, transparent epoxy resin (Araldite 2020), which according to the manufacturer is especially suitable for glass and ceramic bonding, while the second one is a ductile methacrylate (Araldite 2047-1) which was identified in the literature as an adhesive which can produce quality bonds for glass adherends (Nhamoinesu and Overend 2012; Nhamoinesu et al. 2014).
We highlight in this work that the adhesive joints outperform the bolted joint connections in terms of stiffness and maximum strength for room temperature testing. Interestingly, it was found that the more ductile and low-strength adhesive resulted in an increased joint strength due to slower damage progression within the adhesive layer. An advanced finite element model considering non-linear geometry, adhesive material plasticity and adhesive and glass failure is presented to explain these experimental observations.
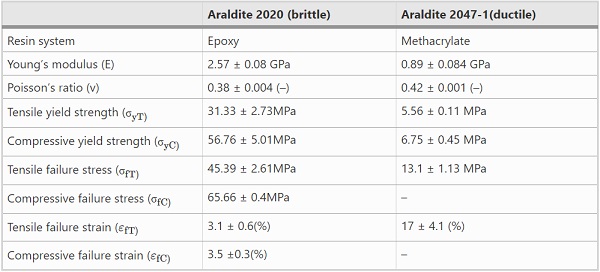
Table 1 Results of material characterization testing for Araldite 2020 and Araldite 2047-1 - Full size table
2 Experimental methodology
2.1 Material characterisation
Tensile and compressive tests were performed for the two adhesives. The tests were done in order to identify the elastic modulus, Poisson’s ratio, the yield and failure stress and strain in both tension and compression. Furthermore, the pressure sensitivity of both adhesives is identified based on stress–strain data acquired for two different stress states. The tensile tests followed BS EN ISO 527-1:2012 and BS EN ISO 527-2:2012 (BSI 2012a, b), while the compressive tests followed BS EN ISO 604:2003 (BSI 2003) .
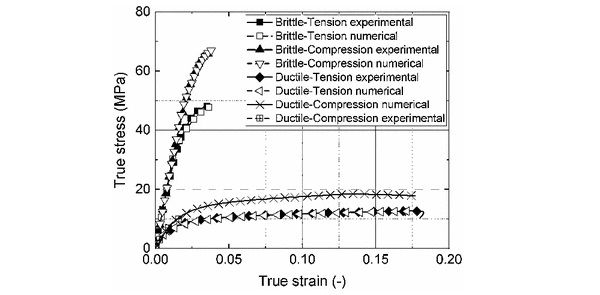
All the tests were conducted with universal testing machines. For strain measurements, strain gauges, digital image correlation and video extensometer data were used. Representative stress–strain curves are shown in Fig. 1 with the required data fitting for the numerical analysis. The stress–strain relationship was mostly linear up to yield strength. Modulus data was derived in the strain interval between 0.05% and 0.25% as per test standard. Table 1 summarises the properties measured with the aforementioned tests.
It is seen that the stiffness of the epoxy resin system is nearly three times higher and its yield stress is increased by a factor of 5 compared to the methacrylate resin system. Its failure strain, in contrast, is 5 times lower. Based on these differences, Araldite 2020 is classified as a brittle adhesive, while Araldite 2047-1 is described as ductile for this work. The compressive failure strength and strain of Araldite 2047-1 were not possible to measure when following the BS EN ISO standard specimen dimensions due to material’s excessive ductility. These tests were therefore stopped after the yield strength of the material was reached (approximately 2% strain).
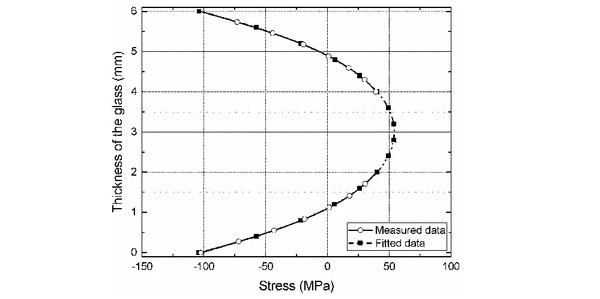
Tempered glass was used for the joint testing. The residual stress profile of the tempered glass was measured using a scattered light polariscope (SCALP). The intensity of the scattered light depends on the birefringence caused by the stresses. The main principles of the method can be found in Aben and Guillemet (1993) and Aben et al. (2008), while the scalp device has been used successfully used in estimating the residual stress profile for both annealed and tempered glass (Nielsen et al. 2010; Zacaria and Overend 2014; Achintha and Balan 2015; Balan and Achintha 2015).
One of the limitations of the device is that it can only measure residual stresses up to a depth of 2.2 mm, while the glass used in the tests is 6 mm thick. Therefore, a 5th order fitting polynomial was employed in order to complete the typical characteristic shape of the residual stress profile (Balan and Achintha 2015). Figure 2 shows the measured and the fitted data of the residual stress of the glass. It can be seen that the compressive surface stresses exceed 100 MPa, which makes the tempered glass less susceptible to surface flaws. In the absence of any internal flaws, this compressive stress needs to be overcome first for failure to occur from the surface.


2.2 Mechanical testing of bolted and adhesive joints
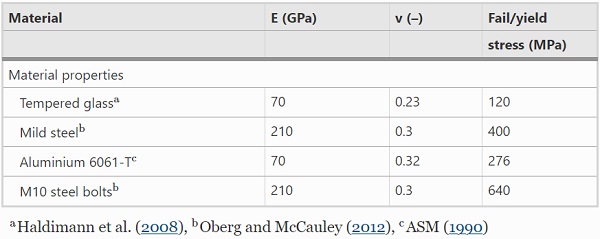
Two functionally identical designs of bolted and adhesive double shear lap joints with the same structural load-bearing area were manufactured and loaded under tension as per Fig. 3. The joints consisted of two different substrates (tempered glass on one side and an aluminium (alloy 6061-T6) plate on the other side), which were bonded to two mild steel splices on which the loads were applied. Aluminium was selected for the second adherend in the shear configuration since the material has very similar stiffness compared to glass (see Table 2) and thus creates a symmetrical configuration, but is also stronger and thus limits the potential failure locations to the glass substrate. M10 pre-tensioned steel bolts were used for the bolted connections, while Araldite 2020 and 2047-1 were used for the adhesive joint evaluation. Three specimen per configuration were tested.
Table 2 Material properties used in the numerical modelling - Full size table
The assembly of the adhesive joints took place in a sequence of two days. At first, the steel splices were bonded to the glass adherend, while the next day the steel splices were bonded to the aluminium adherend. A steel fixture was used for the alignment of the joints while the bondline was controlled using 0.2 mm diameter wires. This thickness was chosen based on manufacturer’s guidelines (Huntsman 2007, 2010). Later analysis confirmed that this method resulted in consistent bondline thickness. A tin side detector was used prior to assembly to ensure that the non-tin sides of the glass were used for the bonding. According to Haldimann et al. (2008), the air side of the glass is expected to produce better bonding. Curing took place at room temperature for both adhesives as per manufacturer’s datasheet (Huntsman 2007, 2010).
For bolted joints, M10 pre-tensioned bolts were used, and the clearance of fit was 3%. Accurate pre-tensioning of the bolts was achieved by using a torque wrench. The pre-tensioning was 25 Nm following relevant industry examples (IStructE 1999). Finally, aluminium inserts were used to avoid direct steel-glass contact, and a PTFE bushing was used between the bolts and the bolt holes.
The tests were performed with servo-hydraulic universal testing machines. The strain rate was below 1 μ strain/sec for all tests ensuring quasi-static conditions were maintained throughout every test. A Photron SA3 high-speed camera was used for the monitoring of the crack initiation and propagation in the glass and in the adhesive. The resolution used in the tests presented was 512×32, while the frame rate was 60.000 fps. Linear 120Ω strain gauges were placed on the symmetry line of both sides of the joint. For bolted joints, the strain gauges are placed at a distance of 10 mm from the hole edge, while for the adhesive joints the strain gauges are placed on the edge of the overlap. The other strain gauges are at the centre of the joint to capture the uniform strain state. Data logging of the strain gauges was achieved by using Vishay’s Strainsmart 8000-8-SM. Figure 4 shows the locations of the strain gauges and the reduced views of the high speed cameras.
3 Numerical simulation methodology
The commercial code ABAQUS 6.14 (Simulia 2014) was used for the non-linear (material, geometry) finite element simulation. All substrate materials (glass, steel, aluminium) are considered to behave elastically up to yield/failure strength. It is noted that the failure strength for glass is significantly lower than the metal’s yield strength, see Table 2, even when considering the compressive surface stress.
The brittle cracking model used is an in-built failure criterion in ABAQUS (Simulia 2014). According to this model, the crack initiates when the maximum principal stress is exceeded, while the post crack behaviour is governed by the fracture energies in modes I and II. However, for tempered glass complete failure can be assumed once the first crack initiates. As we do not model the compressive stress distribution inside the glass material, we assume that failure is surface-controlled, and the yield stress is hence offset by the maximum residual stress.
For the two adhesives a different modelling approach was utilised. Adhesives are pressure-sensitive materials since volume changes take place during the plastic state (Dean et al. 2004). Adams et al. (1997) state that the yield stress in compression is generally larger than in tension and the ratio between these values generally ranges between 1.2 and 1.4. As a result, the pressure-sensitive, linear Drucker–Prager criterion was used. The linear Drucker–Prager model (Dean et al. 2004) is defined by Eq. (1) which is equivalent to the equation that ABAQUS is using.
![]()
In Eq. (1), t is the effective stress, p is the hydrostatic pressure stress (Eq. 2), d is a material property related to the shear yield stress (Eq. 3) and tan β is the pressure sensitivity factor which depends on the ratio between the yield stress in tension and compression (Eq. 4).

In Eq. (2), σ1,σ2,σ3 are the principal stresses and in Eqs. (3) and (4), σyS,σyC,σyT are the yield stresses in shear, compression and tension, respectively.
Tensile test data was used as ABAQUS input to describe the plastic hardening characteristics for both adhesives. Good agreement was achieved for the tensile test simulation. The compressive test simulation was achieved by using contact between compression plates and the cylindrical specimen. In order to determine the best fit for the pressure sensitivity factor β for the linear Drucker-Prager model, numerical data was generated based on the compressive test FE simulation with tensile input and various β-parameters and compared to the experimental test results. Figure 1 shows the resulting numerical and experimental stress-strain curves in tension and compression for Araldite 2020 and Araldite 2047-1. For both adhesives the pressure sensitivity factor was calibrated as β=1.45. The good agreement for the fitted tensile test data indicates that the Drucker-Prager modelling approach is applicable.
For the damage initiation and propagation of the adhesives, the ABAQUS built-in ductile damage model was used. In this model the equivalent plastic strain is correlated with the stress triaxiality and the strain rate for the damage initiation, while the fracture energy is used for the damage propagation. The stress triaxiality (Eq. 5) is a dimensionless ratio between the hydrostatic pressure stress (Eq. 2) and the equivalent Mises stress (Eq. 6).

Once damage initiates, it propagates based on the fracture energy of the adhesives and eventually elements are being removed from the analysis once their stiffness has fully degraded.
Values for stress triaxiality are related to different stress states during testing. The fracture strains of the two adhesives can then be correlated with the stress triaxiality. It is assumed that failure in the adhesives does not take place due to compressive stresses. This was demonstrated during the compressive tests of the two adhesives. In the brittle Araldite 2020 adhesive, the failure initiated by tensile stresses developed due to Poisson’s ratio effects leading to bulging of the samples while the ductile Araldite 2047-1 compressive samples did not fail under tension but deformed excessively. Consequently, the value of the fracture strain in compression was considered to be an order of magnitude higher compared to shear and tension. The remaining values are calibrated based on the tensile experimental data and following a similar stress triaxiality curve as the one used by Nguyen et al. (2017). Table 3 summarises the values of the equivalent fracture strain used for the two adhesives.
Table 3 Damage model material parameters - Full size table
3.1 Numerical simulation of joints
ABAQUS/Explicit solver was utilized to allow for the use of damage and failure models with element deletion (Simulia 2014). However, dynamic analyses may require significantly higher computational power and time and therefore mass scaling of 1,000 is used to reduce computational time by increasing the stable time increment. It is important to minimise the dynamic effects in order to maintain quasi-static conditions throughout the analyses. As a result, it was ensured that the kinetic energy of the deformable bodies was negligible (less than 1%, of the internal energy). After the mass scaling, the simulations required about 2-3 hours to run using 8 CPU’s in an Intel (R) Xeon (R) CPU E5-2623 v3 @ 3 GHz.
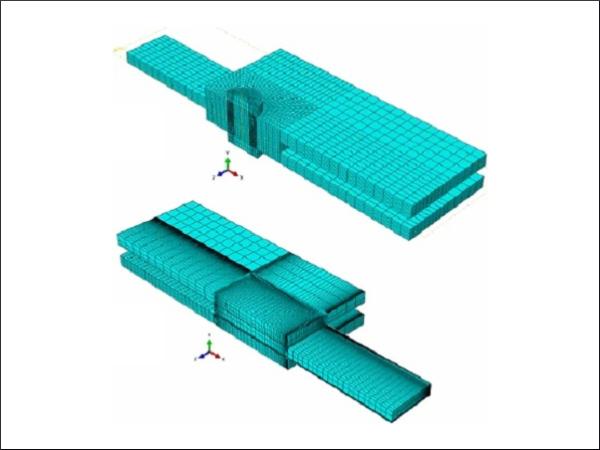
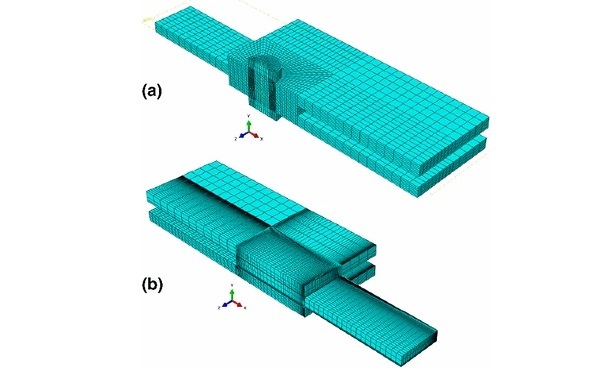
For the meshing of the models a manual edge seeding procedure was followed. This procedure involved biasing towards the locations where stresses tend to accumulate. The required minimum element size was determined following preliminary mesh sensitivity studies for each model. 3D stress, 8-node linear solid continuum elements with reduced integration and hourglass control (C3D8R in ABAQUS/Explicit) were used. In addition, geometric symmetry was used as per Figs. 3 and 4 to reduce computational time, allowing to model one quarter only of each joint. Figure 5 shows the mesh in the models of the bolted and the adhesive joints.
For the case of the bolted joints, the numerical results are very sensitive to the contact properties between the substrates and the pre-tensioned bolts. Small sliding, surface-to-surface contact was considered between all the interacting surfaces. Tangential frictionless behaviour was assumed for the interaction of the bolt with the bolt holes, while tangential behaviour with a penalty friction coefficient was considered for the sliding surfaces of the substrates. In addition, normal contact behaviour with hard penalty was used for the transfer of normal forces between the substrates. The pre-tensioning of the bolt was achieved by using a predefined temperature field in the bolt at the first step of the explicit analysis. (Maggi et al. 2005). The pre-tensioning of the bolt and the friction coefficient between the bolt and the substrates determine the load required for slip to occur.
We assume perfect bonding between the substrates and the adhesive. Hence, the adhesive layer was connected by tie constraints to the substrates which allows for a much finer mesh size to be used in the adhesive layer as required for the detailed stress and failure analysis and saves computational time. A 45∘45∘ adhesive fillet was assumed at the ends of the overlap.
3.2 Mesh sensitivity
Mesh sensitivity studies were carried out in order to determine the minimum element size in the critical areas of the models such as the sharp edges and material discontinuities. For the case of bolted joints, the most critical location is around the bolt holes, while for the case of adhesive joints the critical locations are close to the ends of the adhesive joint overlap. Here, the extent of the stress concentrations is dependent on the fillet shape.
Table 4 Summary of the failure load and mechanisms for the bolted joints tested - Full size table
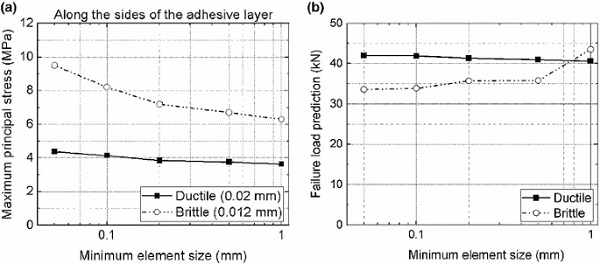
Mesh convergence issues were not encountered for the case of bolted joints, while adhesive joints were sensitive to singularities due to sharp edges and material discontinuities between the adhesive layer and the substrates. It has to be noted that the mesh sensitivity study to assess stress distributions for the adhesive joints was performed within the elastic response region to ensure that plasticity did not affect the results. Additionally, the influence of mesh refinement on the failure predictions (nonlinear response) was studied.
Figure 6 shows the sensitivity of the adhesive layer in the area of the singularity and the correlation between the minimum element size and the failure load prediction for the two adhesive cases. The FE models with the brittle Araldite 2020 adhesive displayed a larger stress sensitivity with mesh refinement. In this case, the presence of singularities not only affected the values of stress, but also significantly reduced the prediction of the failure load for coarse meshes. The failure load reduced with mesh refinement due to the increase of maximum principal stresses at the singularity. The ductile adhesive joints were also sensitive to mesh size in terms of stress distributions, but not in terms of failure load prediction. The extended plastic region of the ductile Araldite 2047-1 adhesive allowed the elements around the singularity to develop significant deformations, which explains the minimum effect in the failure load prediction. Considering these effects, a minimum mesh size of 0.05 mm was chosen for the presented results. This resulted in a total of approximately 30,000 solid elements for the bolted joints and 130,000 solid elements for the adhesive joints.
4 Results
4.1 Global performance and failure mechanisms
The three types of joints displayed a significantly different global performance in terms of stiffness, load-displacement response and failure loads. In general, bolted joints failed catastrophically at the lowest averaged load via glass fracture and displayed a non-linear, stick-slip stiffness response, which can be explained by the relative sliding of the substrates due to the clearance fit. On the other hand, adhesive joints generally achieved a higher maximum failure load, displayed a linear stiffness response and failed via cohesive/adhesive failure between the glass and steel surfaces.
4.2 Bolted joints
Table 4 summarises the experimental observations for the bolted joints tested. Failure loads show significant scatter in terms of measured load. As flaw sizes will vary from specimen to specimen, this scatter was expected due to the flaw-dominated and brittle failure process of glass.
The failure of bolted joints took place in the vicinity of the bolt hole for each test, in a direction perpendicular to the direction of the load due to high bearing stresses. Figure 7 shows the experimental observations of the high speed camera. The fracture process takes place within around 50 μs.

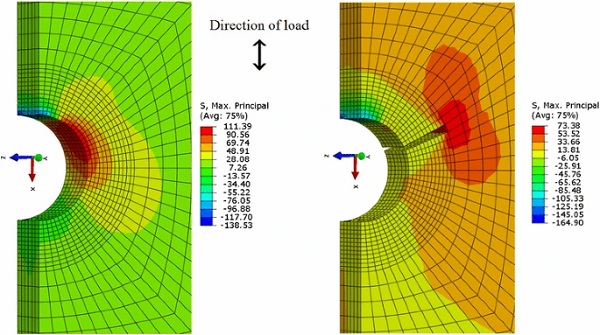
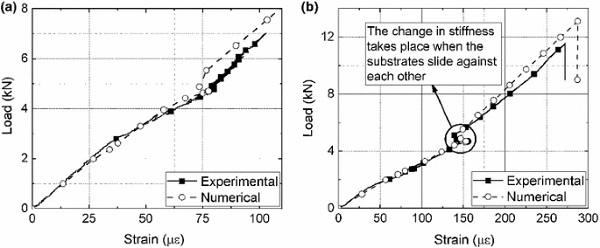
Figure 8 shows the numerical predictions regarding the areas of damage onset and evolution. It can be seen that the origin of glass fracture is determined by the location of highest contact stresses between bolt and glass and corresponds well with the experimental observations. It should be noted that the crack scattering cannot be captured with our numerical approach.
For further numerical validation, the strain response of bolted joints was also plotted based on the strain gauges recordings. The strain response is recorded at the midpoint of the glass and also at the area of stress concentrations close to the bolt hole (see Fig. 4). Figure 9 shows that there is a significant nonlinearity in the strain-load curve at a load of about 5 kN. This is the point when the substrates overcome the bolt pre-tension and start to slide against each other. The bolt then comes into contact with the bolt hole. After the new contact area is established, the load-strain response is again linear until failure. The FE prediction of the failure load within the glass adherend is within 10% of the best performing bolted joint (B1).
4.3 Adhesive joints
Table 5 summarises the experimental observations for the adhesive joints tested. Here, we can see that adhesive joints also display significant scatter in terms of their failure load, despite most joints failing by adhesive or cohesive failure. The final failure loads for the ductile adhesive are significantly higher than for the brittle Araldite 2020 adhesive, which is a very interesting and initially counter-intuitive result.
Table 5 Summary of the failure load and mechanisms for the adhesive joints tested. Brittle adhesive refers to Araldite 2020, while ductile adhesive refers to Araldite 2047-1 - Full size table
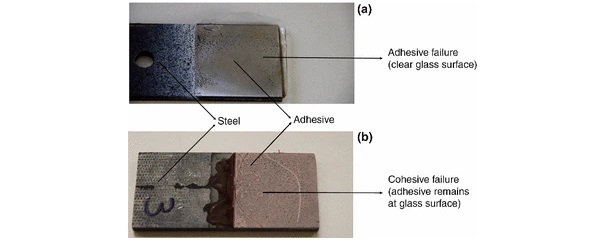
Different failure mechanisms were seen for the brittle adhesive joints. Two of them failed prematurely in the glass substrate, which shows that there is again significant variability in the glass strength due to the flaw-controlled failure process. The best performing joint in terms of maximum load, however, failed adhesively in the interface between the glass and the steel (BA3).
In contrast, cohesive failure was the only mode that took place in ductile adhesive joints. Prior to failure, extensive stress-whitening and formation of voids took place in the adhesive due to the extensive plastic region of the material. Figure 10 shows the interface and the cohesive failure on the side of the steel splices of the best performing brittle (BA3) and ductile (DA3) adhesive joints, respectively.
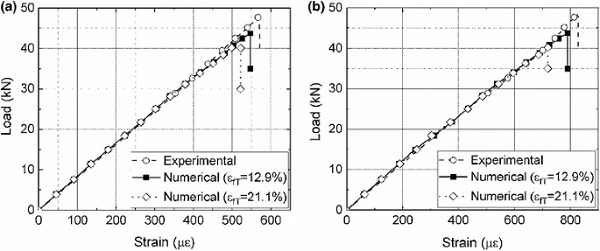
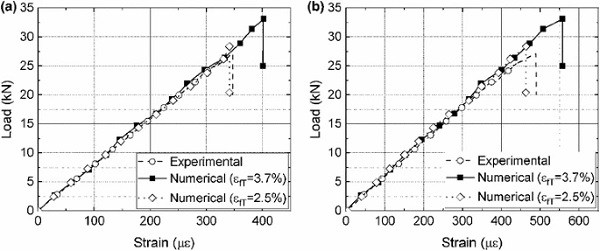
Both brittle and ductile adhesive joints display a linear relationship between the applied load and the strain response until failure as shown in Figs. 11 and 12. The failure load of these joints, however, depends on the void distribution on the adhesive layers which in turn affects the fracture strain of the adhesive material; a decisive input parameter in the numerical ductile damage model. The fracture strain of the two adhesives was varied based on the standard deviation shown in Table 1 and this led to producing lower and upper range of values for the failure load of both adhesive types. The fracture strain was varied between 2.5–3.7% and 12.9–21.1% for the brittle and ductile adhesives, respectively.
The FE models were accurate in predicting the stiffness response of the brittle joint with adhesive failure. In addition, the lower strain failure load prediction agrees well with the experimental measurement, while the high range measurement overestimates the failure load by 22%. A small change in adhesive failure strain by 1.2% therefore has a significant influence on the joint strength by over 20%. It also has to be noted that the numerical models assumes cohesive failure as determined via adhesive coupon tests.
Here, the joint failed in the interface and not cohesively as the ductile damage model assumes. It is postulated that improved surface preparation of the glass substrates to chemically bond to the free epoxy chemical groups can lead to further improvement of the performance of brittle joints and shift the failure mode from adhesive to cohesive. Numerically, a traction-separation law approach can be utilized to model the interface failure more accurately compared to a ductile damage model.
Similarly, the FE models accurately capture the stiffness response of the ductile adhesive joints. We again investigate the influence of varying the failure strain. For the ductile adhesive, the much larger difference in failure strain of nearly 10% now results in a moderate change of failure load of about the same magnitude. The FE predictions slightly underestimate the failure load of the best-performing joint, DA3, by about 8%.
4.4 Failure of adhesive joints
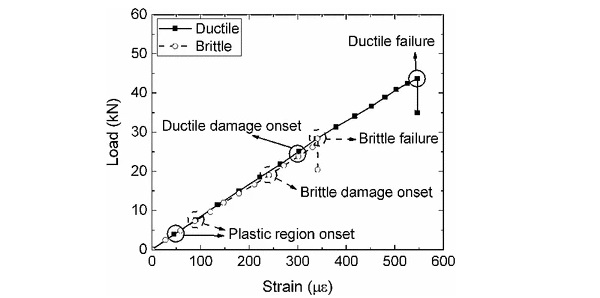
Figure 13 shows that the both types of adhesive joints display a similar predicted strain response as the different stiffness of the adhesives do not affect the global stiffness of the joint due to the negligible adhesive layer thickness compared to the adherend thicknesses. Additionally, the figure indicates the onset of the plasticity within the adhesive, the onset of damage initiation and the final failure for both joints. It can be seen that the ductile adhesive yields earlier, but due to the high failure strain of the material, damage development occurs at a higher load when compared to the brittle adhesive despite the lower adhesive strength. Hence, the load increase between damage onset and complete failure for the ductile adhesive is larger compared to the brittle adhesive. It is worth noting that the brittle Araldite 2020 joints start yielding at 7 kN and eventually fail at 33 kN, while ductile Araldite 2047-1 joints yield at 4 kN and fail at 44 kN. This significant increase in predicted joint strength is accurately reflected by the experimental outcomes despite the high experimental scatter.
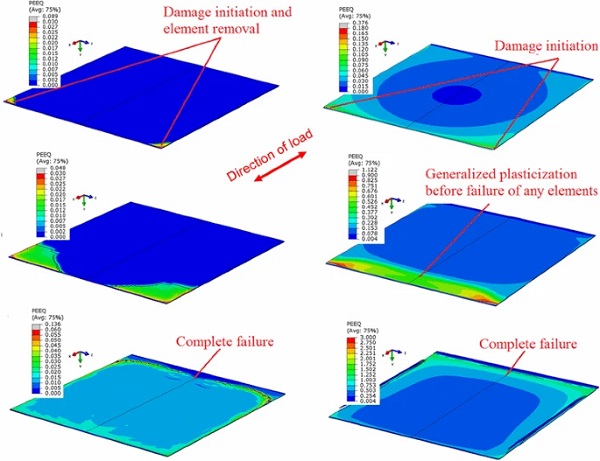
Figure 14 shows the different failure progression predicted for the brittle and the ductile adhesive layers, which also explains why the weaker ductile adhesive fails at a higher load. Firstly, the elements around the corners of the overlap start to yield for both adhesives. The brittle adhesive, however, has a very small plastic region and damage initiates very fast leading to progressive failure of elements and element removal, while most of the adhesive layer has not even started to deform plastically. Contrary to that, the plastic zone in the ductile adhesive extends largely across the whole adhesive layer before any elements start to fail. This large area plasticization behaviour of the ductile adhesive layer allows the ductile joints to sustain higher loads.
5 Conclusions
This paper presents a combined experimental and numerical study of the load response and failure behaviour of functionally identical designs of bolted and brittle/ductile adhesive glass-steel joints at room temperature conditions. The study shows that pre-tensioned bolted joints display a non-linear stick-slip stiffness response, while both types of adhesive joints display a mostly linear stiffness response up to failure. In addition, bolted joints failed catastrophically within the glass substrate at the lowest average loads due to stress concentrations around the bolt hole, while adhesive joints displayed different failure modes and sustained higher failure loads.
More specifically, the best performing (in terms of failure load) ductile adhesive joint failed at about 56% higher load compared to the best performing brittle adhesive joint and 115% higher load compared to the best performing bolted joint. The damage initiation on the bolted and the adhesive brittle joints was sudden, while for the ductile adhesive joints it was slow and progressive and was preceded by stress-whitening and void formation in the adhesive layer. The fact that the ductile adhesive outperformed the high strength, but brittle adhesive was explained by the development of a much larger plastic zone before failure.
Numerically, the linear, pressure-sensitive Drucker–Prager plasticity model was coupled with the ductile damage failure criterion to simulate the plastic deformations and the damage initiation and propagation in the adhesive layer. The brittle cracking model was also used to simulate the catastrophic failure of glass due to tensile stresses. While mesh sensitivity was observed for the adhesive joints, the numerical failure predictions, were mostly insensitive to the mesh size. Small changes in failure strain, however, caused large variations in failure predictions for the brittle adhesive, and this highlights the sensitivity of the joint design on porosity within the adhesive layer. For the ductile adhesive, large variations in failure strain only had a moderate influence on the joint strength.
Finally, it is important to note that the current assessment is limited to static loading at room temperature without prior exposure to realistic environmental conditions. In actual engineering structures the joints are exposed to cyclic and/or dynamic loading as well as environmental conditions (humidity and elevated temperature), which would increase the uncertainty of adhesive bonding when compared to the proven solution of bolted joints. For example, methacrylate adhesives are known to be more prone to moisture degradation compared to epoxy adhesives, and it is also expected that surface preparation prior to adhesive application will become more critical to delay moisture ingress along the interface. On the other hand, a ductile adhesive is expected to perform better under cyclic and dynamic loading. The long-term performance of these joints is a topic of future research to determine if adhesive joints can reliably replace bolted joints in engineering glass structures.
References
Acknowledgements
I. Katsivalis, acknowledges funding from the Agency for Science, Technology and Research (A*STAR), Singapore.
Author information
Authors and Affiliations
- Faculty of Engineering and the Environment, University of Southampton, Southampton, UK - Ioannis Katsivalis, Ole Thybo Thomsen & Mithila Achintha
- Singapore Institute of Manufacturing Technology (SIMTech), Singapore, Singapore - Ioannis Katsivalis & Stefanie Feih
Corresponding author
Correspondence to Ioannis Katsivalis.

