

Ennio Mognato, Alessandra Barbieri, Matteo Schiavonato, Marco Pace
1. Introduction
SSV tested thousands of glass panes from 2000 according to the European Standards for thermally toughened safety glass EN 12150 and according to EN 1863 for heat strengthened glass. From the 1st September 2005, due to the implementation of the harmonized part of the standards, ITT certification became compulsory according to CPD 89/106 requirements and the amount of tests increased.
The required procedure to evaluate the flexural strength is described in EN 1288-3:2000 (four point bending strength test), whereas the surface prestress is carried out by SSV laboratory following the ASTM C1279:2000 (and the following revised versions).
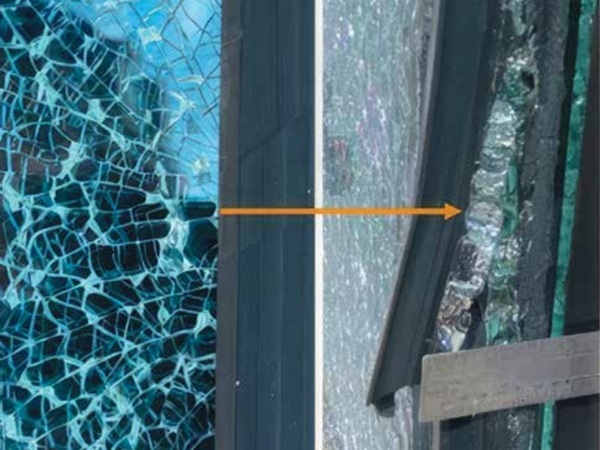
The fragmentation test is carried out with the same procedure in thermally toughened safety glass and in heat strengthened one, but the fragmentation requirements differ due to the different pattern, as evinced in figure 1. The correlation between surface compressive stress and fragmentation should be carried on only for thermally toughened safety glass, while between surface compressive stress and flexural strength it should be carried on for both glass typologies.
The ITT requirements and surface stress measurements are evaluated on specimens with dimensions 360 mm x 1100 mm. The specifications of tests procedure and instruments and testing machine used to carry on the tests are reported in the previous paper [1].
.jpg)
Figure 1 - Fragmentation pattern in thermally toughened safety glass (a) and in heat strengthened glass (b).
Some authors tried to define a theoretical correlation between surface compressive stress and fragmentation [3, 4, 5], and others tried to find it by test on thermally toughened safety glass or heat strengthened glass [7], or both [2, 8].
These correlations could be useful for producers of thermally treated glass to show compliance with requirements of Standards as they give the opportunity to use a non destructive method, like the measurement of surface compressive stress, to verify the performance of produced glass. It can be also an advantage for the final client which could verify the heat treatment quality.
Up to day, only the ASTM C1048:2004, “Standard Specification for Heat-Treated Flat Glass - Kind HS, Kind FT Coated and Uncoated Glass”, specified a surface compressive stress requirement as showed in table 1, where are reported also the typical value for annealed glass [9, 10], and the bending strength limits defined in EN Standards.
.jpg)
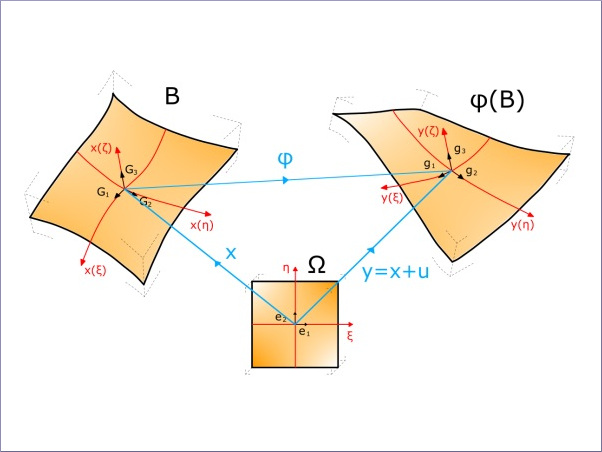
The process of thermal treatment of float glass panes induces a surface pre-compression of glass for a thickness of 0.21 t, where t is the pane thickness, and the stress profile is parabolic with the following expression:
σx (z) = σy (z) = σc · (1 - 12 · (z/t)2)
where σc is central tension at mid-plane; z is the axis perpendicular to pane plane, defined by the x and y axes. For the value z=t/2, corresponding to pane surface, it is evinced that the surface compressive stress is equal to:
σx (z) = σy (z) = -2 · σc
Gulati in [4, 5] formulated a fragility model, considering a square pattern of fragmentation and the stored elastic energy during tempering process. It is evinced that the stored elastic energy is more than double when the central tension increases from (0.7×σ0) to σ0, where σ0 is the strength of annealed glass, prior to tempering.
High central tensile stress increases the glass strength but increases also its fragility. In [5] the term of “fragmentation density” was introduced as the number N of particles per unit area of pane and it was evinced that N depends on the 4th power of central tension, as it is independent of plate thickness. These aspects were considered in the analysis of SSV data collected during the wide time period of testing.
2. Data base for correlations
Data were mostly collected from 2002 up to 2010 and when possible were organised firstly on base of the test type in:
- surface compressive stress (σs(ASTM-1279)): evaluated by GASP laser on five points on tin side following EN 12150-2:2004
- fragmentation test (n(EN-12150)): number of particles evaluated on a square area 50 mm x 50 mm in the coarsest zone
- 4 point bending test (σb(EN-1288)): considering both air/tin side, or coated/uncoated side, in tension.
Data are collected by year and then arranged by thickness; due to the fact that not always surface compression measurement is required and performed, only samplings with all tests were considered for the correlation, so that each point represents a single specimen. The total amount of specimens analysed is reported in tables 2 and 3.

Click to enlarge
UserFiles/tab2big.jpg
Data are mainly representative of thermally treated glass production in Italy, with some samplings from other European producers. During these last years specimens with soft coated glass increased due to the rapid evolution of energetic requirements of glass for building applications (low emissivity, selective products etc.), and new temperable products appeared on the market, for this reason all types of glass are here considered.

As data refer to different producers, it means that the tempering process differs for ovens and their technology of heating and convention if one, from tempering recipes related to glass thickness and type; sometime also weather conditions (barometric pressure and daily temperature) can influence the level of tempering.
3. Correlation between surface compressive stress and fragmentation for thermally safety glass
All data of specimens with surface compressive stress and particles number were divided in groups on the base of fragmentation density, defined as:
N = n(EN-12150)/A(EN-12150)
where A(EN-12150) is the area of the square 50 mm x 50 mm in which the particles are counted.
The minimum particles amount for thermally toughened safety glass is reported in EN 12150:2000. The data were collected by:
- N: <0.7(10); <0.8(20); <1.6(40); <2.4(60); <3.2(80), <4.0 (100); 4.8(120); <5.6(140); <6.4 (160); <7.2(180), in the round brackets the corresponding number of particles are reported;
- n(EN-12150) : for each group the mean value of particles was evaluated
- σs(ASTM-1279) : for each group the mean value of surface compressive stress was evaluated.
This procedure was applied for each glass thickness and in figure 2 it is plotted the mean value of each group σs(ASTM-1279) versus n(EN-12150). The correlation between the plotted quantities is defined by a linear regression, which equation is defined as:
y(x) = m · x + q
This is an approach to modelling the relationship between a scalar variable Y, in this case n(EN-12150), and the variable denoted X, σs(ASTM-1279). In linear regression, data are modelled using linear functions, and unknown model parameters are estimated from the data.
The linear regression model is fitted using the least squares approach. In table 4, the parameters of linear regression and the coefficient of determination (R2) value of the experimental data are reported.


Click to enlarge
UserFiles/grafbig.jpg
Figure 2 - Correlation of surface compressive stress versus fragmentation for each glass thickness, considering thermally toughened safety glass, coated and un-coated, as conform and not conform specimens.
Not conform specimens were also considered in the proposed correlation, because the aim was to define the lower limit of surface compressive stress for appropriate fragmentation of safety glass pane. Limit number of particles is 40 for the tested panes, except 15 mm glass thickness for which the limit is 30.
The correlation lines for 4 mm, 5 mm, 6 mm, 8 mm and 10 mm glass pane are quite similar, whereas a lower slope coefficient is evinced for 12 mm and 15 mm glass pane. This may be due to the increment of thickness that may ask more elastic energy to induce cracks, because the compressive layer is bigger than in thinner pane, as well from a “cluster” effect which does not allow a finest fragmentation.
From figure 2 it is evinced that -generally- the surface compressive stress should be more than 85÷90 MPa to define the thermally toughened safety glass as safety glass. This value varies not much considering different thickness; then the authors propose a safety limit value of 90 MPa, independently from glass thickness.
It is evident that the increment of fragmentation density for glass panes thicker than 10 mm needs more stored elastic energy. This could be reached increasing the surface compressive stress, but at the same time the glass pane becomes brittler. This aspect has to be taken into account during the design of glass structural elements.
There are cases with a quite high measured surface compressive stress with an amount of fragments lower than the expected one, sometime just in the quite rare and related to coated glass. We interpret it as due to a strong non homogenous velocity of cooling between the two surfaces and from these and the glass core; more investigation is needed to find a method to detect these anomalies.
Though it is not possible to find a similar correlation for heat strengthened glass, experience shows that it conforms to EN 1863-1:2000 fragmentation requirements when surface compressive stress is between 35 MPa and 55 MPa.
4. Correlation between surface compressive stress and flexural strength
In such correlation the two kinds of thermally treated glass were considered. Data of specimens with surface compressive stress and flexural strength measurement were firstly divided by glass thickness; then the specimens with only tin side and un-coated side in tension in the bending test were selected, because this is the side where σs(ASTM-1279) was measured. Moreover the data were segregated considering specimens with only central fracture origin. The plotted values carried out from experimental data are:

Click to enlarge
UserFiles/graf2big.jpg
Figure 3 - Correlation of surface compressive stress versus flexural strength for the all tested glass thickness, considering tin side and un-coated side only, conform and not conform specimens. The circled data were not considered for the correlation, because it was evident by fracture analysis that the tensile side was damaged. The coefficient of determination R2 for experimental data is equal to 0,58.
- surface compressive stress considered as mean value of five measures for each specimen;
- flexural strength calculated at collapse load, following the equation defined in EN 1288-3:2000.
Few values of specimens of not-heat treated tested as received from the float line process, were also added.
The diagram of figure 3 shows clearly the types of glass that were tested: annealed, heat strengthened and thermally toughened safety glass. The relationship between the scalar variable σb(EN-1288), and the one denoted σs(ASTM-1279) is still a linear regression, which equation is plotted in figure 3.
The limit value of surface compressive stress that has to be reached to respect the characteristic strength value of thermally toughened safety glass is 80 MPa; in the case of heat strengthened glass, this value is 35 MPa. Also considering all data collected of mechanical strength (air side and coated side in tension), these values can be confirmed. These values confirm also the previous research [2], increasing the number of tested specimens.
5. Conclusions
The analysed data covered about many years of laboratory tests on different types of glass (annealed, heat strengthened and thermally toughened safety) provided by different producers in Italy and in Europe.
Correlations were carried out considering the possibility to identify a non destructive procedure to evaluate the conformity of glass products to European Standards. This procedure was defined as the measurements of surface compressive stress on tin side, as prescribed by EN 12150-2:2004 for thermally toughened safety glass.
Correlation between this parameter to fragmentation density and to flexural strength was evaluated by the application of linear regression method. The not conform specimens were considered too, because they could occur in production and must be detected in the procedure.
1. Surface compressive stress and fragmentation density correlation are generally independent from glass thickness, except for pane thicker than 10 mm. The elaboration of experimental data evinced that the minimum level of surface compressive stress that needs to be induced by tempering process is:
- 90 MPa in glass pane thickness less or equal to 10 mm;
- 85 MPa for thickness bigger or equal to 12 mm;
to get good fragmentation and define the glass product as “safe”.
Gulati in [5] finds experimentally a correlation between fragmentation density and the 4th power of tensile mid-plane stress. This correlation was verified according to the data collected by the authors. However, the analysis of experimental data shows that it may be expressed also by linear equations only for thermally toughened safety glass, and reported in the following:
n(EN-12150) (σs(ASTM-1279)) = 4.5· σs(ASTM-1279) - 357
for 4 mm ≤ t ≤ 10 mm
n(EN-12150) (σs(ASTM-1279)) = 1.8· σs(ASTM-1279) - 121
for 12 mm ≤ t ≤ 15 m
2. Surface compressive stress and flexural strength correlation was carried on considering all sampling thickness tested with tin side and not coated side in tension; these sides are the ones where the surface compressive stress was measured by GASP laser. The results carried out are in agreement with those obtained in the previous investigation [2] and the general equation is:
σ(EN-1288) (σs(ASTM-1279)) = 1.11· σs(ASTM-1279) + 60
The limit value for surface compressive stress to obtain conform specimens in terms of flexural strength is independent by pane thickness; the more reliable mean value is 90 MPa for thermally toughened safety glass and 45 MPa for heat strengthened one.
These are safe values because they give corresponding flexural strength higher than that defined as characteristic value by the Standards of references. Additional tests should be done on annealed and heat strengthened glass to increase the population of samples for these type of products.
Another aspect, that has to be considered, is the fragmentation of heat strengthened glass for which a different parameter needs to be assumed (ex. particle length or weight), to complete the correlation in terms of surface compressive stress and fragmentation.
The results obtained till now need be to verified on current production glass pane dimensions to confirm the validity independently from pane size.
Acknowledgements
The technicians of SSV - SVP Laboratory, Mr. G. Negri and Mr. F. Comiati, are acknowledged for the execution of experimental tests during many years of activity in our Laboratory.
References
[1] Schiavonato M., Mognato E., Redner A.S., Stress measurement, fragmentation and mechanical strength, GPD, 2005.
[2] Redner A.S., Mognato E., Schiavonato M., Correlation between strength and measured residual stress in tempered glass products, J. of ASTM Int., Vol. 2, No. 3, 2005.
[3] Barson J.M., Fracture of tempered glass, J. Am. Ceram. Soc., Vol. 51, No. 2, 1968
[4] Gulati S.T., Thermo-mechanical behaviour of tempered silicate glass, 2nd ESG Int. Conf., Venice (Italy), 1993.
[5] Gulati S.T., Frangibility of tempered soda-lime glass sheet, GPD, 1997.
[6] Salvagno L., Civiero R., Correlazione compressione superficiale - frammentazione, Rivista della Stazione Sperimentale del Vetro, No. 1, 2008.
[7] Fragmentation of heat strengthened glass: implication for glass not conforming to ASTM C1048, Challenging Glass 2 Conf., TU Delft (Nederland), 2010.
[8] Joehlin S.W., Tests examine the relationship of break pattern and stress levels in heat strengthened and tempered glass, Glass magazine, March 1999.
[9] Redner A.S., On-line measurement of stresses and optical distortion for QC of tempered glass, GPD, 2003.
[10] Feingold J. M., Testing for mechanical strength and impact resistance, Glass on web, 2008.
Authors
Ennio Mognato, Alessandra Barbieri,
Matteo Schiavonato
SSV - Stazione Sperimentale del Vetro - Venezia
emognato@spevetro.it
abarbieri@spevetro.it
Marco Pace
Università di Padova
Dip. di Ingegneria Meccanica
marco.pace1@gmail.com


