Authors: Vincent M. Wheeler, Janghyun Kim, Tom Daligault, Bryan A. Rosales, Chaiwat Engtrakul, Robert C. Tenent & Lance M. Wheeler
Source: One Earth, Volume 5, Issue 11, 1271–1285; Published by Elsevier Inc.
DOI: https://doi.org/10.1016/j.oneear.2022.10.014
Highlights
- Photovoltaic (PV) windows can enable net-zero highly glazed buildings
- PV windows in temperate New York lead to more energy/CO2 savings than in sunny Tucson
- Average building energy use can be reduced by 40% with lab-proven PV window technology
- Net energy/CO2 use of highly glazed buildings with PV windows decreases with height
Science for society
One-third of the world’s energy is consumed by buildings, contributing to 28% of global CO2 emissions. These high levels of energy consumption are in part a result of architectural trends toward poorly insulated glazed façades. Window-to-wall ratios have consistently increased since the end of World War II, and demand for highly glazed façades remains high despite wide acknowledgment of their poor energy performance and rising concerns regarding the effects of climate change. To tackle this challenge and improve building energy efficiency, numerous window technologies have emerged in the last two decades—low-emissivity coatings, dynamic tinting, photovoltaic glass, and others—but the extent to which these technologies can be incorporated into different building designs and how they will function in different local climates remains untested. We construct and study models of thousands of different cases to reveal striking trends that guide future window technology deployment. 10,000–40,000 GJ of energy can be saved annually for a typical office building by utilizing photovoltaic windows along with simple geometric changes. Highly glazed buildings can be designed to achieve net-zero energy use when the right technologies are adopted.
Summary
Buildings account for 30% of global energy use. The architectural trend across building sectors is toward more glass despite higher energy use and carbon emissions than opaque cladding alternatives. Numerous window technologies—low-emissivity coatings, triple glazing, dynamic tinting, and the more recently developed photovoltaic glass—have emerged in the last two decades as approaches to reduce building energy. However, a comprehensive understanding of where and how these window technologies can be installed to enable optimal energy savings under different climate conditions remains limited. Here we test window technologies using thousands of macroscale building-energy simulations for different climate zones and building designs to evaluate the associated net energy use and carbon-emissions reduction potential. Novel window technologies, especially photovoltaic windows with high thermal performance, offer energy savings in all climates, ranging from 10,000–40,000 GJ per year over substandard windows for a typical office building, resulting in up to 2,000 tons of annual CO2 emissions reduction. Highly glazed, net-zero buildings are achievable via photovoltaic windows when combined with careful geometric considerations.
Graphical abstract
Introduction
Buildings currently account for over one-third of the world’s final energy consumption and approximately 28% of global CO2 emissions.1 Urban buildings comprise the majority of energy consumption and emissions, and urban areas have been predicted to encompass 70% of the world’s population by the middle of this century.2 Recent work has shown that urbanization is as much as four times greater than previous estimates, which suggests an unprecedented rate of global urbanization.3 As urban centers retrofit and build new buildings to accommodate growth, the importance of green building design and implementation cannot be understated as a critical tool for combatting anthropogenic climate change.4
For more than a century, urban building design has evolved based on the confluence of many factors, including economics, regulatory change, development of technology, and shifts in architectural thinking. Five chronological generations, defined by significant events and technological advancements, were recently identified in terms of building energy performance (Figure 1A).5 The first two generations are characterized by high-thermal-mass buildings composed of concrete and single-pane windows with a window-to-wall ratio (WWR) between 20% and 40%. Post-World War II innovation led to adoption of the all-glass curtainwall in the third generation of buildings; the WWR increased significantly to more than 50%. At this time, highly glazed façades were a symbol of recovery and economic wealth. The Lever House in New York City continues to represent the birth of the all-glass building as an architectural movement that lives on today.

(A) WWR as a function of time, highlighting the five generations of buildings based on energy performance, the influential events that led to new generations, and the market response to those events. A prototypical building that highlights each generation is included. (Image credit from left to right: ©demerzel21/123RF.com, ©ags1973/123RF.com, ©philipus/123RF.com, ©FADB/Shutterstock.com, ©Michael Steinbrueck/Shutterstock.com) Bars represent the span of representative buildings from Oldfield et al.5
(B) Illustration of the complex energy flows and human factor considerations in an insulating glazing unit.
(C–G) Representative diagrams of glazing units and corresponding optical spectra of outboard panes explored in this work, including code-compliant (C), dynamic (D), wavelength-selective PV (E), non-wavelength-selective PV (F), and dynamic PV (G). The labels are used throughout the remaining text to refer to the outboard glass laminate.
The code-compliant low-e spectrum in (A) is from the International Glazing Database (IGDB 6296). The remaining spectra are simulating by coupling the TMM to solve Maxwell’s equations for nanoscale films to the Window software.6 The AM1.5 solar spectrum is normalized in (C). Dashed gray boxes represent an optional third pane and low-e coating. Simulations were run with double- and triple-pane glazing. (C)–(G) are plotted against wavelength in Figure S1.
--------------
The façade affects areas of the building responsible for over 50% of energy consumption, including space heating and cooling, lighting, and ventilation.7 The transition to highly glazed façades in the 1960s more than doubled the primary energy requirements from those built in the early 1950s.5 The energy crises in 1973 and 1979 spawned the fourth generation of buildings with demand for higher energy performance from the building façade. However, building designers did not pivot away from highly glazed façades; they maintained the trend of a WWR of more than 50%. Instead, there was widespread adoption of double-pane insulating glass units to improve thermal performance and reduce energy consumption.
The rise of environmental consciousness within generation 4 led to further developments in energy-efficient glazing to reduce carbon emissions. Low-emissivity (low-e) coating technology revolutionized window energy efficiency in the 1980s by selectively absorbing and re-emitting or reflecting infrared wavelengths while maintaining high transmissivity to visible light.8 The technology continues to evolve and improve9 and has become ubiquitous in modern glazing because ever-more-demanding energy codes could not be met without it.
Glazing technology is now at a crossroads in the current generation of buildings. Demand for highly glazed façades has still not diminished even as climate change is a mainstay in the public consciousness. Highly glazed buildings have even become political symbols of energy inefficiency that stand in the way of mitigating climate change.10 Previous impactful technologies (double-pane windows and low-e coatings) improve thermal properties to increase building energy performance. A number of new glazing technologies have been developed to further improve thermal performance, including triple-pane or “thin triple”11 technology as well as vacuum-insulating glazing,12 but there has been limited market adoption to date.
Other trends in up-and-coming glazing technology are those that dynamically adapt properties to climate conditions or energy load13 and photovoltaic (PV) technologies that convert incident sunlight into electricity.14 There have been numerous independent studies on specific applications of dynamic and PV glazing technologies that suggest they will lead to building energy savings.15,16,17,18,19,20 The success of these technologies in the vast number of scenarios where they can be deployed is not clear. A comprehensive study considering climate zones representing all major cities of the world, a fair comparison of most of the leading next-generation window technologies, and variable building geometries (WWR, footprint shape, and others) has not been presented to date.
Here we develop a building energy model that connects length scales from nanometers to meters and time scales from minutes to years. The mesoscopic multiphysics model is used as a platform for comprehensive comparison of the many different next-generation glazing technologies. Although technologies focused on thermal performance demonstrate clear energy- and carbon-saving benefits over their predecessors, PV glazing uniquely couples thermal performance to on-site energy generation. Savings in primary energy use and carbon emissions can be as high as 40% over substandard windows, amounting to energy savings as high as 37,000 GJ per year for a typical, highly glazed office building. The corresponding carbon dioxide emissions can be reduced by more than 2 million kg per year. Although quantitative results vary by climate zone, the energy performance of buildings in all locations stand to benefit from next-generation window technologies. PV windows—perhaps unintuitively—offer temperate locales like New York City more energy/CO2 savings than sunnier cities such as San Diego. We demonstrate that PV glazing is a promising way to reconcile humanity’s love affair with highly glazed buildings and determine general design rules for achieving net-zero, and even net-positive, highly glazed buildings with PV skins.
Results
Energy balance and design of glazing units
Glazing units in building façades are complex systems that must balance esthetics and human factors in addition to energy flow. The unit is an insulating barrier to thermal energy, and it manages incident sunlight, which is transmitted, reflected, or absorbed by the glass or layers on the glass (Figure 1B). The effects of energy flow within a glazing unit on performance are captured by the following commercially used metrics. (1) The U-factor is a measure of thermal insulation of the unit. It is the primary deficiency of glazing compared with opaque building materials. (2) The solar heat gain coefficient (SHGC) is the fraction of solar power transmitted inside the building.
It has two components: incident light of any wavelength directly transmitted through the glass and energy that is absorbed in the unit and transferred to the interior by thermal transport via conduction, convection, or radiation. (3) Visible transmittance (VT; also often referred to as visible light transmittance [VLT] or average VT [AVT])21 is the fraction of visible light that enters the interior. Visible light is defined by the photopic eye response function (Figure 1C). Visible light composes the most energy of the solar spectrum (∼50%; Figure 1C) and contributes considerably to the SHGC, but it is often maximized to accommodate human factors such as natural light, views, connection to the outdoors, etc.
Low-e technology is a part of any modern glazing unit. We simulate low-e-coated glass for building energy modeling using available literature data. In our model, insulating glass units are built to meet or exceed regional efficiency codes based on current standards.22 Low-e coatings are most commonly composed of alternating layers of ultrathin silver and dielectric materials.23 They are designed to minimize solar energy transmission in the non-visible regions of the solar spectrum (Figure 1C)—ultraviolet (UV) and infrared (IR)—and maximize VT. Energy efficiency codes based on region will often reduce VT to achieve acceptable SHGC because the two metrics are coupled together.
Layers that comprise dynamic and PV glazing commonly have thicknesses of less than 1 μm, which is on the order of the wavelength of incident sunlight. We employ custom software that solves Maxwell’s equations using the transfer matrix method (TMM) to accommodate nanoscale interference effects.24 Dynamic glazing transitions between two states: a high-VT bleached state and a low-VT colored state. We design dynamic glazing to have large swings in SHGC by modulating the visible and near-IR as a response to changes in temperature (thermochromism),25 but significant work has also gone into commercialization of electrochromic windows.26 Our design has a bleached-state VT of 63.1% and colored-state VT as low as 0.4% (Figure 1D). Low-e layers are included on the inner surface of the dynamic laminate to reduce the SHGC because of IR transmissivity.
PV windows are characterized in terms of their power conversion efficiency (PCE)—the fraction of solar power incident on the window that is converted to electrical power—in addition to the metrics used by non-PV windows that are based on thermal and radiative performance: VT, SHGC, and U-factor. The external quantum efficiency (EQE) indicates what fraction of photons at each wavelength is converted to electrical energy. For PV laminates, power absorbed in the PV absorber layer is determined in the TMM code and used to compute the power generated by the PV window using detailed balance analysis and assuming appropriate losses in the system (experimental procedures; Tables S1 and S2).14
We study the following three distinct PV glazing technologies. (1) Non-wavelength-selective PV technology leverages conventional single-crystal Si by segmenting the cells in a spread-out pattern that allows light to pass between the cells. This category also include next-generation thin-film technology that is thinned enough to allow light through it (also called semitransparent PV27). Thin-film technology includes absorbers such as amorphous Si,28 copper indium gallium selenide (CIGS),29 cadmium telluride (CdTe),30 and metal halide perovskites.31 Each absorber material has similar optical properties with an absorption onset in the near-IR that extends through the visible (Figure 1E, EQE spectrum). Non-wavelength-selective PV glazing must have an EQE of less than 1 to transmit visible light unless the bandgap of the absorber material has an absorption onset at energies higher than the visible range, which significantly limits PCE but may have interesting applications, like powering electrochromic glass.32
We select perovskite-based thin-film PV glazing in this work to represent non-wavelength-selective PV technology because of the massive research undertaking in the last decade and current race for widespread commercialization.33 (2) Wavelength-selective PV technology, also called “transparent” PV technology,21 uses excitonic absorption of organic materials in the form of compact thin films34 or solutions of dyes35 to selectively harvest UV and IR light. The strategy does not sacrifice PV performance for high VT. (3) Dynamic PV technology, also called switchable or chromic PV technology, is a new PV window paradigm that has emerged in the last 5 years and combines dynamic glazing technology with PV conversion. The glazing reversibly converts visible sunlight into electricity by transitioning between a high-VT bleached state and a low-VT colored state that is photovoltaically active (Figure 1G).
There are now a number of different state-switching mechanisms, including photochromism in organic dyes,36,37,38 hydrogen redox of non-PV layers (gasochromism),39 and phase transformations because of temperature (thermochromism).40,41 We simulate metal halide perovskite-based dynamic PV technology because of the many chemistries developed42,43,44 and examples of high performance. Like wavelength-selective PV technology, dynamic PV technology sidesteps the tradeoff between VT and PCE in PV windows. For each technology, layer thickness was chosen to obtain an SHGC below the regional requirements to meet 2019 American Society of Heating, Refrigerating, and Air-Conditioning Energineers (ASHRAE) standards for thermal performance while maximizing PV conversion.
Glazing units for each technology are completed by incorporating simulated PV laminates into code-compliant glazing units using Lawrence Berkeley National Laboratory’s Window software.6 PV laminates on the outboard pane change SHGC and VT, but the U-factor remains constant because it is most largely influenced by the number of panes, relative permittivity of the glass surfaces, and the gas fill between panes. A comprehensive list of the different materials and thicknesses applied to each glazing technology and performance metrics of insulating glass units is provided in Figure S2 and Tables S3–S5. The color was determined for exemplary device stacks (Figure S3). PV windows must live up to esthetic standards in addition to energy considerations. Undesirable colors can be made neutral or transformed into others by alternative chemistries, tuning thicknesses of layers, or adding layers to the device stacks considered here.45
High-fidelity simulations of building energy use
We translate glazing units simulated with nanoscopic detail to large-scale building energy simulations with high time fidelity by incorporating glazing units into a physics-based building energy simulation tool (EnergyPlus46 and OpenStudio47 software platforms). Typical Meteorological Year, Version 3 (TMY3) weather data were employed, which include realistic sequences of time-dependent weather observations. They are used against the building model to simulate various forms of energy consumption (e.g., heating, cooling, lighting) in the building in 15-min intervals over the course of a year.
The amount of solar energy that enters a building through glazing is a strong function of the solar angle of incidence (θ; Figure 2A). Over the course of a day, our model shows changes in the absorptivity, transmissivity, and reflectivity of the glazing as the solar angle changes (Figures 2B and 2C). For example, there is near-direct sunlight at sunrise on the eastern façade of the building when cos(θ) = 1. cos(θ) decreases as the sun rises in the sky and moves to the west until roughly noon, when the sun is at its apex. There is a spike in reflectivity that results in decreased transmissivity and absorptivity. Increased reflectivity is expected at highly oblique angles. The peak is reproduced using an approximation to reflectivity calculated using the Fresnel equations (Schlick’s approximation) for an air-glass interface (Figure 2A).

(A–F) An illustrative dataset capturing numerous aspects of glazing on the eastern face of a 12-story building with a WWR of 95% for numerous window cases.
(A) Cosine of the solar incident angle (θ) with the window surface and approximate reflectivity based on Schlick’s approximation to the reflectivity for an air-glass interface. The effective refractive index for the glass was chosen to be a constant 3.
(B and C) Reflectivity, absorptivity, and transmissivity.
(D) Window surface temperature.
(E) PV power generated and solar radiative power on the window surface.
(F) Power used for interior lighting of the building.
The transition temperature (Tt) of the dynamic window is 25°C. A shaded box highlights the transition. Code, code compliant; S, wavelength-selective; Dyn, dynamic.
--------------------
The temperature outside of the building, along with incident solar radiation that is absorbed, will affect the temperature of the glazing. The surface temperature of the eastern-facing glazing increases as much as 60°C above air temperature when under solar illumination (Figure 2D). For dynamic glazing, the surface temperature in the model is used to trigger a change in the optical properties from the bleached state to the colored state. The colored state has an increased absorption in the visible spectrum, which results in a significant drop in transmissivity and increase in absorptivity of the glazing (Figure 2C). Increased absorptivity leads to an increase in glazing surface temperature relative to glazing with a fixed transmissivity.
In PV glazing, the absorbed energy that leads to a temperature rise can instead be converted into electricity. The power generated is a fraction of the incident solar radiative power. The change in absorptivity, reflectivity, and transmissivity as a function of solar angle leads to a change in the fraction of converted energy as the angle of the sun changes throughout the day (Figure 2E). The PCE of a PV glazing is typically reported at normal incidence. Here we leverage TMM software to determine the angle-dependent absorption in the PV absorber layer, which yields an angle-dependent PCE. EnergyPlus uses a function fitted to angular PCE data to determine power converted from any solar incidence (Figure S4).
Wavelength-selective PV glazing will convert sunlight whenever illuminated, whereas dynamic PV glazing must reach a critical transition temperature (Tt) to convert into the colored phase before significant energy conversion occurs. Our previous work showed the ideal switching temperature of thermochromic dynamic windows to be between 20°C and 27.5°C.48 In our example, Tt = 25°C is never reached on the first day of the simulation. As a result, no power is generated, and the lighting power remains similar to static glazing technologies. However, on the second day (shaded box, Figures 2C–2F), the glazing surface temperature exceeds Tt around 06:00. A large increase in absorptivity is observed at the same time when power conversion increases and lighting power is increased. The building responds to low-VT windows by increasing the lighting power in the eastern façade region (Figure 1E).
Energy and CO2 savings because of glazing thermal performance
Our model successfully simulates the dynamic interplay of changing weather and solar conditions with time, static or dynamic glazing properties, and building energy response to capture the complex physics of building energy use. We combine high-fidelity temporal data to perform a seasonal analysis of highly glazed buildings. Glazing-dependent building energy consumption and CO2 emission were analyzed by subtracting the performance of a baseline building with single-glazed windows. All energies shown are primary energies unless otherwise noted. Site energy does not include the losses intrinsic to generation—which is often based on thermal power cycles driven by combustion—and delivery on the electricity grid, which is inherently lossy. Analysis was carried out on a building with a square footprint, 12 stories, and fixed floor-to-floor height.
We selected two disparate climates for comparison of glazing thermal performance. Milwaukee represents a highly seasonal climate that is cold and humid (ASHRAE zone 6). Tucson is less seasonal with high solar irradiation (ASHRAE zone 2). Electricity energy savings are primarily due to reduced cooling in the summer months for both climates (Figure 3A). Both sites require similar amounts of energy to keep the buildings cool despite disparate climates. Glazing units with solar control coatings (code compliant) significantly outperformed double-pane windows with no coatings for VT or SHGC control. The dynamic triple-pane window provides the highest energy savings in Milwaukee, whereas the triple-pane window with no dynamic element shows the most savings in Tucson. Reductions in CO2 emissions directly track with reductions in energy consumption. CO2 emissions were calculated using state-level data, where the local mix of energy generation methods is reflected in an emission-per-energy value (see details in the experimental procedures).

(A–C) Improvements of the thermal and optical performance of windows have led to dramatic decreases in energy use and CO2 emissions over time. Here the amount of energy (upward bars) and CO2 (downward bars) saved as a result of switching from single-pane windows to higher-performance choices is shown for two locations (climate zones) and for summer (June–August) (A), winter (December–February) (B), and shoulder (March–May and September–November (C) months. Energy use is split into natural gas (white background) and electricity use (shaded background). Conventional metrics for window thermal and optical performance—visible transmittance (VT), U-factor, and solar heat gain coefficient (SHGC)—are shown superimposed as symbols on top of the bar charts. For dynamic glazing, VT and SHGC are the calculated average of the colored and bleached states based on ASHRAE convention. The Tt of the dynamic glazing is 25°C. Double, double pane; triple, triple pane; N, non-wavelength-selective.
------------------------------
Winter months are dominated by natural gas heating (Figure 3B). It is not surprising that the U-factor of the glazing unit is the largest driver for energy and CO2 savings for both regions because losses by conduction through the glazing unit increase heating requirements. Energy and CO2 savings because of advanced glazing is more than a factor of two higher in winter months than in summer months in Milwaukee. Triple-pane and dynamic triple-pane glazing save more than 8,000 GJ of heating energy and 350,000 kg of CO2 emissions compared with single-pane glazing. Dynamic glazing has high performance in winter by allowing greater passive heating. Electricity savings decrease by more than 1,000 GJ across all advanced glazing technologies because electricity demand is now dominated by lighting, plug load, and fan use rather than cooling during the winter months.
Glazing technologies that provide the largest shoulder season savings largely mimic winter in Milwaukee and summer in Tucson (Figure 3C). Lower SHGC and VT again track with electricity savings because of cooling in both regions. In both regions, an increased U-factor is the greatest benefit when only considering thermal performance of next-generation glazing. Modulating VT and SHGC is of secondary concern, but it plays a larger role to offset heating by passive solar heat gain rather than mitigating cooling energy. This is surprising because dynamic SHGC modulation is commonly discussed as an effective technology in regions with high solar irradiation, like Tucson, to reduce cooling loads. Although we discuss two example regions to dissect seasonality effects, our conclusions do not significantly vary across the 8 climate zones we investigated.
PV glazing for more efficient buildings across climates
We consider three PV technologies in this work: non-wavelength-selective, wavelength-selective, and dynamic. Wavelength-selective and dynamic PV technologies are transformative because they each sidestep the tradeoff between VT and PCE found in non-wavelength-selective PV technology. There are distinct advantages to both. Wavelength-selective PV technology retains a high static VT to resemble conventional low-e glazing. Dynamic PV technology couples the energy savings of dynamic glazing with PV conversion. The high-VT state has a VT similar to low-e glass, and the low-VT colored state not only reduces SHGC but also increases the power conversion of PV by absorbing and converting more incident sunlight than other technologies. The dynamic behavior is a function of temperature, which leads to significantly different power output and transmissivity transients (Figure 2E).
Cooling energy to overcome solar heat gain is exacerbated by highly glazed building envelopes. Opaque building-integrated PV technology has long been suggested as a tool for on-site energy generation to shave daytime peak loads.49 The same benefits are achieved with a high window-to-wall building envelope when imbued with PV glazing. Summer and shoulder months show that on-site PV generation can decrease the day-averaged building electricity load by approximately half in a 12-story building with WWR = 0.95 in Denver, Colorado with wavelength-selective PV glazing (Figure 4A). The generation is approximately proportional to the demand over the course of a day; higher loads mean higher generation. This reflects the sensitivity to sunlight of highly glazed buildings but also the direct offset that PV windows provide. Similar results are found for dynamic PV glazing, which also greatly enhances glare comfort by tinting to low-VT states (Figure S5).

(A) Site building electricity use and PV generation simulated at 15-min intervals and averaged over seasons in Denver, Colorado. Solid lines represent means, and shaded areas show one standard deviation from the mean.
(B) Monthly PV generation data of a 12-story building in Milwaukee, Wisconsin with a 95% WWR for dynamic and static PV technology.
(C and D) Percent energy reduction over the single-pane case for glazing with no energy generation (C) and potential for further reduction as PV windows increase in PCE (D) in Tucson, Arizona.
Colored bars in (B) correspond to markers in (C). The inset provides thermal and radiative performance metrics for each glazing unit in (B) and (C). For dynamic glazing, VT and SHGC are calculated by averaging values of the colored and bleached states based on ASHRAE convention. The Tt of the dynamic window is 25°C. Arrows in (C) indicate the state of the art for lab-scale reports of non-wavelength-selective, wavelength-selective, and dynamic PV PCE from Mujahid et al.,30 Li et al.,50 and Wheeler et al.,40 respectively.
--------------------------------
Over the course of a year, a clear trend in PV generation emerges in climates with weather that changes strongly with season. Dynamic PV glazing generates more electricity in hotter months (April through October), with more than 1,200 GJ of generation in June and September but less than 200 GJ during winter months (December and January; Figure 4B). In contrast, static wavelength-selective PV consistently generates more than 500 GJ each month but never exceeds 1,000 GJ for any single month.
Glazing units designed with an outboard PV laminate maintain the thermal performance of code-compliant, double-pane, low-e units. We separately evaluate thermal performance of PV windows by removing energy generation from the glazing in the simulation. The three different PV glazing technologies considered here (non-wavelength-selective, wavelength-selective, and dynamic) provide performance comparable with code-compliant glazing with a reduction in energy use of nearly 25% relative to single-pane glazing in Denver, Colorado (Figure 4B).
PV conversion contributes significantly on top of thermal performance enhancements. Although a transition from single-pane to code-compliant glazing improves building energy use from 22% to 25%, PV glazing with a PCE as low as 6% reduces energy use by more than 30% (Figure 4C). More than 30% energy use reduction is realized across PV technologies. Increasing PCE reduces building energy use even more. Non-wavelength-selective and wavelength-selective technologies reach more than 40% energy use reduction when PCE = 12.5% performance is coupled to a code-compliant or triple-pane unit. The distinction between the two technologies is VT; non-selective PV glazing requires VT = 21.2% to reach PCE = 12.5%, but wavelength-selective technologies can reach the same PCE with a VT that is nearly double that value (VT = 41.7%).
However, non-wavelength-selective PV is more mature, and examples of perovskite PV devices exhibiting PCE = 12.5% and VT = 21.2% have been demonstrated.31 The state of the art for wavelength-selective PV glazing stands closer to PCE = 10.8% at VT = 45.7%,50 but the metrics simulated with PCE beyond the state of the art here are easily within thermodynamic limits.51 Dynamic PV glazing has the greatest potential for building energy savings of nearly 50% because of the significant absorption in the low-VT colored state, which leads to higher theoretical PCE. Dynamic PV is also immature. PCE = 11% is the highest reported low-VT state efficiency to date,40 but rapid progress on static perovskite PV with PCE > 25%52 is an encouraging indication that low-VT state PCE > 15% is possible for dynamic PV.
Despite the disparate climate zones of the United States, we are able to draw general conclusions about the effect of next-generation glazing on building energy use and CO2 emissions. We investigate eight cities in eight different climate zones (Figure 5A)53: Honolulu, Hawaii; Tucson, Arizona; San Diego, California; Denver, Colorado; New York, New York; Milwaukee, Wisconsin; International Falls, Minnesota; and Fairbanks, Alaska. Just like the Denver example (Figures 4E and 4F), PV glazing has the greatest savings relative to single-pane glazing across all cities. Dynamic PV has the highest potential savings amongst PV technologies. Triple-pane technologies outperform double-pane technologies with the exception of San Diego, where dynamic double-pane glazing is superior. There are also regional differences that should be highlighted.
The greatest energy savings relative to single-pane glazing occurs in Fairbanks, where reduced heating load is the leading contributor, but solar conversion in summer months contributes as well. The greatest CO2 savings are in Denver, where 2 million kg of annual CO2 emissions could be saved with better glazing. Estimates of carbon emission savings are based on state-level data. Colorado has higher CO2 emission per electricity used compared with other regions. It would be easy to assume that regions with high solar irradiance, like Honolulu, Tucson, and San Diego, would benefit the most from PV windows. However, Tucson and San Diego have a smaller benefit from PV glazing, or any glazing improvement relative to single-pane, compared with the five colder or more seasonal climates with heavier heating loads.

(A) Map showing the eight climate zones of the United States as defined by ASHRAE.53 Stars denote representative city locations for each climate zone.
(B) Energy and CO2 emission reductions for five glazing technologies in cities representing all 8 climate zones in the United States. Climate zones are listed in order from 1 (Honolulu, Hawaii) to 8 (Fairbanks, Alaska). Static and dynamic PV cases correspond to double-pane windows meeting the 2019 ASHRAE standard with 9.28% and 15.2% PCE and 41.7% and 31.75% VLT, respectively. Savings are relative to identical buildings with single-pane windows. The Tt of the dynamic window is 25°C.
-----------------------------
Highly glazed net-zero buildings enabled by PV glazing
Our building energy analysis shows significant opportunities for building energy and CO2 savings using PV glazing in highly glazed buildings across disparate climate zones. Our prior analysis was on a building with a fixed base configuration with varying window types and WWR values. In this section, we explore new configurations to specifically exploit PV glazing by investigating the WWR, aspect ratio of the building shape, number of stories, and floor-to-floor height (Figure 6A) on a building with dynamic PV windows.

(A) A representation of the parameter space searched for building designs achieving net zero and lower energy use. The building is located in Denver, Colorado, with dynamic PV windows.
(B) Dimensionless energy as a function of WWR, highlighting decreasing energy use with increased glazing for PV glazing.
(C) Contour of annual net energy usage as a function of WWR and building aspect ratio for a 30-story building with floor-to-floor height of 20 feet.
(D) A plot representing the distribution of energy use as the building grows taller. The left axis shows the fraction of energy each building process is using, as represented by the stacked plot. Lines show primary energy use corresponding to the right axis. The aspect ratio and the floor-to-floor height are held constant at 0.1 and 20 ft, respectively. The Tt of the dynamic window is 25°C.
------------------------------
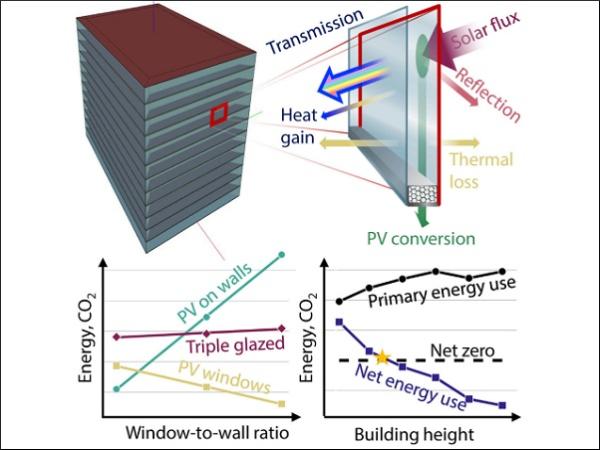
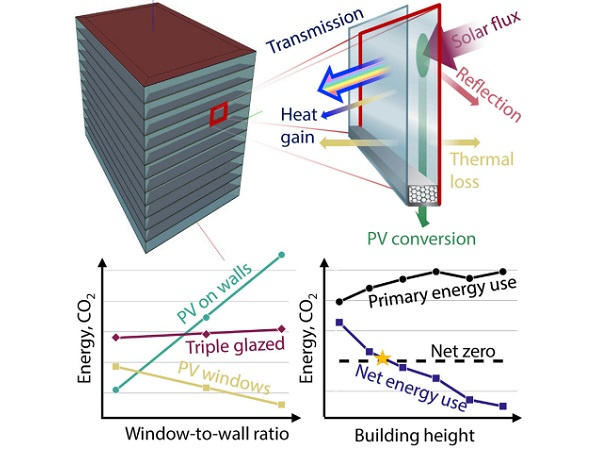
We considered highly glazed buildings (WWR = 95%) for most of our analyses to clearly illustrate the effect of glazing on building energy performance. When we reduce the WWR, there is a remarkable trend; although glazing technologies designed exclusively for thermal performance increase energy use when the WWR is increased, the energy use of the building decreases when the WWR is increased for PV glazing (Figure 6B). That is, more glazing is actually desirable for building energy use reduction when PV energy conversion is considered. This notion is contrary to convention, where buildings with highly glazed façades are reflexively perceived as energy inefficient. A similar trend is true when PV panels are positioned on the opaque wall areas of the building; a lower WWR means lower energy use. The buildings with the lowest possible energy use of all cases simulated here are those where the opaque walls and windows are PV surfaces. These results point to unique opportunities for vertical PV technology on opaque glazing (spandrel glass) or other areas.
The flipped trend in WWR because of PV glazing enables the design of highly glazed net-zero buildings. We find that larger floor-to-floor height reduces building energy use with PV glazing. The aspect ratio of the building is also important for maximizing PV solar energy conversion. Although stationary rooftop or ground-mount PV panels face south in the northern hemisphere to maximize energy yield, vertical panels actually benefit from an east-west configuration to maximize solar irradiation by capturing early-morning and late-day sun. For example, we find that a 30-floor building with a 20-foot floor-to-floor height will reach net zero when the north/south-to-east/west ratio is less than 0.2 (Figure 6C). We acknowledge that there are practical barriers to constructing a building. An unconventional floor-to-floor height can increase construction cost and reduce the rentable area, reducing the income potential. The building footprint is often constrained to a plot of land of predetermined size, especially in an urban setting, making the choice of north/south-to-east/west ratio moot. However, we offer an analysis of these trends in hopes of guiding choices where available and highlighting how choices in building design can have consequences that are not obvious when incorporating PV glazing.
Finally, we demonstrate that scaling laws work strongly in favor of PV glazing. That is, primary energy use increases more slowly than PV generation as floors are added to highly glazed buildings (Figure 6D). In another example, a 0.1 north/south-to-east/west ratio building with 20-foot floor-to-floor height will reach net zero with 15 floors or greater. The result for the same building with 10-foot floor-to-floor height shows the same trends (Figure S6). Net energy use monotonically decreases as the building gets taller. Although heating load scales negatively with height, PV generation, lighting, and plug load scale positively to yield a net negative energy trend. Although taller buildings may result in higher embodied energy (energy to produce materials and assemble them) per floor, the operational energy (energy use during building operation) is responsible for 78%–89% of the total energy use over the life cycle of a building.54 Based on our simulations, we provide the following design rules, enabled by PV glazing for highly glazed building design. (1) A larger WWR is better for building energy performance. (2) A larger floor-to-floor height is desirable. (3) A low north/south-to-east/west ratio maximizes PV generation. (4) Taller buildings trend toward net zero.
Discussion
Although widespread adoption of double-pane insulating glass units and low-e coatings in prior generations of buildings led to significant advances in reducing primary energy consumption and CO2 emissions, the current generation of buildings has not found a defining technology to address the greatest challenge of our generation: anthropogenic climate change. If the architectural world remains unwilling to move away from highly glazed buildings, and we continue to urbanize at unprecedented rates, then a transformational glazing technology must emerge.
In this work, we take a wholistic look at highly glazed buildings and effects of emerging glazing technologies using a mesoscopic building energy model. Our analyses show that new designs for high thermal performance, like triple-pane or dynamic technologies, do not offer the step-like increase in performance that double-pane or low-e technologies did in the past. However, PV glazing is easily integrated into existing code-compliant double-pane or triple-pane glazing to significantly reduce building energy use and CO2 emissions. We show a similar step-like increase in performance for each of the three different versions of PV glazing, and we demonstrate that these savings are realized across eight disparate climate zones of the United States. Energy use reductions over substandard windows are as high as 42% when using PV window technology with lab-proven PCE. A possible improvement of more than 50% is achievable for technologies with efficiencies that are possible but not yet realized. Savings for a typical office building with a high WWR range from about 10,000 GJ per year in San Diego, California, to almost 40,000 GJ in Fairbanks, Alaska.
Much of the savings in cold climates are due to enhanced thermal performance. However, climates with widely ranging temperatures, such as New York City and Denver, show comparable or better performance gains than sunny and warm San Diego. High thermal performance windows with PV laminates were shown to generate more electricity than the increase in energy cost with addition of more floors for certain geometries. We found that buildings with a north/south-to-east/west ratio of its footprint and slightly taller than standard floor-to-floor heights can result in a building with net-zero energy use around 20 floors; additional floors lead to a net-positive building. Other technological opportunities, such as incorporation of electrochromic technology55 in tandem with high-VT PV glazing, were not explored but offer results similar to the dynamic PV technology considered here for controlling heat gain and reducing glare associated with the highly glazed east- and west-facing façades suggested here to maximize PV generation.
There are limitations to the one-dimensional building energy modeling carried out here that should be highlighted, including lack of shading considerations, homogenization of the environment experienced by each building story, and other realistic effects, such as heating, ventilation, and air conditioning equipment failure. The buildings and model chosen for study here are those recommended by Department of Energy to provide a consistent baseline of comparison to assess new technologies.56 All results are relative to reference buildings under the same conditions, so model shortcomings should be largely consistent between the two and not affect the relative improvements. A few results here are considered in absolute terms; these are highlighted in Figures 6C and 6D. EnergyPlus has been validated experimentally and against three-dimensional simulations for single- and multi-story buildings.57,58
PV glazing is often cast aside as impractical because it does not generate as much electricity as conventional rooftop or utility-scale PV technology. However, when PV generation is considered a component of glazing performance, like SHGC or U-factor, the benefits of PV glazing become clearer. Still, there are a number of challenges with widespread deployment. (1) Integration: the current construction market is not broadly trained to integrate PV into the building power system, which increases the soft costs of PV glazing and the time for return on investment, a significant driving force in the complicated web of incentives in commercial construction.59 (2) Durability: PV glazing lifetime plays a role in return on investment because replacement of glazing is disruptive and expensive.
Building materials are expected to last for 30 years or more. Although mature solar panel technology often comes with 25-year warranties, PV glazing products are too immature to offer such buyer comforts. Recent work has demonstrated encouraging results for the durability of non-wavelength-selective60 and wavelength-selective34 PV technologies. (3) Shading: urban buildings rarely have uninterrupted sunlight exposure, as we assumed here. Our results represent an upper bound for building performance because shading is not considered. Practical deployment strategies must take this into account.61 (4) Cost: the maximum installed cost of vertical PV panels for grid parity was recently estimated for various geographic locations as a function of module efficiency and lifetime and showed that existing silicon technology has a levelized cost of energy similar to commercial grid electricity in Arizona.
Future predictions are most sensitive to module cost and efficiency,62 two areas that show tremendous potential to be changed by the thin-film PV and PV glazing technologies considered here. For glass façades in particular, thin-film PV glazing makes sense because the single most expensive component of the technology is the glass,63 a component that will be incorporated into the building envelope anyway. The payback period of PV glazing is expected to be well within the expected lifetime of the device; as short as 2–6 years was recently estimated for wavelength-selective PV windows.64
Despite deployment challenges, we believe this work should provide a vision for how to reconcile the desire for highly glazed buildings with the building energy performance needed for a net-zero future. We developed high-level design rules for building geometry based on PV glazing to achieve net zero. The work should be a starting point for future building design and motivate a pivot from the focus on improved thermal performance in glazing to PV generation. It is a transition that may be necessary to address impending climate change goals without sacrificing the architectural freedom of highly glazed façades. With the maturation and deployment of PV glazing, perhaps we can have our cake and eat it, too.
Experimental procedures
Resource availability
Lead contact
Requests for further information and reagents should be directed to and will be fulfilled by the lead contact, L.W. (lance.wheeler@nrel.gov).
Materials availability
This study did not generate new unique materials.
PV window model
We developed the PVwindow software to simulate nanoscale stacks of materials that compose dynamic or PV glazing (github.com/NREL/PVwindow). The software solves Maxwell’s equations for stacks of optically thin and thick materials to yield spectral absorptivity, reflectivity, and transmissivity at a chosen incident solar angle. The TMM is used for solution. The mathematical development of the approach is available from the author of tmm,65 a software package utilized by PVwindow for optical simulation. The absorptivity spectrum of the PV absorber layer is extracted from the simulated materials stack and multiplied by the internal quantum efficiency (IQE) to yield the EQE spectrum.
IQE is treated as an independent variable, assumed to be a constant between zero and one, and is applied across all wavelengths. We apply IQE = 0.4, 0.6, or 0.8 for simulations here. IQE is used to generically capture losses because of electrical transport, recombination, and other PV system losses. PCE is then determined using a modified detailed balance analysis using the EQE spectrum to determine the number of converted photons.14 Consult Tables S1 and S2 for mathematical details. For building simulations, the EQE spectrum is removed from the absorptivity and added to the reflectivity spectrum to ensure that energy is conserved in the building and that the converted energy does not contribute to solar heat gain in the building.
In PV glazing, conservation of energy in the glazing unit is slightly modified from A + R + T = 1 to adjust for the absorbed photons that are converted to electricity. All PV glazing units must satisfy
![]()
where A, APara, R, and T are total absorption, parasitic absorption (fraction of photons absorbed in the glazing and not in the PV material), reflection, and transmission, respectively. EQE and IQE are integrated to give scalar values between zero and one. Equation (1) is a necessary statement of conservation of radiative energy. The values in it are quantified using PVwindow and used as inputs to the building energy modeling software EnergyPlus to ensure that energy conservation is not broken with addition of PVs to the window surfaces.
The design of windows for input into EnergyPlus is described in Figure S7. PVwindow is used in conjunction with WINDOW,45 an open-source software for analyzing window designs, to obtain the optical, PV, and thermal properties of proposed window designs. The window layer materials and thicknesses are altered to achieve compliance with 2019 ASHRAE standards22 and maximum PCE as appropriate.
Building energy modeling
Large-scale building energy simulations were conducted with (1) EnergyPlus (v.9.4) as the simulation engine and (2) OpenStudio (v.3.1) as the interface for configuring all simulations of interest. A medium office building model was adopted from the Department of Energy (DOE) prototype building models,66 which include separate (and predefined) building subsystem models, such as envelope, heating, ventilation, and air conditioning (HVAC) system, lighting, plug load, etc., for a physics-based building energy simulation. The mathematical details of the energy modeling carried out by EnergyPlus are too extensive to repeat here but are readily available. TMY3 weather data are used to simulate against the building model.
Several features are ensured or newly implemented to properly assess the effect of different window technologies. The lighting system considered in the simulations has the capability of dimming the interior lights based on the illuminance level in the interior space. Thus, the effect of colored (or bleached) windows that can result in increased (or decreased) interior lighting energy use is captured. Dynamic glazing considered in the study is controlled (i.e., switched) between colored and bleached states based on the Tt threshold. The temperature of the glass surface facing the ambient is tracked in every simulation time step. The state of the window switches to colored (or bleached) when the outer-surface temperature is higher (or lower) than the Tt. Vertical surfaces (compared with the horizontal roof) facing various cardinal directions will experience different solar radiation throughout the day, affecting the PV output. Thus, regression models that calculate dynamic PCE based on the solar incident angle are implemented for PV windows to simulate the variation of PV output in different cardinal directions throughout the year. Because dynamic PV has performance differences between colored and bleached states, two different sets of regression models are applied to reflect the PCE (Figure S8).
To increase computational efficiency for running large-scale simulations, some of the detailed physics are simplified in the simulation setting. For a building that is higher than three stories, only three separate floors (a bottom floor contacting the ground, a top floor facing the sky, and a middle floor in between) are modeled, assuming that floors in the middle behave the same in terms of energy and comfort (Figure S9). For example, a 12-story building is simulated by modeling three floors (top, bottom, and middle) for calculating the energy balance in each floor. Then the energy consumption (e.g., heating, cooling, lighting, PV) of the middle floor was multiplied by 10 (12 minus the top and bottom floor) to scale the energy consumption of the single middle floor to multiple middle floors. Real buildings with a similar building footprint can have diverse layouts on each floor.
The perimeter zone is less than half the core zone in the DOE prototype medium office building mostly used here, which results in less lighting energy savings with daylighting (Figure S9). A modified simple model for modeling PV is used for EnergyPlus simulation.67 It takes inputs of PV surface area, fraction of surface area with active solar cells, total solar radiation incidence on PV array, PCE, and inverter efficiency to calculate electricity generation output. The model also included an additional feature for dynamically varying the efficiency based on the solar incident angle. Glazing also has different modeling options available in EnergyPlus.68 Windows can be modeled using constant properties (e.g., U factor, SHGC, VT) or by considering the full spectrum of solar radiation with a trade-off between detailed physics and computational efficiency. Spectral optical properties are included in this study.
To simulate numerous combinations of parameters of interest and remove the manual effort of creating and simulating various building configurations, tools61 such as OpenStudio, Parametric Analysis Tool (PAT), and Amazon Web Services (AWS) were used. OpenStudio was used to (1) create an automated workflow for developing a building model from scratch based on configurations defined in the DOE prototype building model and (2) modify the building model to implement various glazing technologies. After the OpenStudio workflow creates a base building model, PAT is used to create a parametric simulation environment by modifying the base model to include all combinations of different parameters of interest. The total number of combinations representing the total number of building energy simulations is then deployed on the AWS server for handling large-scale simulations. Each simulation is conducted for a year with a 15-min simulation time step.
Simulation results predict site energy use. State-specific data, as reported by the Environmental Protection Agency (EPA), are used to calculate primary energy use from site use;69 thermal inputs are divided by total energy outputs to estimate the thermal efficiency of combustion-based electricity generation methods. Site energy use is multiplied by this value to estimate primary energy use. Carbon dioxide generation per unit of electricity generated was estimated using the same EPA dataset with state-specific energy generation resource mixes.
Acknowledgments
This study was authored by the National Renewable Energy Laboratory, operated by Alliance for Sustainable Energy, LLC, for the Department of Energy (DOE) under contract DE-AC36-08GO28308. Funding was provided by the Building Technologies Office of the DOE Office of Energy Efficiency and Renewable Energy. The views expressed in the article do not necessarily represent the views of the DOE or the U.S. Government. The U.S. Government retains and the publisher, by accepting the article for publication, acknowledges that the U.S. Government retains a nonexclusive, paid-up, irrevocable, worldwide license to publish or reproduce the published form of this study, or allow others to do so, for U.S. Government purposes.
Author contributions
L.M.W., C.E., and R.C.T. conceived the idea. V.M.W. and L.M.W. developed PVwindow for optical and photovoltaic simulation. J.K. developed and deployed the building energy modeling simulation. V.M.W., L.M.W., T.D., and B.A.R. worked up and interpreted the simulation data. V.M.W. and L.M.W. wrote the paper. All authors discussed the results and revised the paper.
Declaration of interests
V.M.W. owns 2qV Technology Company, which is dedicated to the commercial development of façade PV technology.
Inclusion and diversity
We support inclusive, diverse, and equitable conduct of research.
Supplemental information
Download all supplementary files included with this article:
Download : Download Acrobat PDF file (2MB)
Document S1. Figures S1–S9 and Tables S1–S5.
Download : Download Acrobat PDF file (6MB)
Document S2. Article plus supplemental information.
Data and code availability
Data generated by the building energy models for this study are available at https://doi.org/10.5281/zenodo.7243452. The code used to generate window inputs, PVwindow, is available at github.com/NREL/PVwindow.