Authors: Mikhail Vasiliev, Victor Rosenberg, David Goodfield, Jamie Lyford and Chengdao Li
Source: Sust. Build., 6 (2023) 5
© M. Vasiliev et al., Published by EDP Sciences, 2023
DOI: https://doi.org/10.1051/sbuild/2023006
Abstract
A number of modern glass and window products based on novel glazing designs, low-emissivity thin-film coatings, and proprietary fluorescent interlayer types have been developed recently. Advanced windows of today can control properties such as thermal emissivity, heat gain, colour, and transparency. In novel glass products, solar energy harvesting through PV integration is also featured, enabled by either patterned-semiconductor thin-film energy conversion surfaces, or by using luminescent concentrator-type approaches to achieve higher transparency. Typically, semitransparent and also highly-transparent PV windows are purpose-designed, for applications in construction industry and agrivoltaics (greenhousing), to include special types of luminescent materials, diffractive microstructures, and customized glazing systems and electric circuitry. Recently, significant progress has been demonstrated in building integrated high-transparency solar windows (featuring visible light transmission of up to 70%, with electric power output Pmax ∼ 30−33 Wp/m2, e.g. ClearVue PV Solar Windows); these are expected to add momentum towards the development of smart cities and advanced agrivoltaics in greenhouse installations.
At present (in 2023), these ClearVue window designs are the only type of visually-clear and deployment-ready construction materials capable of providing significant energy savings in buildings, simultaneously with a significant amount of renewable energy generation. The objective of this study is to place the recent industrialised development of ClearVue® PV window systems into a broader context of prior studies in the field of luminescent concentrators, as well as to provide some details on the measured performance characteristics of several ClearVue window design types deployed within the building envelope of a research greenhouse, and to elucidate the corresponding differences in their energy harvesting behaviour. An evaluation of the practical applications potential of these recently developed transparent agrivoltaic construction materials is provided, focussing on the measured renewable energy generation figures and the seasonal trends observed during a long-term study. This article reports on the measured performance characteristics of research greenhouse-based agrivoltaic installation constructed at Murdoch University (Perth, Australia) in early 2021.The solar greenhouse at Murdoch University has demonstrated great potential for commercial food production with significant energy savings due to on-site energy production from its building envelope.
1 Introduction
At present, widespread energy innovations in terms of optimizing both the on-site distributed energy generation and the energy use intensity are urgently required in the built environment and in agricultural production facilities. This is due to the vast amounts of energy being consumed in buildings (more than 40% of the total nationwide energy consumption occurring in the US buildings sector already in 2018 [1]), and the necessity to de-carbonize the built environments, preferably offsetting carbon emissions and materials-embedded carbon through the use of advanced materials capable of carbon offsetting in their installed “use phase”. New advanced construction materials combining the benefits of ongoing energy savings (e.g. in HVAC and also lighting) and on-site production of renewable energy using solar resources are urgently required.
Ideally, these novel materials and products must be able to be integrated into the structure of either new or existing buildings, and be able to provide substantial energy benefits through occupying substantially large sun-exposed building envelope areas. Energy-generating energy-efficient solar façade materials can provide a substantial momentum for decarbonization of the buildings sector, because of the much greater deployment-ready surface areas (typically by a factor of >10, relatively to any conventional roof-mounted PV) which are available for solar-harvesting façade technologies. Effective, long-term decarbonisation of built environments is only possible if an optimized combination of all available solar generation technologies utilizing all possible building-envelope areas is deployed, providing near-net-zero operation capability while being integral to the building structure.
The development of high-transparency solar PV window products with climate-tailored thermal properties is expected to provide a useful pathway towards effective and widespread decarbonization in both the urban and agricultural (agrivoltaic) settings.
The building-integrated PV (BIPV) sector is growing fast, almost worldwide, deploying a broadening range of new technologies and products (detailed reviews are available, e.g. [2−9]), the majority of installed PV capacity growth still takes place in conventional installations (solar farms and rooftops). A new segment of PV industry enabling improved energy efficiency in agricultural production has recently emerged, known as agrivoltaics, where the optimised arrangements of partially-transparent PV and BIPV modules are required to balance the requirements of achieving energy savings simultaneously with maintaining crop growth productivity and land-use efficiency [10−12]. Efficient production of commercial crops in greenhouses requires maximum possible delivery of the photosynthetically active radiation (PAR, the wavelength range between 400–700 nm) to plant leaves, placing substantial constraints on the design of agrivoltaic installations, where the PV modules must be either highly-transparent, or occupy only a limited fraction of wall or roof areas.
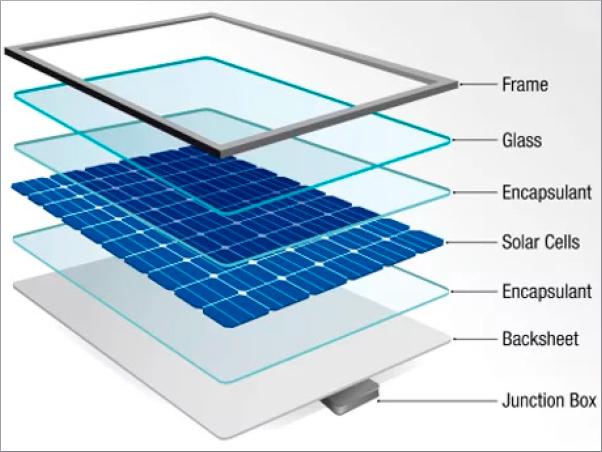
On the other hand, in commercial buildings, dependent on local climate, semitransparent BIPV window modules require multi-parameter optimisations, enabling the correct balance between the energy generation per unit area and energy savings. Therefore, engineering of the highly-customised and climate-dependent combinations of the thermal (insulation U-value), optical (visible transmittance and solar heat gain), and electric (Wp/m2) properties are required to ensure wide acceptance of emergent BIPV technologies. Compared with conventional rooftop PV and most (even semitransparent) BIPV modules, where the semiconductor energy-converting components are typically only protected from the environment by ∼3 mm thick coverglass, the window-integrated systems are expected to have longer useful lifetimes (of >30 years), due to the placement of semiconductor modules inside window compartments such as argon-filled spaces, and protected by thicker layers of glass from factors such as rapid temperature variations or strong UV exposure.
At the same time, the relevant recycling procedures applicable to solar windows will be similar to these used with conventional PV and BIPV, since their main component materials (glass and semiconductors) are identical, or similar. A range of novel BIPV and high-transparency window-integrated PV (WIPV) products has been developed by ClearVue Technologies (Perth, Australia) [4,13], already tested and proven to be suitable for deployment in both the construction sector and greenhouses.
ClearVue solar WIPV systems feature the following set of innovative features:
- Custom-designed energy-saving glazing systems utilizing special types of glass and low-emissivity coating(s) to provide substantial thermal energy savings in a range of deployment climates (adjustable SHGC, U-value, and visible light transmittance).
- Glazing-integrated luminescent solar concentrator (LSC) panel harvesting primarily the UV-blue and also the near-infrared solar radiation components while providing maximized visible light transparency and reducing the energy harvesting losses dependent on the incidence angles of solar radiation and weather conditions. LSC technologies have been reviewed in [14], and the details of their characteristic features, performance metrics, typical implementation designs, and recently-demonstrated benchmark results have been reported in [15−19], among multiple other literature sources dating back to the 1970 s.
- 3D-structured, custom-shaped, custom-interconnected energy harvesting PV surfaces placed around glazing perimeter regions [20], maximizing the visual transparency and further reducing the efficiency losses that would normally occur in conventional BIPV with increasing incidence angle of the incoming sunlight.
- Customized, installation-specific electrical interconnections circuitry involving combiner boxes and microinverters, enabling optimisation of the energy production from a large-scale building structure containing multiple solar windows.
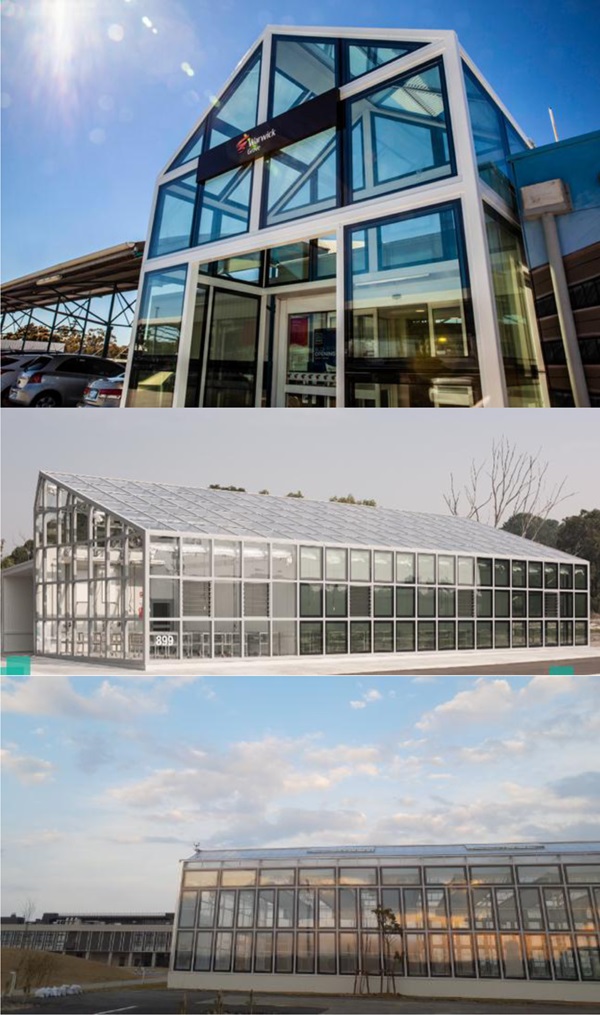
Several recent showcase implementations of ClearVue high-transparency solar window technologies in built environments, including both the research-oriented and commercial agrivoltaic facilities are shown in Figure 1; some of the performance-related datasets obtained from these installations have been reported in [4,21,22].
The following sections of this article provide some background details on the development of clear energy-generating glazing technology, focussing on the recent results and energy harvesting-related measurement data obtained from Murdoch University agrivoltaic facility.
2 Background on the technology features and development of transparent window-integrated PV
In order to find innovative ways of designing semi-transparent solar windows of high power conversion efficiency (PCE) and improved PV Yield characteristics, not only novel functional materials but also modifications in the structure of PV-integrated glazing systems are required. Several novel and recently-developed approaches to the solar windows design utilising the latest results from the well-established field of luminescent solar concentrators (LSC), in combination with recent developments in the materials science of thin films, luminescent materials, and photonics were reported in [17,18,21−27].
2.1 Principal characteristics and features of luminescent concentrator-type PV
The task of designing highly transparent LSC-type devices of relatively high PCE for BIPV and window applications involves considering fundamental trade-offs and theory limits described by Yang et al. [28]. It is possible to design LSC-type solar window systems featuring enhanced probability of the incident photons collection by the solar PV elements, simultaneously with enhanced quantum yield of PV conversion. LSC-type solar window designs typically rely on using custom-shaped, custom-connected PV energy conversion modules placed around the window perimeter and glass edge areas, with a fraction of the sunlight incident onto clear glass area being redirected towards PV surfaces. This redirection of incident light can occur either through the internal light diffusion mechanisms (e.g., diffraction or scattering), or it can be engineered through luminescent downconversion (or even upconversion), where the majority of light rays re-emitted by the embedded luminescent particles at different wavelengths can be partially trapped within glass due to total internal reflection.
Installing additional front-facing narrow PV modules near the system perimeter to face direct full-spectrum sunlight would effectively reduce the geometric gain factor, but meaningfully increases the overall light capture efficiency [21,22,29]. Utilising the luminescent downshifting (LDS) functionality by selecting the appropriate luminophore materials for use in transparent LSC can further increase the system PCE due to improving the spectral response matching between the solar cells and the wavelength-converted luminescent emissions [19,29−31]. In all solar window systems using PV modules installed under relatively thick layers of glass, whether facing the sunlight directly, or placed adjacent to glass edge surfaces at different location-specific angles to the incoming sunlight, there are significant efficiency losses observed due to the glass itself shading the solar cells, as well as due to the geometric design-related internal shading distributions existing invariably across parts of PV module areas.
There is also a substantial angular sensitivity of the PV module's electric response to the intensity distribution of the incoming sunlight, especially when multiple (and relatively complex-structured) PV modules are electrically interconnected together to generate the combined solar window output. Regardless of the chosen interconnections circuitry details, different PV modules installed into a window (or even parts of the same multiply-connected PV subsystem at different sides of perimeter) can be mismatched electrically in either voltage or current, due to receiving non-identical light spectra or intensity distributions. These electric mismatches existing between parts of the combined PV module circuit of a solar window can strongly affect the shape of output I–V curve characteristics, and can invoke the protective bypass diode circuits operation, ultimately limiting the module Fill Factor, and the window PCE. Therefore, considering all of the optical, materials-related, and electrical factors strongly affecting the system operation, a multidisciplinary design approach is needed to engineer practical LSC-type solar window devices capable of providing stable energy output and large energy yields in realistic deployment conditions.
It is important to note that the main performance characteristics of any LSC-type device are governed by equation (1), where G is geometric gain (the ratio between the light collecting front area of device to the area of near-edge, or edge-mounted cells), P is photon collection probability (the ratio of the number of photons escaping through glazing system edges to the number of photons incident onto front surface of concentrator). This quantity is often also called “optical efficiency”, however, some terminology-related disagreements still exist in the LSC-related body of literature, related to the definition of optical efficiency, with newer publications focussing on the external and internal photon collection efficiency. Copt is optical power concentration factor; detailed definitions for these parameters are available from [16,19].
![]()
In equation (1), the geometric gain is adjustable by the window system designer, and is largely governed by the window dimensions and the design of PV modules placed near window perimeter/edge areas to collect light. Typical values of G for ∼1m2 windows are between ∼5−10, dependent on whether solar PV strips are also placed around backside perimeter near glass edges. The photon collection probability, on the other hand, is a function of core technology used within the LSC-type glazing system, especially the luminescent and/or scattering materials and components used, e.g. glass panes chemistry, heat-mirror-type optical coating(s), any diffractive elements, and the overall optical arrangement of these components.
In most (or practically all) high-transparency large-area solar windows and LSC devices of different design types reported to date, the optical concentration factor Copt quantifying the radiation flux density reaching the near-edge solar cells is less than unity (data tables containing relevant literature-reported figures of LSC performance parameters have been reported in e.g. [3,17]; the optical efficiencies demonstrated in most LSC devices to date were also modest (typically well below 10%, [19]). This is due to the fact that allowing a substantial fraction of total incoming visible-range sunlight energy through the window strongly reduces the energy available for the wavelength conversion and internal redirection. Luminescent materials can only convert a fraction of the available incident spectrum, with a finite quantum yield (QY); only quantum dot materials can currently compete with organic-dye pigments reaching QY > (∼80%); most of inorganic phosphor materials embedded into polymer matrices have QY limited to max. ∼40%, with very few of these featuring near-infrared excitation and/or emissions.
The refraction, multiple reflection, diffraction, and scattering-related light transport phenomena can also assist in improving the probability of photon collection by the energy-converting solar cell surfaces installed inside solar windows [24−26,32].
2.2 Recent development history of high-transparency WIPV
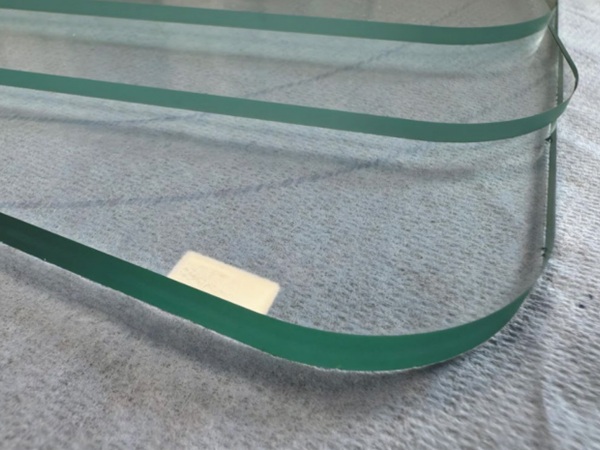
Large-area (200 mm × 200 mm, 500 mm × 500 mm, and larger) high-transparency solar windows employing glass-based glazing systems, customised low-emissivity coatings, and inorganic luminescent materials have been designed and demonstrated at Edith Cowan University (ECU, Perth, Australia) between 2012 and 2019. Oxide and sulphide-based rare-earth-doped phosphor particles excitable by the UV-blue and also the near-infrared solar radiation components, and featuring both the luminescent downshifting and upconversion-type emissions, were incorporated into epoxy-based lamination interlayers. Figure 2 provides an illustration of the lab testing methods used to optimize the luminophore compositions and concentrations in early (2012−2013) experiments with 100 mm × 100 mm high-transparency glazing samples with four strip-shaped parallel-connected CuInSe2 PV modules attached to glass edges. Measurement results (Voc and Isc measured with a collimated beam from a solar simulator incident normally onto glass surfaces) obtained from these (3 shown) different glass samples are also illustrated, together with a UV-curable epoxy sample, into which the luminophore particles were dispersed ultrasonically, prior to forming interlayers. The visual appearances of interlayers and glass also varied notably between the 3 samples shown, due to differing fluorescence intensities and light scattering strengths.
Significant differences in the electric output parameters were observed in experiments with a large number of 100 mm × 100 mm solar window samples, related to the differences in their interlayer compositions and structure (concentration-thickness products related to distributing different types and amounts of fluorescent particles in epoxy layers of varied thicknesses). These early experiments, which also included the PV characterization of differently constructed samples in natural outdoor sunlight, have enabled the simultaneous optimization of the electric output parameters and visual transparency levels in small-area solar window devices.
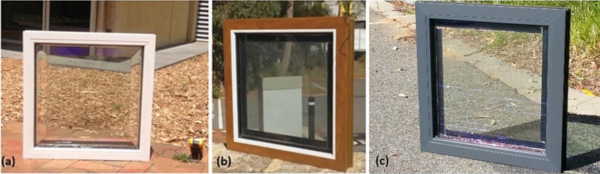
The early-development solar glazing samples packaged as framed installation-ready solar window prototypes dating back to 2014 are shown in Figure 3.
The prototypes shown in Figure 3 employed CIS (CuInSe2) custom-shaped PV modules of nominal efficiency near 13%, and the PV strips were directly attached to glazing system edges and also (in some systems) were positioned around the backside glazing perimeter regions. The electric power outputs from smaller (200 mm × 200 mm) high-transparency low-haze samples using edge-attached 26 mm-wide PV strips reached up to ∼0.7 W (Isc = 72 mA, Voc = 16.8 V, FF = 0.57, measured at peak orientation in outdoor sunlight). In 500 mm × 500 mm internally-structured window samples similar to Figure 3a, the electric outputs reached about 3W; windows of same dimensions featuring backside-perimeter CIS PV demonstrated electric outputs of over 5W in natural sunlight conditions, dependent on the internal glazing structure design. The performance characteristics of first factory-made ClearVue solar window designs also featuring CIS PV back in 2016−2017 in outdoor test installations have been reported in [21].
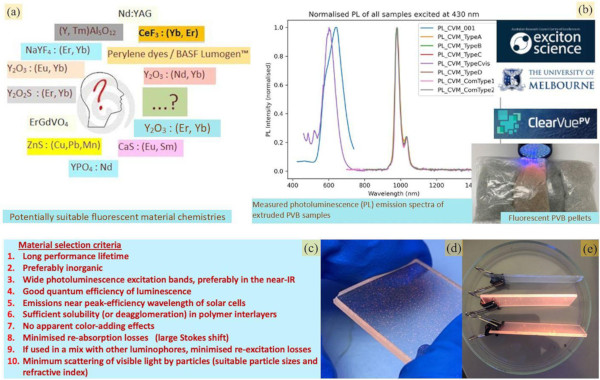
The luminescent material selection criteria, some types of functional material compositions potentially suitable for enabling improved energy harvesting performance in windows, sample measured spectra of luminophores featuring giant Stokes shift, and visual examples of transparent luminescent concentrator prototypes employing inorganic phosphor particles dispersed inside glass lamination interlayers are shown in Figure 4.
Work is ongoing at multiple research groups worldwide on the design of LSC using giant Stokes shift inorganic phosphors capable of avoiding the well-known reabsorption problem, which is another limiting factor in large-area LSC design. Another factor of special relevance to the industrial production of solar windows is the necessity to develop suitable and reliable technologies for the incorporation of inorganic phosphors (or semiconductor nanocrystals) into the glass-based industry-standard window designs, without causing strong haze, colouration, and preferably avoiding the use of polymer slabs and any organics-based media not proven to provide decades-long lifetimes of solar exposure.
To the best of our knowledge, no other research group have so far demonstrated the industrialised development of high-power (tens of W/m2), clear, and size-scalable solar windows and published (e.g. Ref. [13]) flash-lamp PV I−V curve testing results for large-area (>1 m2) high-transparency glass-based clear and building standards-compliant solar windows (e.g. certified by IEC, UL, CE). In particular, the measured performance data for product-level windows demonstrating Ampere-scale currents at the maximum-power point, with large corresponding system voltages (VMPP near ∼50 V) and transparency levels exceeding 50% have not been so far published by any competitors. Our most recent development results in large-area (1.91 m × 0.95 m) solar windows (exported to Japan and installed at a commercial greenhouse in Sendai, built by Tomita Technologies demonstrated electric power outputs (measured at STC) of up to 50.5 Wp (27.83 Wp/m2), proving both the scalability of technology and product development progress.
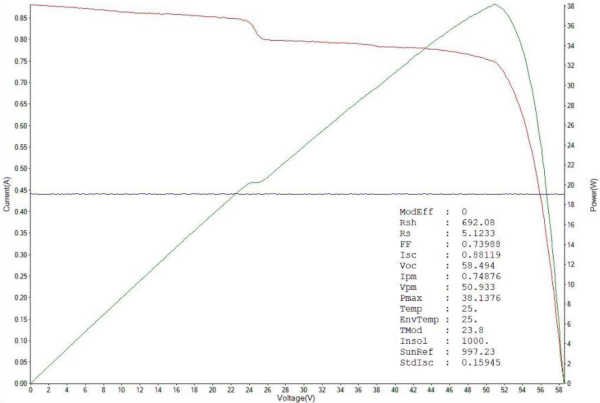
Compared with the commercially available Clearvue solar windows of size 1.2 m × 1.2 m made 1−2 years ago, the current (2021-2022) window models of the dimensions 1.1 m ×1.2 m have shown the Isc improvements of up to 16.7% (∼880−980 mA vs ∼800−840 mA previously, at the same Voc and FF), as recently measured at standard test conditions and also in field testing experiments. Clearvue windows generate their maximum power output at the optimised incidence-angle conditions, with the best incidence geometry being different from normal incidence. The latter feature (not reported in any conventional PV modules) makes Clearvue solar windows particularly attractive for BIPV applications on vertical façade and wall areas. Current generations of ClearVue solar window designs rely on using custom-assembled, custom-interconnected mono-Si solar cell modules. Figure 5 shows the I−V curve and power-voltage curve measurement results obtained from 1.1 m × 1.2 m ClearVue solar windows of single-interlayer low-haze design type corresponding to the windows installed in Grow-Room #4 at Murdoch University Greenhouse.
Optimisation of solar window performance in terms of ensuring high transparency, largely colour-free and haze-free appearance, while maximising the electric output per unit module area is an active area of multidisciplinary research. Key new advances in this area are expected to result from the ongoing optimisations of inorganic luminescent material compositions and concentration-thickness products, glazing system structure and its components, and the improvements of customised PV modules and associated electrical circuitry details.
![Fig. 2 Lab testing of 100mm × 100mm solar window prototypes (2012−2014) containing various interlayer compositions with different concentrations and chemistries of luminophore particles dispersed into UV-curable epoxy layers of ∼1mm thickness. The glass sample images are organized into three horizontal rows, each row containing the same solar window sample, but showing the measurements of either the open-circuit voltage (left), or the short-circuit current (right). Typical appearance of transparent fluorescent epoxy in its liquid state is also illustrated in the bottom row, together with the measurement results obtained from the three above-shown window samples irradiated by an identical solar simulator beam. Substantial variations in the measured electrical parameters correlated with the differences in the interlayer composition (more details available from Ref. [18]).](/sites/default/files/inline-images/Fig2_335.jpg)
3 High-transparency window-integrated agrivoltaic installation at Murdoch University, Western Australia
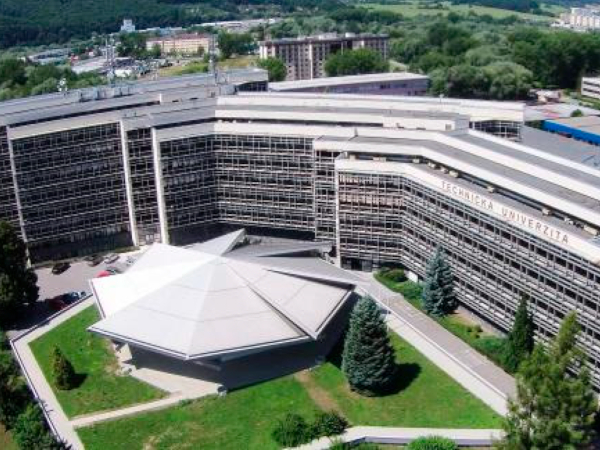
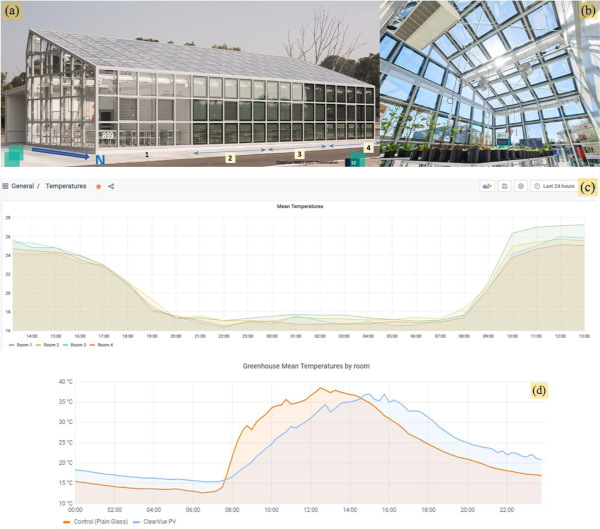
A recent (2021) installation example of Clearvue solar windows is Murdoch University Solar Greenhouse (Fig. 6), in which 3 out of 4 grow-rooms (∼50 m2 floor area each) were built using solar windows on the north wall, on the 20-degree tilted north-facing roof, and also on the west-facing wall. The greenhouse is located in Perth metropolitan area, at a southern latitude of 32° 04′24″. 153 solar windows in total represented an installed capacity of near 6.1 kWp, which has led to strongly offsetting the running costs of greenhouse during 2021 in terms of HVAC system operation. Measurement data obtained from this greenhouse provided multiple insights into the potential benefits of using Clearvue solar windows in controlled-environment crops production, as well as the energy generation performance trends of different solar window design variations.
3.1 Greenhouse design features and measured performance characteristics
The greenhouse was designed to enable performance comparisons between four different grow-rooms, in terms of the energy consumption, energy production, microclimate stability, and crop growth productivity. Grow room #1 was glazed with standard low-iron ultraclear glass (2 4 mm-thick panes laminated using standard 0.76 mm PVB interlayer). Grow rooms 2, 3, and 4 were glazed with Clearvue solar windows, which featured identical triple-glazed window designs, but the 3 window types had slight differences in the PVB interlayer compositions and sequences used within their middle panes (made of three 4 mm-thick low-iron glass plates linked by two interlayers). Figure 6 shows the greenhouse design sketch and some climate control-related data collected prior to, and after the commissioning of automatic internet-of-things enabled climate control system.
The microclimate in each grow-room was finely controlled using a custom-designed HVAC system, keeping the temperature setpoints within ±2 °C to optimise the plant growth. Even with this fine control of microclimate applied continually over the seasons, the PV installation has offset approximately ∼40% of the total energy costs in Clearvue grow-rooms. Immediately following the greenhouse construction and fit-out, and prior to installing the control algorithms running the HVAC systems, a thermal insulation performance comparison test was made, by way of recording the mean air temperatures in each room and its daily variations (Fig. 6d). The results showed that Clearvue-glazed grow-rooms remained several degrees warmer during the night, compared to the control room #1glazed with plain glass; and during the daytime the air temperature rose at a much slower rate in all solar grow-rooms, due to the differences in the solar heat gain and thermal insulation U-values. The grow-rooms 1 and 4 initially had additional sunlight and thermal exposure aspects on the east and west walls of greenhouse, compared to the internal rooms 2 and 3; these exposure differences were minimised prior to running the characterisation and plant-growth experiments by installing thick Styrofoam screens on the inside of the eastern and western glass walls. The photovoltaic performance of the 21 solar windows installed onto west-facing wall of greenhouse was monitored separately and was not a part of the present study.
The PV installation contained 13 Enphase IQ7+ microinverters, each of which was connected to a parallel bundle of 12 windows (except one was connected to 9 windows); the system has been configured for exporting energy to the grid, with the measured self-consumed energy fraction typically being near 70%. The amounts of solar energy harvested by the solar windows installation at Murdoch University Solar Greenhouse (Building 899) were data-logged continuously, enabled by Enphase Enlighten online data interface processing the data from each of the 13 Enphase microinverters connected to parallel-bundled solar window arrays. Continuous observations of the logged power and energy data were made throughout 2021–2022, and the observed energy generation trends were also analysed in comparison with a reference conventional (roof-based, optimally tilted) 6.6 kWp rooftop PV installation located in Perth metropolitan area.
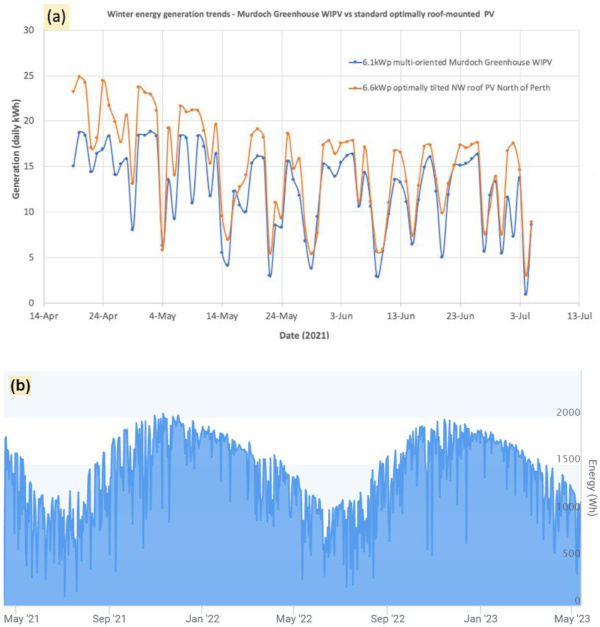
This reference roof-top PV installation is facing the north-western direction and is tilted at 22.5° to the horizontal plane. These orientation and tilt angles are the parameters required for achieving the optimised year-round PV energy production in Perth, considering the local latitude and the applicable local industry-standard roof pitch angles. Figure 7 shows the comparative energy generation trends observed during autumn and winter seasons of 2021. A long-term daily energy generation datalog recorded from an array of 12 windows mounted on the roof of grow-room #3 is also shown, revealing the absence of any significant performance degradation and a relative stability of daily energy outputs throughout seasons.
In can be noted from the data of Figure 7b presenting the long-term performance of a roof-mounted 12-window array, that throughout all seasons, the minimum rainy-day daily energy outputs were typically not below ∼30% of a peak-day production for each corresponding week of year. Compared with the summer-time daily energy production data also available from the same reference rooftop PV system, the seasonal variations in the daily energy outputs were smaller on greenhouse roof. On sunny days, the greenhouse roof (Array G, roof of room #3) production from solar windows varied from approximately ∼1.1 kWh/day in winter, to ∼ 2 kWh/day in summer. The season-dependent daily energy production variations of the reference 6.6 kWp conventional monocrystalline silicon-based rooftop PV system were larger, from approximately ∼17 kWh/day on peak days in winter, to ∼40 kWh/day on peak days in summer.
The energy harvesting performance of various types of solar PV installations in the “real-world” operating conditions (as opposed to the standard laboratory flash-test testing conditions (STC)) remains an area of active research [33,34]. Each PV system responds to its own uniquely local operating environment and its limitations, especially the external shading conditions, and the local climate type and its variations. It is well known that in the case of BIPV, where the installations often invariably involve multiple and non-optimum tilt angles (e.g. vertical walls) and azimuth orientations, significant (and season-dependent) discrepancies may be expected between the modeled energy outputs and actual measured system performance.
Our main findings over the autumn-winter of 2021 were that Murdoch University Solar Greenhouse performed as expected, despite having a large area of vertically oriented windows (e.g. at North and West Walls), and on some rainier days even outperformed a standard 6.6 kWp PV panels installation on an optimally tilted roof area (considering the installed PV capacity difference; data shown in Fig. 7). Both the North and West wall areas performed as expected (or better, particularly on some wall areas in the summer months of 2021-2022), considering the non-optimum orientation/tilt angles, as well as the weather conditions during the winter of 2021. The energy amounts harvested daily approached ∼19 kWh/day. Some energy harvesting limitations were also observed, arising due to the maximum AC power output limitations of microinverters used, and affecting primarily the roof-mounted arrays on summer days. The data of Figure 7 confirms that Clearvue solar windows are particularly suitable for efficient solar energy harvesting in adverse environmental conditions (e.g. during rainy winter days), even when installed at a range of different azimuth and tilt angles. This finding was expected, due to the window design features providing the capability of capturing the incoming sunlight energy from a wide range of incidence angles.
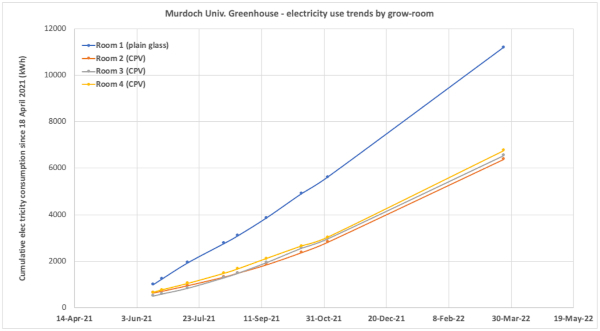
Significant energy savings were demonstrated in greenhouse grow-rooms fitted with Clearvue solar windows, which demonstrated approximately 40% of total (season-averaged) energy self-sufficiency, due to the renewable energy generated. Figure 8 shows the measured electric energy consumption trends in all 4 grow-rooms, on a time scale of almost 1 year. Further optimisations to be applied to the internet-of-things (IoT) based HVAC control algorithms, involving more efficient air cooling applied through high-pressure evaporation of water mist, are expected to further improve the energy self-sufficiency, reducing the running time of high-power reverse-cycle air conditioners.
As was expected, conventionally glazed Room1 used electricity at a significantly higher rate, compared to solar grow-rooms, due to its significantly larger (by almost 30%) solar heat gain coefficient. Marginal (few %) energy use differences were noted between grow-rooms fitted with solar windows, possibly also correlated with their (slight) solar heat gain differences. The 3-monthly averaged energy self-sufficiency level (for all 3 CPV rooms) was equal to: PV generation total/total energy used = 1165 kWh/3082.42 kWh = 37.8% − averaged between 16 April to 21 July 2021, with the record rainy June and July months in 2021. On the other hand, during the same 3-month period, the ratio of total energy generated in Rooms 2, 3, and 4 to the metered grid-imported energy was as high as 49.7%. The costs of importing from grid (only ∼ 2.3 MWh in 3 months' time) were ∼$AUD 300/month, using off-peak Perth tariff of $0.3896/kWh) indicate small running costs, compared to e.g. the expected running costs of energy in other R&D greenhouses at Murdoch Campus.
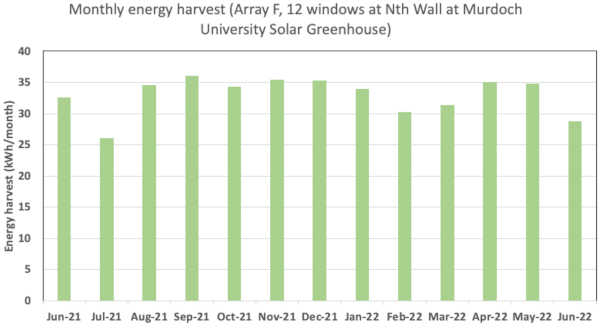
Figure 9 shows the remarkable stability of the monthly energy output from a 12-window array mounted vertically on the north-facing wall of greenhouse (Array F, with 7 windows on wall of room #3 and 5 windows on wall of room #4).
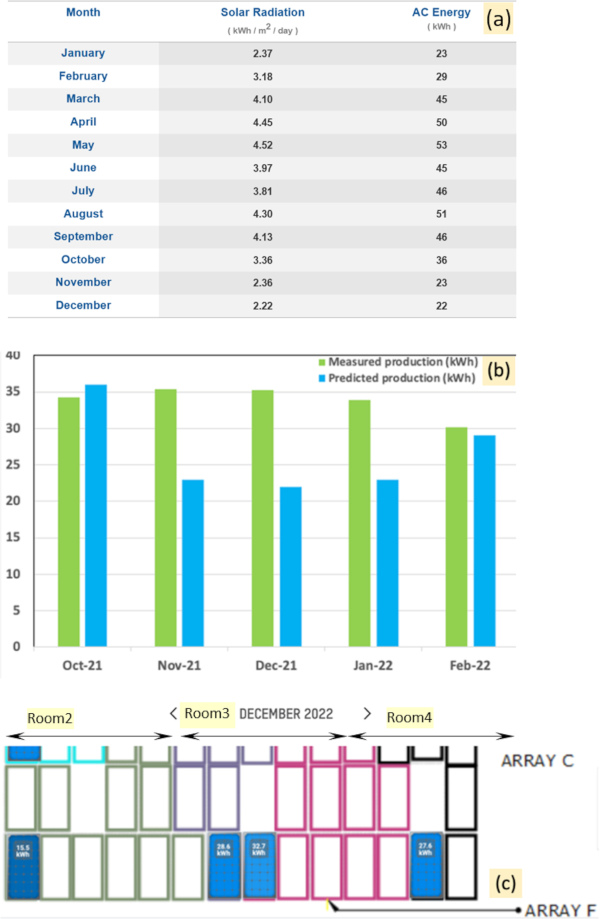
Despite significant Sun altitude angle variations occurring throughout seasons, no reductions in monthly energy output were recorded during the summer months; whereas a conventional PV panel-based vertical wall-mounted installation would be expected to reduce the energy production noticeably during summer, due to geometric factors. Figure 10 shows the results of the summer-time PV Yield comparison made with a conventional PV (or BIPV) system installation of identical installed capacity placed onto a north-facing vertical wall in Perth. The energy production data for December 2021 from Enphase Envoy interface showed a 53.4% energy production increase, compared to that expected from a conventional PV installation of same capacity.
Similar PV Yield comparison results for the wall-based windows were also observed in other months (e.g. November 2021 and January 2022, and also December 2022, when the weather was at its most stable for Perth). The PV Yields exceeding these available from conventional BIPV systems were expected, due to the design of Clearvue windows featuring the reduced angle-of-incidence sensitivity of electric power output, simultaneously with peak-output window orientation being slightly away (by 15–20°) from normal incidence. This makes these solar windows attractive for the (intrinsically multi-oriented) BIPV installations.
3.2 Energy harvesting performance differences measured in PV windows of different interlayer design types
The designs of solar windows installed in 3 Clearvue grow-rooms slightly differed in terms of the number of luminescent material-doped polyvynilbutyral (PVB) lamination interlayers used and the concentrations of these materials distributed inside the polymer interlayers. Two differently-doped PVB designs were used, namely (1) “PVB-1” of lower doping concentration for higher-clarity windows, and (2) “PVB-2” of slightly higher luminescent particle concentration. No substantial haze-related visual clarity or appearance differences were noted between windows of different design modification. This was due to the rather modest concentrations of functional materials incorporated into both types of 0.76 mm thick PVB, being below ∼0.1 wt.%. The following interlayer design differences related to the glazing design differences between grow-rooms 2, 3, and 4:
- Room 2 windows used two slightly higher-haze, but identical interlayers (“PVB-2” + “PVB-2”).
- Room 3 windows used two differently-doped interlayers (“PVB-2” + “PVB-1”).
- Room 4 windows used a single fluorescent interlayer (high-clarity “PVB-1”), with the other interlayer being “Ordinary PVB”.
Two PVB interlayers were needed to laminate the inner pane (integrated LSC-type panel) of each triple-glazed window system; each inner pane was itself composed of three 4 mm-thick low-iron glass plates. During the initial (pre-installation) field testing of all windows conducted at Murdoch Campus in February 2021 in outdoor natural-sunlight conditions, some performance differences between different window design types were noted, even though testing at standard test conditions (STC) could not be then performed, and the factory flash-lamp STC tests revealed only marginal (few %) peak power-output differences when measured at normal incidence angle. When measured at the optimised (by way of measuring the short-circuit current Isc) angles of incidence, and at peak outdoor sunlight irradiation, the windows (expectedly) showed the same open-circuit voltages near 61 V, however, the measured Isc values differed systematically from ∼840-860 mA in windows of Room 4, up to ∼950–980 mA in windows designed for installation in Rooms 2 and 3. Therefore, the solar energy harvesting performance was expected to also differ by up to ∼10% between the extremely-low-haze Room 4 and other Clearvue rooms.
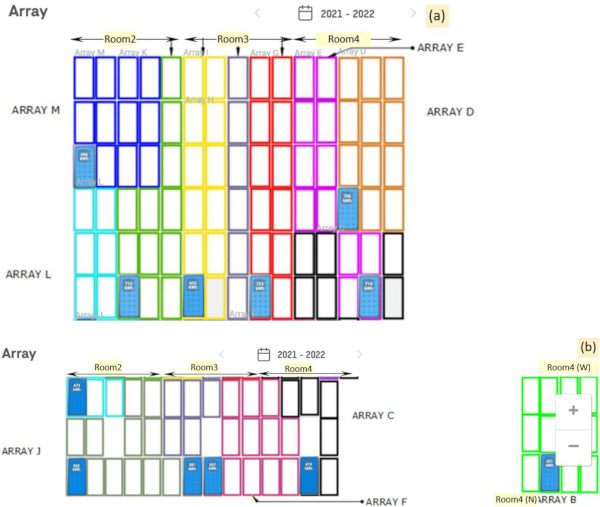
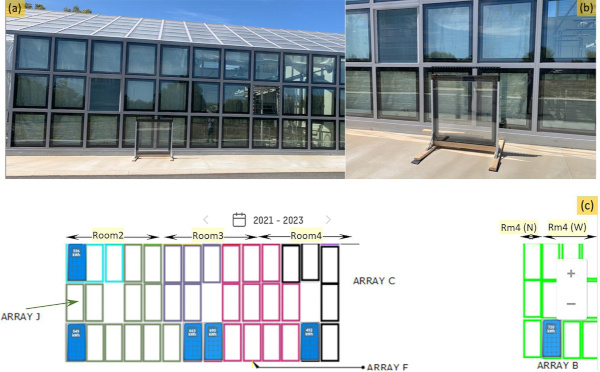
The Enphase Enlighten online data interface allowed to map the PV energy production of all individual PV arrays (bundles of parallel-connected solar windows distributed over the greenhouse building envelope). Thus, the total energy production at different sections of greenhouse could be monitored online. Due to the electrical system design-related and geometric constraints of this agrivoltaic installation, it was not possible to install all separate 12-window PV arrays mounted on identically-oriented surfaces and using identical window design types. Instead, we ensured (to the extent possible, since some windows also required replacement during the construction process) that windows installed in each grow-room featured the same glazing design variation. However, most 12-window arrays featured a combination of wall- and roof-mounted windows, often extending over 2 different rooms per array. The power generation on roof areas would have been more strongly affected by factors such as weather-induced soiling and (during warmer seasons) the microinverters AC output limits, compared to the wall-mounted windows. Figure 10 shows the electric design schematic of the distribution of different north-facing PV arrays placed over the window and roof areas in all 3 solar grow-rooms, with roof and wall areas shown in separate diagrams. Array B had 3 windows placed onto north wall and another 9 on the west wall; Array A (not shown) was also placed on west wall. The web interface allowed energy production and power generation data collection summarised over user-defined time-frames.
The vertical wall areas are better representative of BIPV-deployed system energy yield performance, due to the expected reductions in energy amounts harvested, compared to roof areas, and also due to relatively smaller area contamination induced by weather. The wall-mounted PV windows were also expected to be less affected by the temperature-induced efficiency variations, due to their placement closer to ground level (in contact with cooler layers of greenhouse air), and receiving less direct incoming solar radiation flux per unit area. Long-term north-facing wall windows performance averages were observed between the different rooms of greenhouse between 16 April 2021 and 21 October 2022 (cumulative energy production data for this period are shown in Fig. 11).
Array J windows data were representative (11/12 windows) of Room2 (Nth Wall) energy harvesting performance during the long-term observation period (18 months), amounting to 41.83 kWh/window.
Array F (split between Rooms 3 and 4 on the north wall, with 7 windows being of Room3 glazing design, and Array C (split between the Nth Wall and roof of Room4) provide the reliable estimate for the long-term comparative data trends for different window design types. Given that the long-term average rooftop generation per window on roof of Room4 was 59.167 kWh/window (data from roof-based Arrays D and E), the total contribution of 6 wall-mounted windows of Array C (Room 4) can be derived to be (621–6 × 59.167) kWh = 265.99 kWh, or 44.33 kWh/window.
The 12 windows of Array J (Room 2) generated only ∼41.83 kWh/window (∼5.6% less than wall windows of Room 4), however, there were vehicles occasionally parked (during peak insolation hours) outside and near the wall of Rooms 1 and 2; strong external shading effects could have been expected, possibly affecting the generation data of Room2 northern wall.
The 12 windows of Array F (mainly belonging to Room3 glazing design type, with some (max. 2) windows on the Room 4 part of Array J also being replaced during construction with the windows of Room3 interlayer design type) generated 49.75 kWh/window during the observation period. These data suggest the minimum long-term energy-harvesting outperformance of Room3 Nth-wall windows, compared with Room4, to be ∼12%. This figure also correlates well with the original field performance evaluation tests performed in February 2021, prior to the installation of solar windows into greenhouse structure. Array F windows have also consistently demonstrated significant PV Yield performance differences during warmer months (compared with the predicted energy yields calculated using a conventional-PV-based model, based on installed capacity, physical orientation, and local climate). Array J windows performed substantially weaker than Array F during summer months, but also performed similarly to Array F during winters; the exact reason for these discrepancies is yet unknown. It is possible that denser interlayers of Array J featured strong light scattering losses at larger angles of sunlight incidence.
In order to more fully elucidate the interlayer composition-dependent energy-harvesting performance differences between different window design types, a “Test Window” was manufactured, which replicated the dimensions, PV circuitry, and internal glazing design structure of Murdoch greenhouse solar windows, except did not use any fluorescent materials added into its single PVB interlayer composition. Even though the interlayer composition and structure-related performance differences have been studied quite extensively using smaller lab-scale window samples, in a range of light incidence conditions, in both the natural sunlight and under solar simulator irradiation [24,25,35], it has been of interest to compare the daily energy outputs of greenhouse windows with an identical large-size reference solar window which did not employ any internal light redirection mechanisms in its design.
This Test Window was placed vertically in front of Room 2 between 19 December 2022 and early January 2023, to enable daily energy harvesting comparisons with 3 other window designs installed at north wall of greenhouse. Figure 12 shows the test window placement geometry relatively to greenhouse wall; the nearby wall-based PV arrays design schematic is also shown.
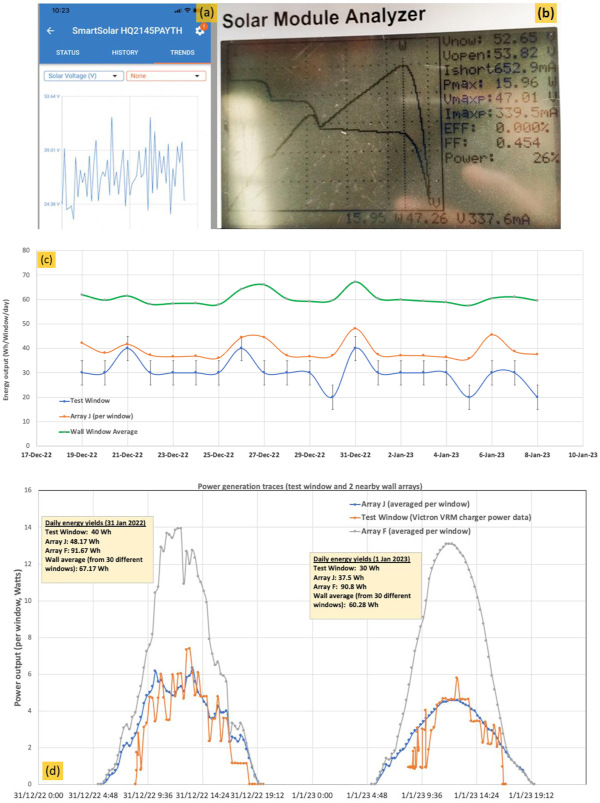
The Test Window electric output at peak irradiation conditions (near midday on December 16, 2022), and at the optimum incidence angle was initially checked, with the expected parameters measured (Voc near 58 V, max. Isc of near 800 mA). After mounting the Test Window vertically onto testing frame in front of Room 2 windows, the output leads from this solar window were connected to the PV input of Victron SmartSolar MPPT charge controller. A semi-discharged 12 V, 10 Ah lead-acid battery was used as energy sink and to enable the energy flow measurements from the charger circuit (always kept in Bulk Charging mode), as well as to power the charge controller. The instantaneous PV power readings from Victron 75/10 were checked against the direct I–V curve measurement data obtained from PROVA 200A Solar Module Analyzer, validating the power measurement data consistency. A Victron Cerbo-S GX data logger was configured to transmit the instantaneous PV input, MPPT charger circuit, battery state, and energy yield parameters online, to enable remote monitoring. Daily comparisons of the per-window harvested energy as well as the intra-day trends in power generation were made (for a 3-week period) with the windows from the nearby greenhouse wall arrays (Fig. 13).
A notable finding made using the real-time solar voltage output display of Victron charge controller was the identification of MPPT voltage jumps occurring on a fast time scale (each several seconds), between ∼25 V and ∼40 V, showing the instabilities in the maximum power point voltage of Test Window (Fig. 12a), resolved by the ultra-fast MPPT tracker circuit of Victron 75/10. PV Analyzer I–V curve measurements were slower (∼5 s per scan), yet also showed the characteristic bending of the I–V curve shape, indicating unstable PV circuit operation typical of partially shaded electrically-mismatched complex-interconnected PV modules, and showing the presence of a side-peak in the power-voltage curve. Significant geometric shading was expected to affect a number of strip-shaped PV modules placed facing several different directions around the inner perimeter areas inside the Test Window, at least for a number of daylight hours, at light incidence angles well away from the normal incidence.
This is because no internal light redistribution (or light diffusion) mechanisms were built-in, which could have otherwise made the light intensity distribution over the internal solar cell areas much more uniform, minimising the electric output mismatches between parts of the overall PV module circuit, and thus avoiding protective bypass diode circuitry activation, or the development of a lower-power peak voltage condition. The energy collection from any clear glass areas adjacent to solar cells has also been disabled in the Test Window design, which did not feature any light scattering or luminescence-assisted photon transport mechanisms, which are known to strongly improve the collection of obliquely-incident solar energy.
The Test Window has demonstrated a consistently much lower daily energy output, compared to the per-window energy yield data averaged between a total of 30 north wall windows (Fig 13c); it has also produced smaller daily energy yields than the nearby Array J windows, which were generating the smallest energy output among all wall window designs in summer. The midday peak power generation from the Test Window was very similar to windows of Array J, but much smaller than windows of Array F.
4 Conclusions
We have provided a review of the recent results in the field of high-transparency window-integrated PV and agrivoltaics, focussing on the datasets acquired during the performance monitoring of a solar window greenhouse constructed at Murdoch University. Solar glazing system development approaches and functional material systems used in window-based energy harvesting technologies have been described, with a brief review of their recent development history. An example agrivoltaic facility at Murdoch University Solar Greenhouse (Perth, Western Australia) and the observed trends in its energy generation and energy use performance have been described in detail.
The main findings related to the performance of Murdoch University Solar Greenhouse were as follows:
- accurate temperature control was demonstrated, maintaining microclimate at ±2°C from the required setpoints, during both the daytime and night-time periods.
- the summer-season HVAC/greenhouse climate monitoring results have confirmed that the HVAC and IoT climate-control systems designed specifically for Murdoch Greenhouse by the Clearvue team were capable of providing the required fine climate control during the hot summer months in Perth. During the winter months, relatively small amounts of energy were used to provide the effective heating.
- electric energy production by multi-oriented window-integrated PV (WIPV) solar windows installation demonstrated to be in line with the expected performance;
- different window design types resulted in different energy harvesting performance characteristics (as was expected); the results of energy production monitoring will be utilised for further fine-tuning of the PVB interlayer recipes.
- high levels of energy self-sufficiency (averaging up to ∼40%, and up to ∼60% demonstrated in window-integrated solar greenhouse on sunny autumn days in Perth), provided the most energy-efficient climate control algorithms were used.
The wide applications potential of this novel type of energy-generating transparent construction materials includes commercial buildings, public infrastructure, and agrivoltaics. We demonstrated that significant energy savings are possible in commercial greenhouses using high-transparency WIPV.
References
- L. Capuano, International Energy Outlook 2018 (IEO2018), USS Energy Information Administration, Washington, DC, USA, 2018 [Google Scholar]
- E. Biyik, M. Araz, A. Hepbasli, M. Shahrestani, R. Yao, L. Shao, E. Essah, A.C. Oliveira, T. del Cano, E. Rico et al., A key review of building integrated photovoltaic (BIPV) systems, Eng. Sci. Technol. Int. J. 20, 833–858 (2017) [Google Scholar]
- M. Vasiliev, M., Nur-E-Alam, K. Alameh, Recent developments in solar energy-harvesting technologies for building integration and distributed energy generation, Energies 12, 1080 (2019) [CrossRef] [Google Scholar]
- D. Moor, V. Rosenberg, M. Vasiliev, High transparency clear glass windows with large PV energy outputs, in: Proceedings of Challenging Glass Conference, Vol. 8, 2022 [CrossRef] [Google Scholar]
- T.E. Kuhn, C. Erban, M. Heinrich, J. Eisenlohr, F. Ennslen, D.H. Neuhaus, Review of technological design options for building integrated photovoltaics (BIPV), Energy Build. 231, 110381 (2021) [CrossRef] [Google Scholar]
- N. Martín-Chivelet, K., Kapsis, H.R. Wilson, V. Delisle, R. Yang, L. Olivieri et al., Building-integrated photovoltaic (BIPV) products and systems: a review of energy-related behavior, Energy Build. 262, 111998 (2022) [CrossRef] [Google Scholar]
- A. Taşer, B.K. Koyunbaba, T. Kazanasmaz, Thermal, daylight, and energy potential of building-integrated photovoltaic (BIPV) systems: a comprehensive review of effects and developments, Solar Energy 251, 171–196 (2023) [CrossRef] [Google Scholar]
- Z.R.K. Abojela, M.K. MatDesa, A.H. Sabry, Current prospects of building-integrated solar PV systems and the application of bifacial PVs, Front. Energy Res. 11, 1164494 (2023) [CrossRef] [Google Scholar]
- Y. Li, L. Li, W. Deng, D. Zhu, L. Hong, Building integrated photovoltaic (BIPV) development knowledge map: a review of visual analysis using CiteSpace, Buildings 13, 389 (2023) [CrossRef] [Google Scholar]
- C. Toledo, A. Scognamiglio, Agrivoltaic systems design and assessment: a critical review, and a descriptive model towards a sustainable landscape vision (three-dimensional agrivoltaic patterns), Sustainability 13, 6871 (2021) [CrossRef] [Google Scholar]
- M.A. AlMamun, P. Dargusch, D. Wadley, N.A. Zulkarnain, A.A. Aziz, A review of research on agrivoltaic systems, Renew. Sustain. Energy Rev. 161, 112351 (2022) [CrossRef] [Google Scholar]
- A.V. Klokov, E.Y. Loktionov, Y.V. Loktionov, V.A. Panchenko, E.S. Sharaborova, A mini-review of current activities and future trends in agrivoltaics, Energies 16, 3009 (2023) [CrossRef] [Google Scholar]
- Clearvue Technologies website https://www.clearvuepv.com/frequently-asked-questions/ (accessed on 12 October 2022) [Google Scholar]
- M.G. Debije, P.P.C. Verbunt, Thirty years of luminescent solar concentrator research: solar energy for the built environment, Adv. Energy Mater. 2, 12–35 (2012) [CrossRef] [Google Scholar]
- M.G. Debije, V.A. Rajkumar, Direct versus indirect illumination of a prototype luminescent solar concentrator, Solar Energy 122, 334−340 (2015) [CrossRef] [Google Scholar]
- L. Desmet, A.J.M. Ras, D.K.G. de Boer, M.G. Debije, Monocrystalline silicon photovoltaic luminescent solar concentrator with 4.2% power conversion efficiency, Opt. Lett. 37, 3087–3089 (2012) [CrossRef] [Google Scholar]
- A. Reinders, R. Kishore, L. Slooff, W. Eggink, Luminescent solar concentrator photovoltaic designs, Jpn. J. Appl. Phys. 57, 08RD10 (2018) [CrossRef] [Google Scholar]
- B. Zhang, G. Lyu, E.A. Kelly, R.C. Evans, Förster resonance energy transfer in luminescent solar concentrators, Adv. Sci. 9, 2201160 (2022) [CrossRef] [Google Scholar]
- T. Warner, K.P. Ghiggino, G. Rosengarten, A critical analysis of luminescent solar concentrator terminology and efficiency results, Solar Energy 246, 119−140 (2022) [CrossRef] [Google Scholar]
- Device for generating electric energy, US Patent US 1116 2302B2, https://patents.google.com/patent/US11162302B2/en [Google Scholar]
- M. Vasiliev, K. Alameh, M. Nur-E-Alam, Spectrally-selective energy-harvesting solar windows for public infrastructure applications, Appl. Sci. 8, 849 (2018) [CrossRef] [Google Scholar]
- M. Vasiliev, M. Nur-E-Alam, K. Alameh, Initial field testing results from building-integrated solar energy harvesting windows installation in Perth, Australia, Appl. Sci. 9, 4002 (2019) [CrossRef] [Google Scholar]
- H. Li, K. Wu, J. Lim, H.-J. Song, V.I. Klimov, Doctor-blade deposition of quantum dots onto standard window glass for low-loss large-area luminescent solar concentrators. Nat. Energy 16157 (2016). [Google Scholar]
- M. Vasiliev, R. Alghamedi, M. Nur-E-Alam, K. Alameh, Photonic microstructures for energy-generatingclear glass and net-zero energy buildings, Sci. Rep. 6, 31831 (2016) [CrossRef] [Google Scholar]
- R. Alghamedi, M. Vasiliev, M. Nur-E-Alam, K. Alameh, Spectrally-selective all-inorganic scattering luminophores for solar energy-harvesting clear glass windows, Sci. Rep. 4, 6632 (2014) [CrossRef] [Google Scholar]
- A.M. Ramachandran, M.S. Sangeetha, A.S. Thampi, M. Singh, A. Asok, A comprehensive review on optics and optical materials for planar waveguide-based compact concentrated solar photovoltaics, Results Eng. 16, 100665 (2022) [CrossRef] [Google Scholar]
- Y. You, X. Tong, A.I. Channa, H. Zhi, M. Cai, H. Zhao, L. Xia, G. Liu, H. Zhao, Z. Wang, High-efficiency luminescent solar concentrators based on Composition-tunable Eco-friendly Core/shell quantum dots, Chem. Eng. J. 452, 139490 (2023) [Google Scholar]
- C. Yang, R.R. Lunt, Limits of visibly transparent luminescent solar concentrators, Adv. Opt. Mater. 5, 1600851 (2017) [CrossRef] [Google Scholar]
- S. Ren, C., Shou, S. Jin, G. Chen, S. Han, Z. Chen, X. Chen, S. Yang, Y. Guo, C.-C. Tu, Silicon quantum dot luminescent solar concentrators and downshifters with antireflection coatings for enhancing perovskite solar cell performance, ACS Photonics 8, 2392–2399 (2021) [CrossRef] [Google Scholar]
- M. Aghaei, R. Pelosi, W.W.H. Wong, T. Schmidt, M.G. Debije, A.H.M.E. Reinders, Measured power conversion efficiencies of bifacial luminescent solar concentrator photovoltaic devices of the mosaic series, Progr. Photovoltaics Res. Appl. 30, 726–739 (2022) [CrossRef] [Google Scholar]
- R.A.S. Ferreira, S.F.H. Correia, A. Monguzzi, X. Liu, F. Meinardi, Spectral converters for photovoltaics—what's ahead, Mater. Today 33, 105–121 (2020) [CrossRef] [Google Scholar]
- F. Zhang, J. Bao, C. Gao, Design and optimization of transparent scattering solar concentrator based on SiO2 aerogel, JUSTC 52, 2 (2022) [Google Scholar]
- E. Ela, V. Diakov, E. Ibanez, M. Heaney, Impacts of variability and uncertainty in solar photovoltaic generation at multiple timescales, Technical Report NREL/TP- 5500 -58274, NREL, Golden, Colorado, USA, 2013 [Google Scholar]
- M.A. Imteaz, A. Ahsan, Solar panels: real efficiencies, potential productions and payback periods for major Australian cities, Sust. Energy Technol. Assessm. 25, 119–125 (2018) [Google Scholar]
- M. Vasiliev, K. Alameh, M.A. Badshah, S.-M. Kim, M. Nur-E-Alam, Semi-transparent energy-harvesting solar concentrator windows employing infrared transmission-enhanced glass and large-area microstructured diffractive elements, Photonics 5, 25 (2018) [CrossRef] [Google Scholar]