Authors: Lena Efferz, Christian Schuler & Geralt Siebert
Source: Glass Structures & Engineering (2023)
DOI: https://doi.org/10.1007/s40940-023-00245-w
Abstract
For tempered glass, edge distances for drilled holes in point-fixed glazing must be observed. For production reasons, the European product standard EN 12150 for thermally toughened safety glass requires a minimum edge distance of two times the thickness t. When transferring loads from the glass pane, it is necessary to consider whether and to what extent residual stresses of the tempering process are present in the remaining area between the edge and the hole. The German design standard DIN 18008-3 specifies a blanket distance to the edge of 80 mm for cylindrical holes, which is frequently undercut in construction practice. In this case, the strength of the tempered glass used may not be applied for structural analysis, and only the strength of annealed glass may be assumed instead.
Because of this discrepancy, this study experimentally investigated the strength behavior of toughened glass with cylindrical near-edge holes via photoelasticity and destroying four-point bending test. The pre-stress zones of a glass pane are qualitatively compared using the monochrome wavelength photoelasticity method, and the surface compressive stress is measured at points near the hole. Then, the fracture stress of the drilled specimen is determined by four-point bending tests and the necessary numerical simulation using the finite element method of the bending test. The various test methods are intended to provide information on the distribution of the residual stresses and thus on the strength of the toughened glass when the edge distance is lower than the distance required in DIN 18008-3—and by this update the rules.
1 Introduction
In point-fixed glazing, loads can be transferred via local clamping or holes drilled through the glass in horizontal and vertical architectural glazing. In tempered glass, distances between the holes and the edge must be observed. The European product standards for thermally toughened safety glass (EN 12150 (2020)) and heat-strengthened glass (EN 1863 (2012)) specify a distance of twice the glass thickness (2t) as the minimum distance that is technically possible in the tempering process for specimens with a hole. However, these standards do not state the strength behaviour and the static design of the specimens with holes near the edge.
After drilling, the glass is tempered according to the desired tempering type, thermally toughened safety glass or heat-strengthened glass, depending on the installation situation, to overpressure minor surface defects caused by drilling that could lead to glass breakage. During the tempering, the glass, heated to over 100 °C above the transition temperature of glass, is rapidly cooled using air jets. For each geometry and coating, the air jets must be controlled differently. The tempering process introduces residual stresses into the glass, which increases the strength and load capacity of the glass.
However, in the case of near-edge holes, it is a concern that the residual stresses may not be fully formed and, therefore, may not reach the strength of the thermally toughened glass for structural analysis. For this reason, the German design standards DIN 18008-1 (2020) and DIN 18008-3 (2013) specify a blanket value as a minimum distance to the glass edge of 80 mm for cylindrical holes, regardless of the thickness. This required distance is often undercut in the construction practice. In case of a smaller edge distance, the point-fixing systems currently require general national approval or individual approvals due to the deviation from the standard. Additionally, thicker glass structures are necessary since structural engineers are not allowed to apply the strength of the used tempered glass in the structural analysis in Germany, but according to DIN 18008-1, they may only calculate with the strength of annealed glass. The question of whether the strength of the tempered glass also exists with a hole edge distance of less than 80 mm currently required is of great relevance for the glass and facade industry.
To clarify the discrepancy between the two standards and the situation in construction practice, the present paper investigates experimentally, with numerical evaluation, the strength behaviour of small format, thermally toughened safety glass in different thicknesses with cylindrical holes with small distances to the edge. The behaviour of the distances between two holes and the distance from holes near a corner still needs to be investigated.
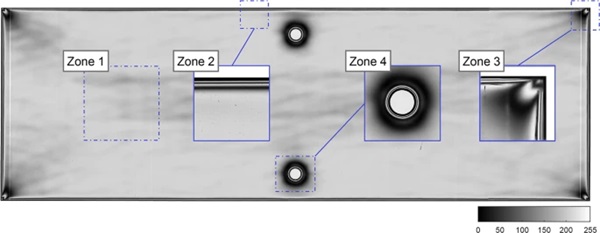
Due to the different cooling behaviour resulting from geometric conditions, four pre-stress zones can be distinguished in a glass pane, according to Laufs (2000) and Dix et al. (2022). Due to residual stresses of the tempering, glass becomes stress birefringent, thus acquiring optical direction-dependent properties, and is suitable for photoelastic measurement methods. The four pre-stress zones in glass show up excellently in the isochromatic image, as exemplified by a specimen in Fig. 1. In zone 1 of the surface, the heat transfer only occurs via the surfaces. A parabolic stress profile is formed across the thickness with compressive stresses at the surface (σ1 ≈ σ2) and tensile stresses inside. As a result of unavoidable inhomogeneities in the cooling process, a diffuse isochromatic image with small retardations is formed. Due to the three-dimensional cooling behaviour at the edge (zone 2), the heat transfer is directed over the edge. Edge membrane compressive stresses σ2 parallel to the glass edge (σ1 = 0) are optically detectable by the edge isochromatics. At the corner (zone 3), two edges encounter each other, forming a stress bulb (σ1 = σ2 = 0). Around the hole (zone 4), edge isochromatics and a more significant influence area are formed depending on the hole diameter and glass thickness (Dix et al. 2021).
Nielsen et al. (2010) simulated the tempering process for a 19 mm glass with holes to evaluate the relationship between surface compressive stresses in the field and at holes. Due to the complex tempering process, it is difficult to scale the stress at the hole based on the geometry, so a direct transfer or comparison to the present investigations is infeasible.
Previously, Dix et al. (2021) investigated near-edge holes in glass of 4 mm and 10 mm thickness, each with two different diameters in thermally toughened safety glass and heat-strengthened glass. However, the strength tests carried out had a limited scope of test specimens and were not related to reference specimens without holes, as is the case here. The study in this paper is, therefore, intended as a continuation.
The study used the applied residual stresses to non-destructively examine the specimens with near-edge holes by photoelasticity. On the one hand, this was carried out qualitatively over the entire surface using the monochrome wavelength photoelasticity method to qualitatively assess the formation of the pre-stress zones, i.e., the zone of influence around the hole and the isochromatics at the edge, in isochromatic images. On the other hand, the surface compressive stress was determined locally at specific measuring points using the scattered light method to obtain information on the homogeneity of the pre-stress zones.
Subsequently, the bending strength of the specimen was determined using the destructive four-point bending method typical for glass constructions based on EN 1288-3. Due to the deviation of the test standard because of the holes in the cross-section, numerical modelling with finite elements of the bending test is necessary to determine the fracture stress of the specimens.
By examining whether and to which extent residual stresses of the tempering process exist in the remaining area between the edge and the hole, the focus of this study is to evaluate how the edge distances in the different glass thicknesses influence the strength behaviour and what differences occur between toughened glass of different manufacturers. It will investigate how the influences can be visible with the chosen investigation methods. The investigations should help to reduce the current distance of 80 mm of DIN 18008-3.
2 Test specimens
The tests were carried out on specimens of thermally toughened safety glass of standard size 360 mm × 1100 mm in three thicknesses (5 mm, 8 mm, 12 mm) with the outer edges polished. The specimens had a cylindrical hole near the edge in the centre of the two long sides. One hole diameter was examined per glass thickness. The minimum distance per glass thickness was 2t, regulated in EN 12150-1 as the minimum technical possible edge distance. As seen in the specimen matrix in Fig. 2, the paper investigated eight hole geometries designated as drilled specimens. The holes were drilled from both sides with a hollow drill. All edges, including the drilled ones, were chamfered at an angle of 45° between 0.5 and 1.5 mm, depending on the glass thickness. The inner cylinder surface of the hole remained matte and rough.
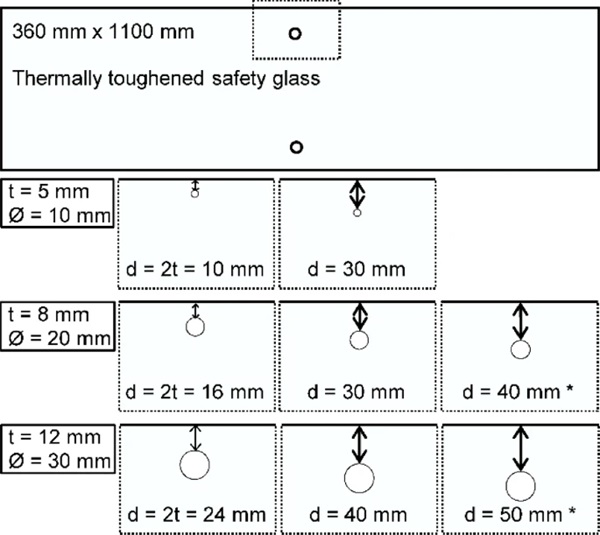
Two manufacturers (A and B) produced six of the eight test series to twelve specimens each. Only one manufacturer produced two test series marked with * in Fig. 2. To compare samples without cross-sectional weakening, glass panes without holes were produced in each thickness and used as reference specimens.
3 Photoelastic methods
Photoelastic measurements are suitable for materials with stress birefringence properties, as for glass after tempering. Stress birefringence results from a direction-dependent optical behaviour of the material, which splits polarised light into two directions with different propagation velocities according to the prevailing principal stress differences in the material due to a stress condition. The different propagation velocities cause retardations after exiting the material, depending on the material thickness, the stress-optic coefficient, the wavelength of the used light, and principal stress differences at the particular point in the material. In special stress optical setups, retardations can be qualitatively and quantitatively recorded as interference patterns by extinction and superposition of the polarised light waves. Fundamentals of photoelasticity can be looked up in Frocht (1948), Kuske and Robertson (1974), Nisida and Kawata (1986), and Ramesh (2000).
3.1 Multiple monochromatic wavelength photoelasticity
All twelve cleaned specimens per test series were scanned with the Softsolution Linescanner for this study. This instrument is mainly used for inline measuring and controlling optical anisotropy effects in tempered facade glasses, which quantifies the retardations from the principal stress difference using the multiple monochromatic wavelengths photoelasticity method (Hidalgo and Elstner 2018; Dix et al. 2022).
In this paper, however, we do not investigate the quantitative retardations but rather the monochromatic isochromatic image outputted by the telecentric light technique of the scanner as an intensity image from 0 to 255 for the two wavelengths blue (λ = 455 nm) and green (λ = 505 nm) with a high resolution of 200 dpi (Hidalgo and Elstner 2018).
Since the instrument is based on the principle of a monochromatic polariscope in a bright field, the interferences are displayed in the dark. Due to the monochromatic light source, the superposition of the higher orders of the wavelengths is not shown in colour but is visualised by alternating light and dark isochromatics. In this way, multiple monochromatic wavelength photoelasticity can be used to detect the pre-stress zones in tempered glass, as already shown in Fig. 1.
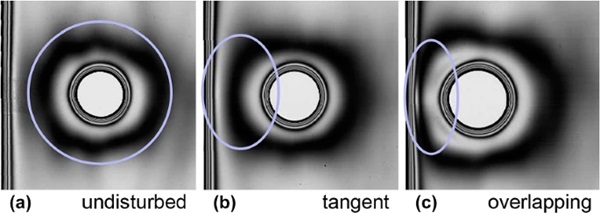
For these investigations, the high-resolution isochromatic image is cropped to the hole, and the pre-stress zones of the edge and hole are qualitatively evaluated. From these images, no conclusion is drawn about the strength, but only the stress-optical behaviour of the introduced residual stresses is observed qualitatively. It is suspected that the strength of the tempered glass may be limited if the different pre-stress zones cannot form properly. This can be qualitatively observed from the isochromatic images, as shown in Fig. 3, due to overlapping, tangling, or dodging of the edge isochromatics. If the pre-stress zone around the hole can form undisturbed, it can be expected that the strength of the tempered glass can also be fully established. In this case, it is assumed that the residual stresses of the pre-stress zones do not influence each other, and thus, the edge distance of the holes is sufficient and has no influence on the strength.
3.2 Methods with scattered light method
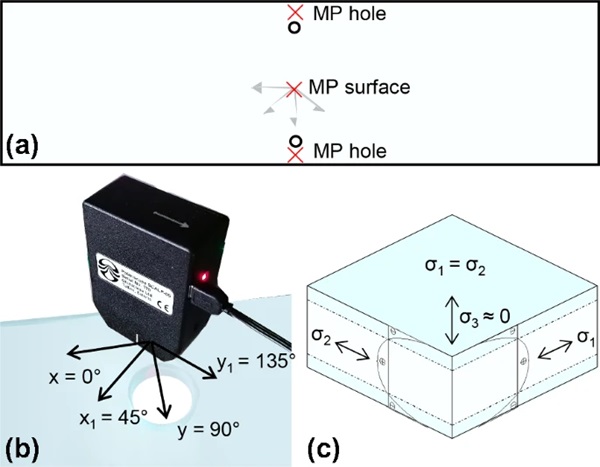
The stress distribution of the introduced residual stresses of the tempering in the pre-stress zone 1 of the surface, which is parabolic over the glass thickness (Fig. 4c), can be determined punctually using the scattered light method. In this method, the camera of the scattered light polariscope detects the alteration of the intensity of the reflected laser light. Due to the derivative relation of optical retardation to stress, the surface compressive stresses σ1 and σ2 of the glass at the respective measurement point can be calculated from the individual measurements of the four different 45° measurement directions (see Fig. 4b) using the equations from the manual of GlasStress Ltd. (2013). Fundamentals of the scattered light method and its evaluation can be found in Aben and Guillemet (1993), Dix et al. (2022), and Nielsen et al. (2021).
Thus, this study measured the surface compressive stresses σ1 and σ2 on two cleaned specimens per series using the SCALP-05 instrument from GlasStress Ltd. with the stress-optic coefficient of C = 2.70 TPa−1 (GlasStress Ltd. 2013).
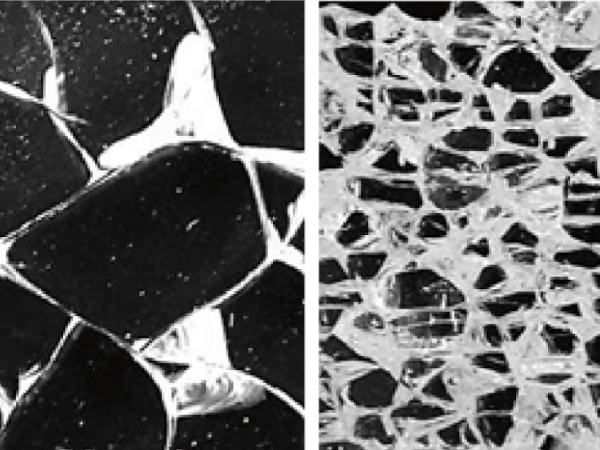
For the pre-stress zone 1 of the surface, it is valid that the two principal stresses σ1 and σ2 are approximately equal for homogeneous stress distribution due to tempering. The surface compressive stress for thermally toughened safety glass must reach at least 69 MPa according to ASTM C1279 (2009). However, Mognato et al. (2018) recommend, based on their investigations, a minimum surface compressive stress of 90–95 MPa for thermally toughened safety glass, depending on the coating and glass type, so that the associated fine fracture pattern, which is essential for the safety aspect of this tempering type, can be achieved.
If the principal stresses σ1 and σ2 have a significant difference, it can be assumed that the measuring point is either not in pre-stress zone 1 or the stress distribution due to tempering is not homogeneous, and thus, the strength is insufficient. Therefore, the measuring points (see Fig. 4a) were each chosen to be centred between the edge of the hole and the edge of the glass to assess the level and quality of the residual stress distribution in the area of the hole zone (see Fig. 4b). For comparison, the surface compressive stresses were also measured in the centre of the glass.
4 Bending strength tests
The bending strength was determined in destructive tests on five specimens per test series. The linear-elastic material glass fails abruptly and is brittle under tensile stress due to the expansion of surface cracks and has no plastic redistribution behaviour (Siebert and Maniatis 2013). These properties demand special awareness of the principal stresses in the hole region, in particular for point-fixed glazing. Since the hole represents a cross-sectional weakening of the glass, it is assumed that the weak point of the notch leads to fracture under bending stress. For glass with a hole, the bending stress increases in the area of the hole. A stress peak occurs at this notch, which cannot be calculated analytically but must be mapped by experiment or numerically as an approximate solution. Numerical simulation of the bending test of glass using finite element method (for lime soda silicate glass: elastic modulus = 70,000 MPa, Poisson’s ratio = 0.23 (DIN 18008-1)) for the hole regions in this study was performed for both the preparation (for adjusting the test speed) and the follow-up of the experimental tests (for evaluating the fracture stress at the notch).
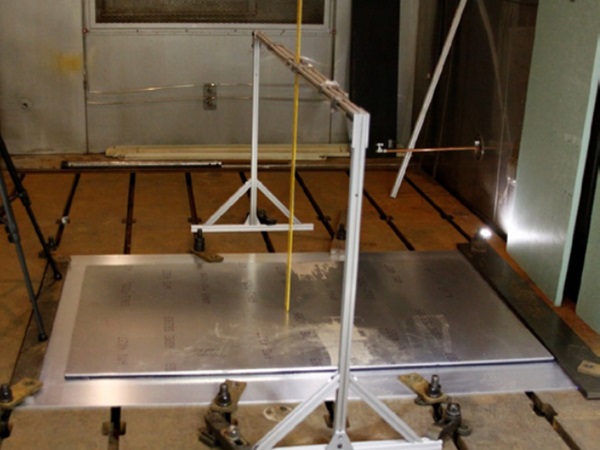
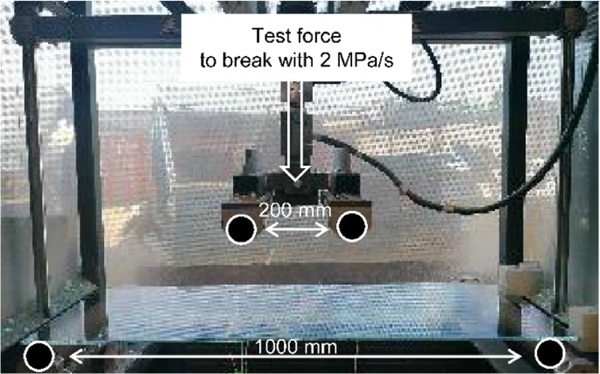
A four-point bending test can determine the bending strength of glass according to EN 1288-3. In this test, the specimen with dimensions 1100 mm × 360 mm, supported on two rotatable rollers spaced 1000 mm apart, is loaded to failure with two bending rollers spaced 200 mm apart by the universal testing machine ZPM-E of ift Messtec, see Fig. 5. During the test, EN 1288-3 specifies an increase in stress of 2 MPa/s which can be determined analytically for glass without holes depending on the glass thickness since the bending stress is approximately the same across the width of the pane. Before the actual fracture tests could be performed in this study, the test speed for specimens with holes had to be adjusted using numerical simulation.
To determine the bending strength, the test standard EN 1288-3 (2000) provides an equation for the fracture stress, but this only applies to glass without cross-sectional weakening. Therefore, the bending test is modelled with the actual breaking forces to evaluate the test results.
4.1 Verification of the FE mesh in the drilling area
In the numerical simulation, verification of the mesh quality in the borehole region is essential when evaluating the stresses at the notch, as it strongly depends on the choice of elements and the size of the mesh. Different approaches to verify FE modelling for point-fixed glazing and comparisons to stress concentration around the hole have already been investigated by Siebert (2004), Seel (2016), and Lama (2021).
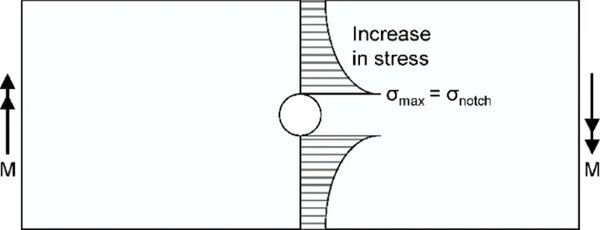
In DIN 18008-3, Annex B recommends a method to verify the FE mesh in the hole region using a reference solution based on the comparison with the mathematical solution hole in a member of the rectangular cross-section with out-of-plane bending given by Roark R. J. and Young W. C. (1976). This mathematical function describes a plate with a central hole under boundary moments (see Fig. 6), which allows the stress at the hole to be determined analytically using a stress concentration factor, depending on the geometry. However, these equations have been valid for the material steel, so the results differ due to the different Poisson´s ratio of steel (0.3) and glass (0.23), as shown by Seel (2016). According to DIN 18008-3, the FE mesh is to be selected so that the notch stress at the hole in the FE model corresponds with a tolerance of 5% to the mathematical solution.
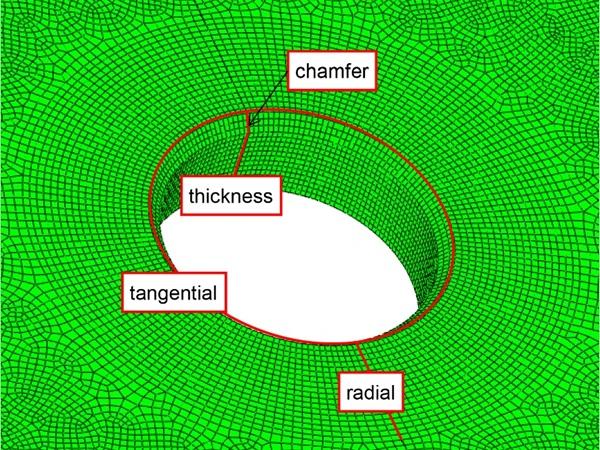
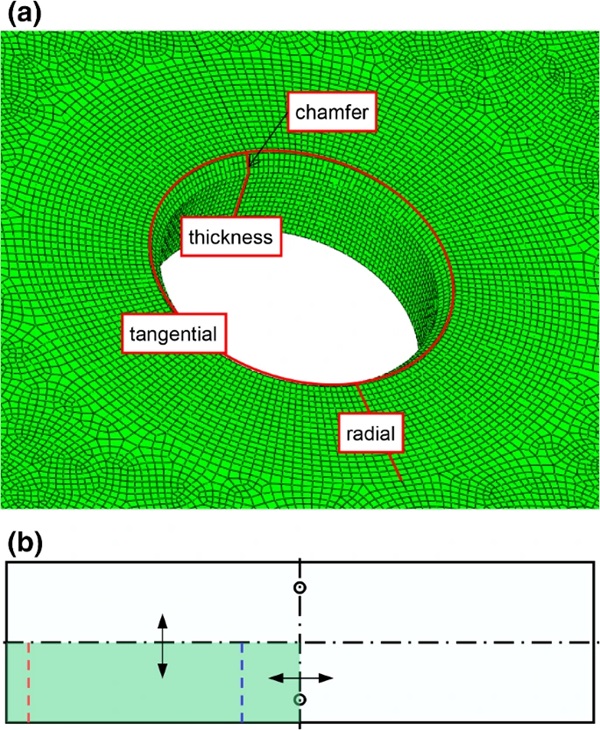
For the study, the solid model was modelled as a quarter using symmetry, with a simple line bearing in a vertical direction instead of the bearing rolls in the FE program Abaqus/CAE. The load was applied via a line load representing the bending rolls in the actual test. In a convergence study, the different element sizes for the FE mesh of the solid model were investigated using a submodel. For mesh refinement, a larger circle is placed around the hole. To avoid distortion of the elements, care was taken to maintain a constant ratio of dimensions tangentially and radially to the hole and across the thickness of the glass, as recommended in Siebert (2004). A mesh with 128 elements tangentially around the hole, confirmed by the 5% tolerance range from the DIN 18008-3 reference solution, was used to evaluate the fracture stresses, as shown in Fig. 7.
To reduce the stress peak at the notch, the edge of the hole must be chamfered between 0.5 and 1.0 mm depending on the glass thickness at the angle of 45° according to DIN 18008-3. Since this study investigates the behaviour of glass with a hole on the resistance side, the chamfer was considered when designing the FE models for the test series. This means a solid model with chamfer was necessary to evaluate the fracture stresses for the respective test series.
For the solid model, the three-dimensional solid element C3D8R was used as a hexahedron with eight nodal points and a linear shape function, providing sufficient results for the simulation of the bore area, according to Seel (2016). The elements were calculated using the reduced integration technique, which, on the one hand, can make the simulation less accurate due to the reduced integration points but, on the other hand, can prevent so-called shear locking. Shear locking occurs mainly in pure bending conditions with linear shape functions when the solid elements cannot sufficiently determine deformations in the thickness direction. The consequence of the inability to deform is an undesired stiffness due to parasitic shear stresses (Koschnick 2004), which can be circumvented with the reduced integration technique.
For architectural glass, large deflections occur compared to the glass thickness, especially for thin glass and high stresses. Therefore, the FE modelling should normally consider geometric nonlinearities due to the large deformations. However, in this study, geometric linearity was calculated due to the frictionless and uniaxial load transfer of the four-point bending test.
4.2 Adjusting the test speed
To prepare for the destructive tests, the increase in stress of 2 MPa/s had to be adapted to the respective test series of the drilled specimen. To define the test speed for the samples with holes in the first step, a model with S4R shell elements with a linear shape function and reduced integration as a structured quad shape with a mesh size of 0.5 mm was created in Abaqus/CAE.
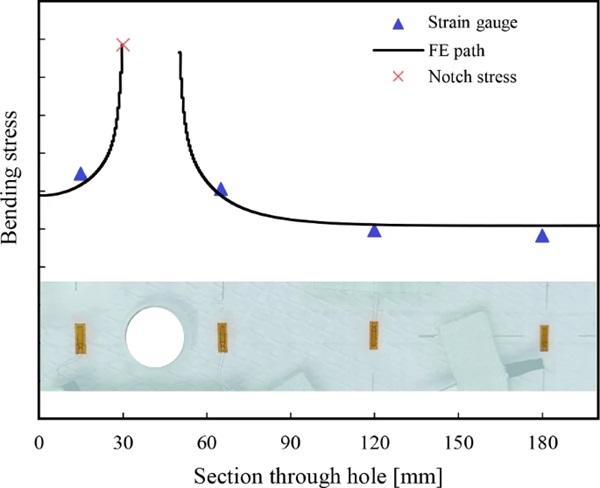
This shell model was exemplary verified by a convergence study and then experimentally by strain gauge measurements for an 8 mm glass pane with holes with an edge distance of 30 mm and a diameter of 20 mm. Four strain gauges were applied to the tensile side of the glass in different positions, and the stress was recorded when the pane was loaded. The increasing stress of the strain gauges agrees well with the plot of the bending stress of the FE model at the same load, see Fig. 8. Between numerical solution and strain gauge values, deviations of approx. ± 5% occurred.
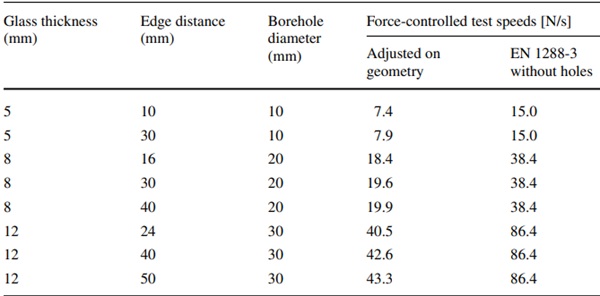
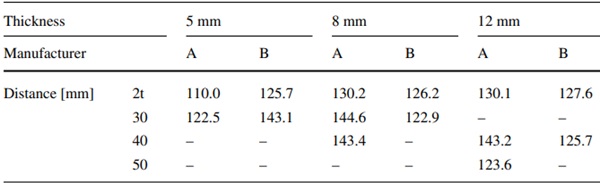
These FE models were used for adjusting the test speed of the test series. For glass bending, the maximum principal stress occurs at the hole in the FE model. This notch stress is also assumed to cause the breakage of the glass pane at the hole. For determining the test speed, the FE models simulated the maximum principal stress at the hole for the characteristic bending strength of thermally toughened safety glass according to EN 12150 at 120 MPa for each of the eight test series. The single load required for this stress was converted with the demanded increase in stress of 2 MPa/s. This resulted in the force-controlled test speeds given in Table 1. Compared to specimens without cross-sectional weakening, the described method achieved about half the test speeds, which is on the safe side, as slower loading is more critical for the tensile stress of surface cracks in the glass.
Table 1 Adjusted force-controlled test speeds corresponding to the increase in stress of 2 MPa/s according to EN 1288-3 compared to force-controlled test speeds for specimens without cross-section weakening - Full size table
4.3 Evaluation of the fracture stress
The test specimens were taped with an adhesive foil in the area of the bending rolls to detect the fracture origin after breakage. With the adjusted force-controlled test speed for each test series, the drilled specimens were destroyed while recording the breaking force measured by the testing machine. To determine the fracture stress, the breaking force was calculated into the corresponding maximum principal stress at the hole of the solid model with chamfer and nominal thickness.
The reference specimens without holes were destroyed with the usual test speeds for their thickness. The equations in EN 1288-3 could be used for the reference specimens to calculate the bending strength. To determine the characteristic bending strength as a result of the fracture stresses, the single values of the reference values are statistically evaluated according to a normal distribution based on EN 1990 by calculating the 5% quantile with a confidence level of 75%.
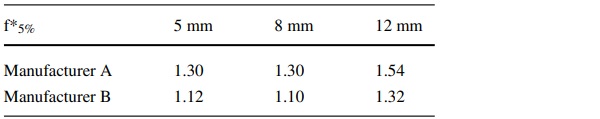
To put the high fracture stresses from the FE model into context, so-called overstrength factors f*5% were formed in equation (1) from the 5% quantile of the reference specimens without holes and the characteristic bending strength of thermally toughened safety glass.
![]()
The notch stresses from the FE model of the drilled specimen could now be related to the strength of the reference specimens by the respective overstrength factors from Table 2 and are referred to as the 5% quantile of the referenced fracture stress in Chapter 5.
Table 2 Overstrength factors f*5% depending on reference specimen classified by manufacturer and glass thickness - Full size table
5 Results
5.1 Evaluation of the pre-stress zones
Due to various photoelastic isochromatic images cut in the left and right holes and the two light sources of the wavelengths blue and green, only exemplary images are shown here, intended to cover the tendency.
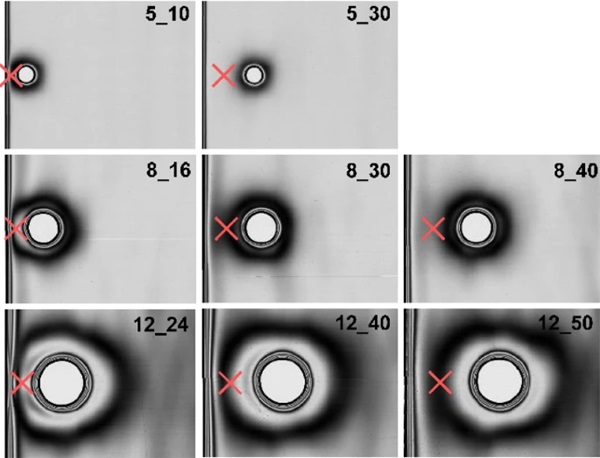
Figure 9 presents isochromatic images of the blue wavelength (λ = 455 nm) as an example for each of the eight test series. The designation comprises glass thickness t and edge distance d (t_d). Due to only one diameter per glass thickness, predicting the influence of the borehole diameter size is difficult. However, it can be noticed that the larger the hole diameter, the larger the zone of influence around the hole. In addition, with increasing glass thickness, photoelastic effects can be better observed.
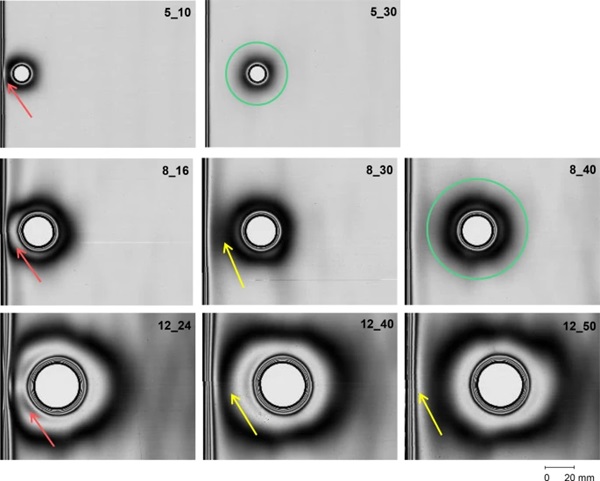
The pre-stress zones and influence zones around the hole are undisturbed at the specimen with t = 5 mm, d = 30 mm (5_30), and t = 8 mm and d = 40 mm (8_40). This can be seen in the symmetrical dark area around the hole (green circles), which neither appears deformed nor influences the edge isochromatics.
In comparison, at 8_30, a blurring of the pre-stress zone toward the edge can be recognised, which may indicate that pre-stress zone 1 of the surface does not exist, and pre-stress zones 2 and 4 are tangent to each other. At 12_50, the edge isochromatics bend slightly outward (yellow arrow). If the edge distance is reduced further, the influence zone at 12_40 is deformed and compressed, and a black shadow forms in the pre-stress zone of the hole, which was not yet present at 12_50.
At the edge distances 2t of each thickness (5_10, 8_16, and 12_24), the overlapping of the pre-stress zones can be seen. At 5_10, the photoelastic effects in thin glass are not yet as visible as in the thicker specimens, but it can still be observed that the two dark edge isochromatics cover each other. In 8_16, an additional white area appears in the hole influence zone, and the overall appearance of the pre-stress zone no longer appears symmetrical as in the undisturbed zone of 8_40. Similar observations can be made for 12_24, where the black curved isochromatic in zone 4 already observed in 12_40 intensifies, and the edge isochromatics lie very closely.
Figure 10 shows the isochromatic images of the test specimens from manufacturer a) A and manufacturer b) B for test series 8_30 as an example to illustrate the differences within a test series and between the two manufacturers.
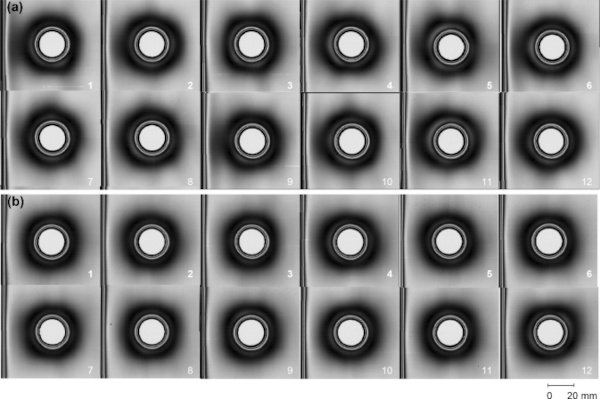
Within a test series, there are minor deviations from each other. For example, the white shadows in the dark influence zone of the hole sometimes form differently, see Fig. 10a) specimens 11 and 12. In Fig. 10a), specimens 1 and 2 have an asymmetrically wide influence zone around the hole towards the edge, while in Fig. 10a) specimen 3 has a comparatively narrow influence zone and a clear separation from the glass edge. Within the test series of manufacturer B, the effects are more uniform in the isochromatic images. Comparing the test series of the manufacturers with each other, it is noticeable that the test specimens of manufacturer A show more significant stress-optical effects than those of Fig. 10b).
5.2 Surface compressive stress
The results of the surface compressive stresses, the individual values per measuring point (grey and orange dots) and the average values (black and red dots) per test series are shown in Fig. 11, separated according to the two manufacturers. The two diagrams are divided into the three tested glass thicknesses. On the x-axis, the values of the reference specimens without holes are shown first, followed by the values of the drilled samples with an indication of the edge distance. For the drilled samples, the black dots indicate the results at the measuring point centred on the pane (MP surface), while the blue dots were measured at the two measuring points centred between the edge of the hole and the edge of the glass (MP hole).
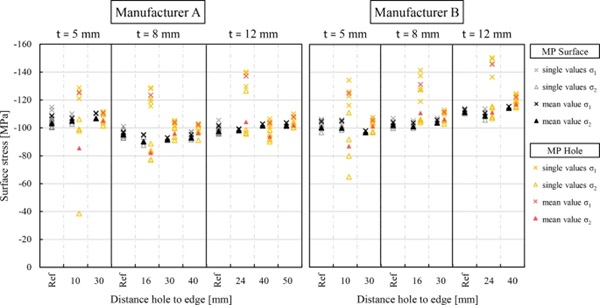
The manufacturers differ from each other concerning the glass thickness. The reference panes showed high, uniform pre-stress with surface compressive stresses σ1 averaging 104.8 MPa and low principal stress differences averaging 3.3 MPa. The difference between σ1 and σ2 is considered as an indication of the homogeneity of residual stresses. The most significant principal stress differences were associated with the glass thickness of 5 mm. For the 8 mm glass thickness of manufacturer A, surface compressive stress values over 100 MPa are noticeable for all test series, including the reference series; nevertheless, these test series still comply with the value of 90 MPa required by Mognato et al. (2018) for thermally toughened safety glass, with a minimum value of 92.8 MPa.
The principal stresses σ1 and σ2 show minor deviations of a maximum of 7.6 MPa at the measurement points surface of the drilled specimens. The stress level of σ1 varied within the test series of the different edge distances. This can be explained by the different furnace parameters for each hole geometry in the tempering process.
Next to the MP surface, the MP holes are shown for direct comparison within the test series. The two measuring points at the hole per test specimen show average standard deviations of approximately 4.5 MPa. The value of σ1 is not decisive for these measuring points, but the principal stress difference indicates whether zone 1 of the surface exists. The most significant principal stress differences of σ1 and σ2 in the borehole area occur at the minimum edge distances in each case, which can be observed for all glass thicknesses and manufacturers. The principal stresses deviate from each other by an average of 35 MPa and a maximum of 86.4 MPa. On the one hand, this may indicate that pre-stress zone 1 is not present there. On the other hand, the measurement of the surface compressive stress in the area between the hole and the edge proved to be very difficult because, on the one hand, the laser light was partially scattered at the edge of the hole.
When the edge distances are increased, the principal stresses still scatter more than on their reference point in the surface, but not as much as at the edge distances 2t. In all test series, the stress level σ1 in the area of the holes is higher than at the measuring points in the centre of the pane. This can be justified because the measurement is already in the influence area of the hole. The black regions in the isochromatic images indicate higher retardations, so higher stresses occur in this area.
5.3 Strength results
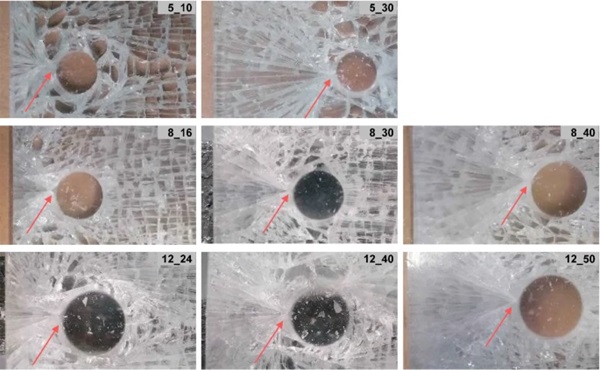
The four-point bending tests were performed on five specimens per test series. Since the panes were previously taped in the area of the hole, the fracture origin could be determined from the fragments held together. For all taped specimens, the fracture origin could be identified at the transition from the tension surface to the chamfered edge of the hole, as assumed. Figure 12 shows the fracture origin on selected specimens for each bore geometry.
The statistical evaluation of the fracture stresses at the notch, determined from the experimentally determined fracture forces from the FE models, is shown as a diagram in Fig. 13. Separated by glass manufacturer and glass thickness, the test series with the different edge distances are listed. The columns represent the mean and 5% quantile values of the bending stresses of the reference specimens without holes, which could be calculated using (EN 1288-3: 2000). For illustration purposes, the characteristic bending strength of thermally toughened safety glass is also given as a limit value with 120 MPa.
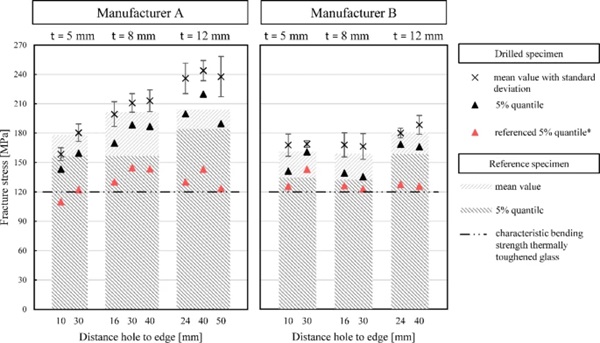
At first glance, the black data points of the drilled specimens also show high values, all above 120 MPa. The difference between the two glass manufacturers is particularly striking. Although the samples from manufacturer A achieve higher breaking forces than those from manufacturer B, they scatter more.
As already described in Chapter 4.3, these notch stresses were related to the strength of the reference specimens to the characteristic bending strength of thermally toughened safety glass using overstrength factors. These values are shown in red. Especially for the test series of 12 mm glass, the values experienced a significant decrease compared to the unchanged values. Although the manufacturers’ values converged, a difference with the lower values of manufacturer B is still clearly visible. A tendency of the strength about the edge distance is not apparent since the 5% quantile values depend very much on the scatter within the test series. For manufacturer A, the 5 mm glass thickness test series with an edge distance of 10 mm no longer reaches the limit of 120 MPa. Other test series, such as A-5 mm–30 mm, A-12 mm–50 mm, and B-8 mm–40 mm, are just at the limit. Table 3 lists the referenced 5% quantile of the notch stresses.
Table 3 Referenced 5%-quantile [MPa] of fracture stress - Full size table
6 Discussion
This chapter evaluates the results of the different methods used to examine the residual stresses of the near-edge holes in this study.
The isochromatic images confirm the evaluation of the measurement of the surface compressive stresses at the hole. The specimens with the least edge distances per thickness (5_10, 8_16, 12_24) have the most significant principal stress differences σ1 and σ2, indicating that the homogeneous pre-stress of zone 1 of the surface is not attained at these measurement points. As Fig. 14 shows, the measurement points at the hole with an edge distance of 2t are already located in the inner, bright region around the hole. As seen in the isochromatic images, the pre-stress zone of the edge and the holes overlap.
The evaluation of the four-point bending tests in this study is based on the maximum principal stress from the FE model. Since this maximum stress varies depending on the design of the FE mesh in the hole region, the evaluation of the notch stress cannot be unambiguously determined and is, therefore, an attempt to represent reality in a model. Comparing the isochromatic images with the results of the strength tests, the mean values of the bending strength values agree well with the photoelastic results. The decreasing strength can also confirm the previous observation in the isochromatic images.
The influence of the manufacturer is visible in all three evaluation methods. Manufacturer A achieves higher strength values, represented by more substantial effects in the isochromatic images. The surface compressive stresses tend to be higher for manufacturer B, whose specimen achieves lower values in the strength tests. It should be noted that the bending strength of the glass strongly depends on the surface quality, which results from production and handling but cannot be represented in the isochromatic images.
The study showed that even edge distances lower than the 80 mm required by DIN 18008-3 have a high strength above the required bending strength of thermally toughened safety glass. Nevertheless, the results should be treated cautiously because the tests cover only one diameter per glass thickness. The vast differences between manufacturers must also be considered. Glass with holes is pre-stressed using a different furnace program during tempering than without holes. For inexperienced glass manufacturers, the homogenous cooling process can be complex.
Clear overlaps of the pre-stress zones were visible at an edge distance of 2t. Only the edge distance of 5t showed an undisturbed formation of the influence zone around the hole on the photoelastic isochromatic images.
7 Conclusion
This paper showed photoelastic and destructive investigations of near-edge holes in thermally toughened safety glass. Cylindrical holes in glass with thicknesses of 5 mm, 8 mm, and 12 mm were investigated, each with a hole diameter with a minimum distance of 2t and further edge distances, resulting in eight test series with different hole geometries. In addition, there were reference specimens without holes for comparison. The investigations were limited to only one borehole diameter per glass thickness with one type of loading. As only the strength behaviour of specimens with holes at the edge was examined, suitable methods should be used to investigate the strength of holes near the edge at the corner.
The investigations were performed non-destructively using photoelasticity and then destructively with a four-point bending test. In the isochromatic images, an overlap of the pre-stress zones was observed in the specimens of 2t. This was also confirmed by measuring the surface compressive stress, as the most significant principal stress differences σ1 and σ2 occurred at the measurement points of distance 2t. With increasing edge distance, the overlap of the pre-stress zones diminished until the pre-stress zones were only in contact or the zone of influence around the hole could form without interference for specimens with 8 mm glass thickness with 40 mm hole edge distance, which corresponds to an edge distance of 5t.
The destructive tests on five specimens per test series were carried out using the four-point bending test to determine the bending strength of the specimens with near-edge holes. The bending test was simulated using the finite element method with solid models, considering the chamfer to determine the fracture stresses at the notch, representing a stress peak. Beforehand, the increase in stress required in EN 1288-3 to be 2 MPa/s was adapted to the specific test series since the hole implies an increase in bending stress across the width. Compared to test speeds for specimens without holes, the test speeds at which the drilled samples were subsequently force-controlled to fracture were approximately halved. To put the high values into context, overstrength factors were determined depending on the strength of the reference specimen without holes and the characteristic bending strength of 120 MPa according to EN 12150. In this study, the referenced 5% quantile values of the fracture stresses reached, except for the test series of specimens with 5 mm glass thickness and hole edge distance of 2t, the limit of the bending strength of thermally toughened safety glass.
Summarised, the study showed that the total strength of the thermally toughened safety glass can be applied in the structural design in Germany for an edge distance of 5t. This conclusion is reached because the isochromatic images and surface stresses in this area indicate that the residual stresses are completely present in this area. In addition, the proposed edge distance is justified by ensuring safety for point-fixed glazing with edge-near holes, considering the significant deviations between the manufacturers.
Data Availability
The associated data will not be deposited.
Acknowledgements
The authors thank the glass manufacturers for providing the glass specimens.
Funding
Open Access funding enabled and organized by Projekt DEAL.
Author information
Authors and Affiliations
Institute for Material and Building Research, University of Applied Sciences Munich, Karlstraße 6, 80333, Munich, Germany - Lena Efferz & Christian Schuler
Institute and Laboratory for Structural Engineering, University of the Bundeswehr Munich, Werner-Heisenberg-Weg 39, 85579, Neubiberg, Germany - Geralt Siebert
Corresponding author
Correspondence to Lena Efferz.
Ethics declarations
Conflict of interest
On behalf of all authors, the corresponding author states that there is no conflict of interest.