Authors: Abdelhakim Mesloub, Artira Ghosh, Ghazy Abdullah Albaqawy, Emad Noaime and Badr M Alsolami
"Energy and Daylighting Evaluation of Integrated Semitransparent Photovoltaic Windows with Internal Light Shelves in Open-Office Buildings", Advances in Civil Engineering, vol. 2020, Article ID 8867558, 21 pages, 2020. https://doi.org/10.1155/2020/8867558
Abstract
In modern architecture, highly glazed commercial buildings account for considerable amount of energy, specifically in cold and hot climates because of heating, cooling, and lighting energy load demand. Abatement of this high building energy is possible by employing semitransparent photovoltaic (STPV) window which has triple point advantages as they control the admitted solar gain and daylight and generates benign electricity. Integration of internal light shelves (ILS) to this STPV window assists in controlling visual comfort. Thus, this study aims to evaluate the impact of a nonuniform layout of double-glazing (DG) low-e STPV and DG low-E argon-filled clear glass integrated into a fully glazed open-office facade combined with ILS in cardinal orientations under Riyadh, London, Kuala Lumpur, and Algiers climates.
Comprehensive energetic and radiance simulations were conducted to evaluate three groups of STPV configurations. The first group replaced the glazing area with amorphous silicon (a-Si) modules with different transparencies; the second and third groups changed only 75% and 50% of the glazing area, respectively, with STPVs integrated with the ILS. The results revealed that the integration of a-Si modules did not meet the visual comfort requirements but obtained the maximum saving in the east-west axis. It was also found that the optimum design on the south-facing facade with the nonuniform facade achieved 50% of STPV10 coverage in clear glazing windows combined with ILS; the energy saving ratios comparing the reference models were 76%, 83%, 65%, and 70% in Riyadh, London, Kuala Lumpur, and Algiers, respectively. Thus, the integration of STPVs with ILS is considered a more efficient way and effective solution to reduce the possibility of glare discomfort.
1. Introduction
Currently, the overall energy consumption in the buildings sector is responsible for almost one-third of the energy used worldwide. Heating, cooling, and artificial lighting load demands are the reason for this high consumption. Energy loss and gain both incur in higher order through the transparent building window envelopes [1, 2]. Traditional buildings windows are highly transparent single- or double-glazing type which allows excessive amount of solar heat and daylight both into a building interior. In modern architecture, percentages of fully glazed facades are gaining importance which can increase further the energy demand. Controlling this entering light is of utmost importance to reduce the building energy demand and enhance the occupants’ comfort [3].
However, daylight in a fully glazed building design provides tremendous psychological benefits to building occupants and reduces electrical lighting energy [4]. Hence, suitable light control mechanism is required which will control the solar heat and by employing proper daylighting overall energy cost can be reduced. Previously, light shelves [5] were often employed to building to obtain visual and thermal for occupants. Light shelves can be static flat or curved reflective shaped and can easily be mounted on the external or internal part of vertical opening. They can offer shading, redirect incoming light flux towards the ceiling, and improve uniform daylight penetration [6–8]. However, it has some limitations such as increase of solar gain may offset the lighting energy saving potential, issues created from glare, and maintenance requirement for dynamic light shelves [7].
Recent trend is to employ semitransparent window over fully transparent window to control the entering solar light. Semitransparent photovoltaic (STPV) windows are specially gaining importance as they have ability to abate the energy demand being energy efficient over conventional windows [9]. They are considered a promising fenestration technology that can preserve energy and provide thermal and visual comfort [10]. Thin-film a-Si (amorphous silicon), cadmium telluride (CdTe) [11], and copper indium gallium selenide (CIGS) PVs have the ability to modulate the entering light and produce benign power [12, 13]. Also third-generation DSSC [14] and perovskites [15, 16] are able to tune the transparency. Some of them are integrated in commercialised products with module effectiveness of up to 10% and cell efficiency of up to 13.6% [17] on the basis of the optical (visible light transmittance) and thermal characteristics and PV system used [18].
The most significant rating indices used for evaluating the thermal performance of an STPV fenestration system are the solar heat gain coefficient (SHGC) and thermal transmission (U-value) [19]. In short, the U-value measures the overall heat transfer from a material and is expressed between the values of 0.1 and 1, where lower U-value indicates high thermal insulation. It is considered an important factor in cold climate [11], but has less effect than the SHGC in warmer climate due to direct solar radiation [20]. Fung and Yang [21] found that the area of solar cells in the PV module significantly affect the total heat gain, since nearly 70% of the total heat gain was reduced when the solar cell area ratio, defined as PV module area covered by solar cells, was set at 0.8.
However, other parameters, such as solar cells’ efficiency and the PV module thickness, had only limited influence. He et al. [22] compared the performance of a-Si PV single- and double-glazing windows in east China both numerically and experimentally. The double-glazing solution was found to be able to decrease indoor heat gains to 46%, enhancing indoor thermal comfort. Didoné and Wagner [23] carried out a numerical simulation to assess the potential energy savings of STPVs in tropical climates. The results revealed that the use of an appropriate control system and an energy production could achieve 17% to 43% potential energy savings. In the same climate, Ng and Mithraratne [24] evaluated the overall energy performance of six commercially available STPV modules by calculating net electrical benefits (NEB) for different WWR window designs in Singapore.
They found that the integration of all STPVs with appropriate WWR performed better than conventional windows in terms of energy saving. Elsewhere, the possible benefits of integrating STPVs in Mediterranean climates was explored by Olivieri et al. and Mesloub et al. who suggested that the technology potential is high [25, 26]. While Huang et al. [27] proved that double-glazing Low-e STPVs performed better than conventional double-glazing windows on the west and east orientation in cooling dominant climate. Kapsis and Athienitis [28, 29] investigated the effect of optical parameters of STPV windows by using the first-generation module on the energy performance of using the concept of a three-section facade.
The results revealed that STPVs with 10% transmittance could save up to 53.1% electricity and daylight requirements achieved with an effective transmittance of more than 30% and 40%. Li et al. [30] recommended that the ratio of PV cells for double-skin STPV facades can be less than 60% to achieve the requirements of indoor daylighting in Tianjin, China. Chang et al. [1] developed a novel dynamic daylighting metric to assess STPVs by considering the effect of window sizes and orientations within the same context. The results revealed that the optimal orientation is the south to achieve the lowest annual net energy and daylighting quantity and quality.
However, power generation from STPV is strongly correlated with the transmittance level of PV. Lower transmittance generates higher power while stops viewing from interior to exterior while higher transmittance generates lower power and allows viewing. The current practice of STPVs is applied to uniform layouts for the whole window area. Only a few studies have investigated the spatial distribution of glazing types [31], as well as the application of STPV with different transparencies and window-to-wall ratio (WWR), which is considered an effective daylighting strategy to control the quantity of daylight and produce energy [32].
However, for large STPV facades, the lower part of the window can reduce the light transmission but the upper part still allows higher light [33] which further needs to be abated. To limit the light transmission from the upper part of the window inclusion of light shelves can be an option. For the first time, this study will evaluate the impact of nonuniform layouts of DG low-e STPV and DG low-e argon-filled clear glass integrated in fully glazed open-office facades, combined with internal light shelves in cardinal orientations in different climates. The outcome will propose an optimum balance solution in terms of energy saving and visual comfort in the application of future buildings.
2. Materials and Methods
A comprehensive numerical parametric simulation of integrated STPVs combined with ILS was conducted based on EnergyPlus and Diva-for-Rhino simulation tools. All STPV configurations were simulated in four diverse climates to analyze the influence of different latitude and climatic conditions on the optimal configuration of the combined systems. The Meteonorm meteorological database corresponding to Riyadh was used for the subtropical desert climate, while the Typical Meteorological Year (TMY) files of London, Algiers, and Kuala Lumpur were used for the marine west coast (temperate) and Mediterranean climates and tropical rainforest, respectively. Among the most important reasons for selecting these cities are the differences in external temperature (either too cold, too hot or average) and the amount of solar radiation that affect the solar panel performance and external illuminance in each zone based on the sky condition. Table 1 shows the location and climatic conditions of each zone based on Köppen Climate Classification.
Table 1: Climatic conditions of different cities used in this study.
2.1. Perimeter Zone Configuration
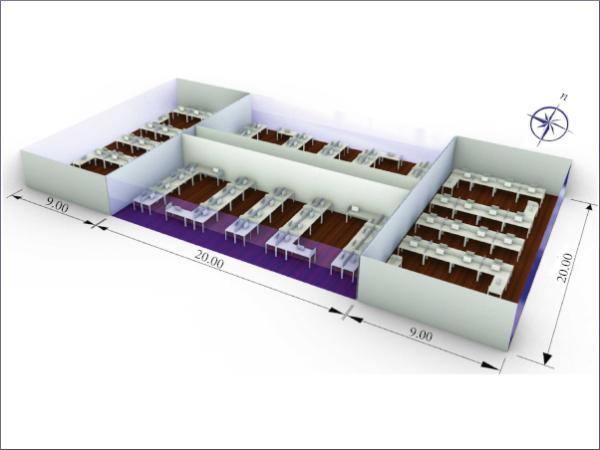
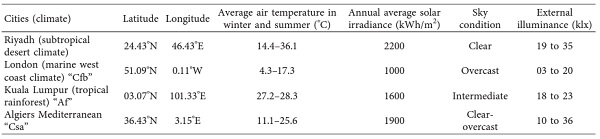
An open-plan perimeter office zone was modelled using the Diva-for-Rhino simulation software in cardinal orientations as shown in Figure 1. The area of the open-office is based on the US Department of Energy (DOE) large commercial building prototype [34], which is a 180 m2 furnished area that is 20 m wide by 9 m deep with a 3 m high ceiling. The height of the furniture was taken into account to provide all occupants with access to outdoor views and no exterior obstructions.
2.2. STPV Configurations
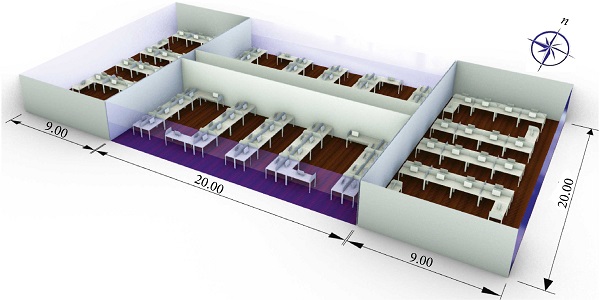
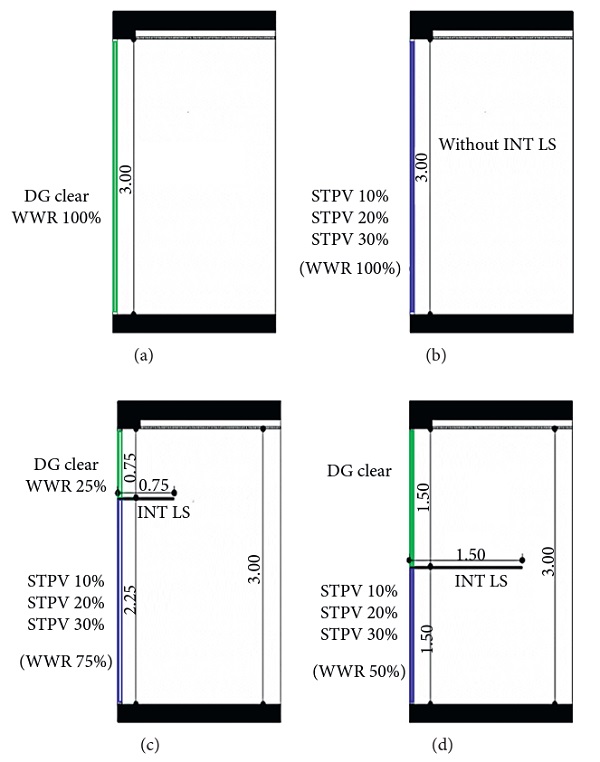
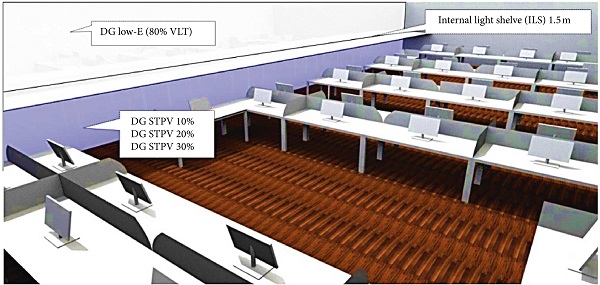
In this study, a total of nine STPV configurations and reference models were examined referring to the level of transmittance (10%, 20%, and 30%) and the height and length of flat internal light shelves. The spatial combination of STPVs, glazing surfaces, and internal light shelves is based on the principle of dividing the facade into upper daylight and the lower part for viewing [31]. Meanwhile, the length of ILS is equal to the distance to the clerestory [7]. The STPV configurations can be divided into three main groups.
The first group replaces the full clear glazing (100% WWR) by STPVs with variant transparencies. The second group considers the glazing divided into two continuous stripes. The lower part of the glazing is integrated with the STPVs with 75% of total area of glazing. The upper daylight part utilises the clear glass as well as sets up flat ILS 0.75 m in length and 2.25 m in height. The third group divides the glazing into two equal continuous stripes, with a 1.5 m ILS length, while keeping STPVs on the bottom and clear glass on top, as clearly shown in Figure 2.
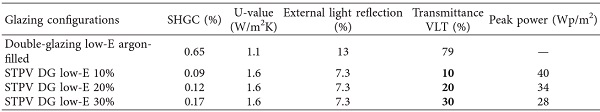
The chosen STPVs were amorphous silicon (a-Si) types that were obtained from Onyx in Spain and had a range of visible light transmittance (10%, 20%, and 30%), suitable for building residents with an excellent outdoor view. The performance of ordinary a-Si PV thin-film modules becomes distinctly low (less than 5%). As a result, a change between the energy and daylighting performances ought to be affected to maximise the benefits of energy. A better PV module transmittance could result in a decline of energy conversion efficiency as well as an upgrade of the solar heat benefit coefficient. Table 2 describes the thermooptical properties of various STPV models used in the analysis.
2.3. Energy and Radiance Simulation
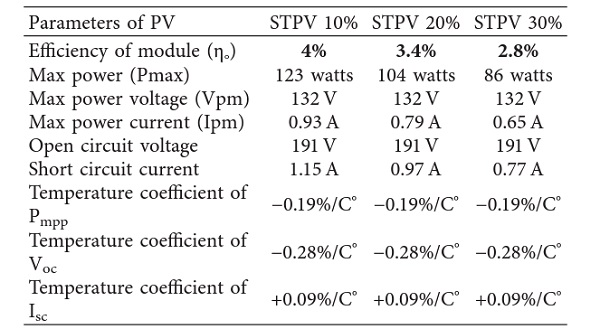
The energy modelling of EnergyPlus makes it possible to simulate the energy production of the STPV system by means of an equivalent one-diode model [35]. This model uses an empirical relationship to predict the operating performance of the PV based on conditions such as PV cell temperature and estimation of conversion efficiency for each time step. Nevertheless, a comprehensive validation was performed in previous studies [25, 36]. The electrical properties of various STPV transparencies applied in this study are summarised in Table 3.
Table 3: Input electrical parameters of various STPV transparencies.
On the other hand, an ideal HVAC system is also assumed to supply the required heating or cooling air to the related zone to meet the set point indoor air temperature of 26°C in the summer and 20°C in the winter season based on international standard (ASHRAE 55, ISO 7730), with a heating and cooling coefficient performance of 1. Taking into account that the simulated open-office components are in cardinal orientation, the floor, the ceiling, and the internal walls were adiabatic. The HVAC system was turned on only during the occupancy schedule, which was from 8.00 AM to 5.00 PM.
A flat LED ceiling surface-mounted luminaire with an input power of 17.4 W was installed in regular distances of 1.5 m by 2 m in columns and rows, respectively. This arrangement is for illuminating the whole work plane with a sufficient quantity of light in the case of an absence of daylight based on the lumen method [37].
The quantitative results derived from the radiance simulation (Diva-for-Rhino program) depend significantly on the successful configuration of the input parameters according to the specification of the STPV and ILS design. The radiance parameters such as materials reflection as depicted in Table 4 were specified to ensure the photometric accuracy of the results, which can be categorised as a ray-tracing algorithm, which tracks rays of light backwards from the eye to the focus of the scene [38]. The simulation radiance parameters used in the daylighting simulation is depicted in Table 5.
Table 4: Material reflection coefficient percentage.
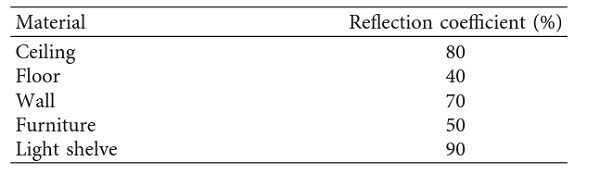
Table 5: Radiance parameters used in daylighting simulation.
![]()
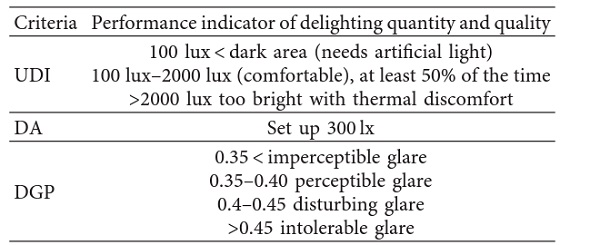
In this context, the annual climate-based daylight metrics were applied to evaluate the daylighting performance and were compared with the reference model under various sky and external illuminance conditions. The first metric is daylight autonomy (DA), which was evaluated based only on a minimum illuminance level of 300 lux, but this metric alone failed to consider the effect of glare under excessive daylighting [1, 39]. The second metric was the useful daylight illuminance (UDI), which required upper and lower thresholds from 100 lux to 2000 lux to provide an effective mechanism to indicate high levels of illumination linked with discomfort glare and heat gains [40]. Furthermore, the Daylight Glare Probability (DGP) is for glare assessments [41]. The criteria of assessments for each metric are summarised in Table 6.
Table 6: The performance indicators of visual comfort used in this study.
3. Results and Discussion
3.1. Energy Performance Evaluation
The impacts of spatial distribution transparencies and integrated ILS on the STPV performance set up in open-office buildings in different climates were numerically investigated in terms of annual net energy consumption. Hereafter, the net energy consists of cooling, heating, and lighting energy minus the energy produced with a-Si solar cells. It is expressed with kWh per year, as presented in Tables 7 and 8.
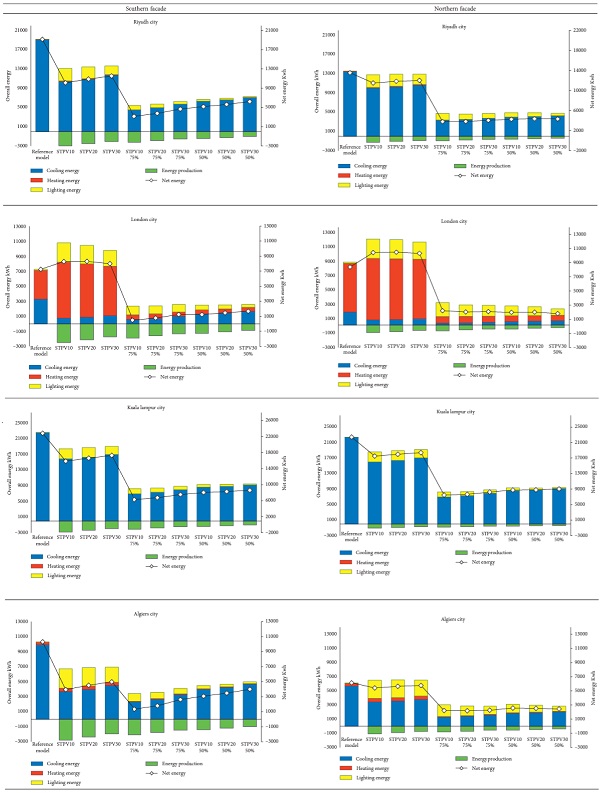
On an annual basis, the results revealed that the net energy consumption of all STPV configurations compared to the reference model has a significant reduction, in particular, the cooling load energy, except for the first group of STPV configurations with all transparencies in the south-north axis of London due to the counterproductive effect on the heating load, which almost doubled from 6568 kWh to 7435 kWh for STPV 30% and STPV 10%, respectively. Inversely, the net energy used by the first group was less than other configurations in the east-west axis because of the sharp decline of cooling energy, as depicted in Table 8.
Although the lighting energy consumption recorded the highest values, it can reach up to 2600 kWh in overcast sky conditions in London. The trend of PV modules with various transparencies from 10% to 30% slightly reduced the heating and lighting energy; meanwhile, they increased the cooling energy due to the entrance of more solar radiance. Also, there was a remarkable decrease of energy production because of the low conversion energy efficiency.
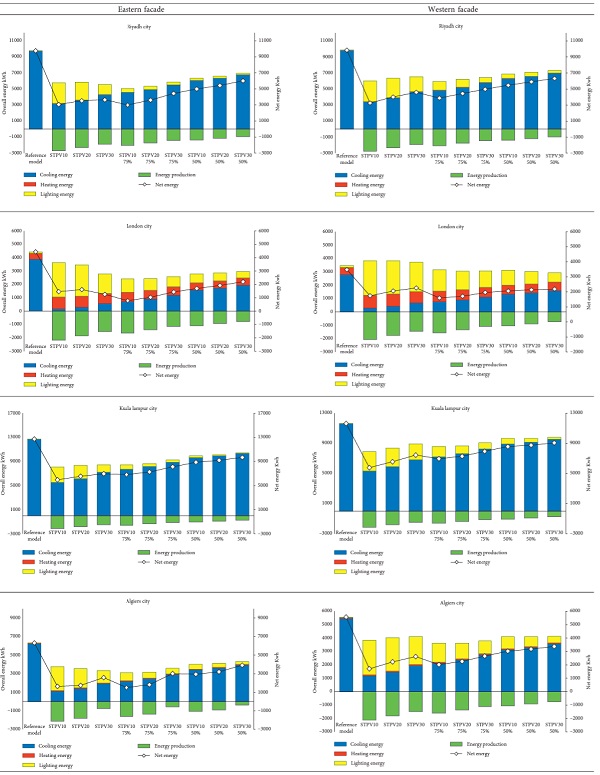
As expected, the integration of STPVs in the southern facade acquired the maximum annual yield, while the eastern facade had the least lighting energy consumption. Nevertheless, the more transmittance glazing integrated into the upper part of the window with ILS obtained a lower lighting energy in the southern facade, as depicted in the third group. The south-north axis consumes more energy than the east-west axis within all climate contexts.
The integration of ILS and STPV (second and third groups) leads to a significant improvement in terms of energy in the south-north axis rather than the east-west axis because of the substantial impact of ILS with high transmittance of clear glass in the upper part of window, which reflected the concentrated solar heat gain and daylight into the back area to reduce both cooling and lighting energy. Consequently, the optimum energy performance of various STPVs combined with ILS configurations achieved with the second group (75% of STPV10 with 0.75 m ILS) in the south-north axis and the first group (STPV10 without ILS) in the east-west axis.
The variances of net energy consumption between the optimum and worst configurations in both axes are approximately 73% to 48% in Riyadh, 94% to 30% in London, 64% to 36% in Kuala Lumpur, and 73% to 50% in Algiers, which indicates the importance of balancing the spatial distribution of glazing and the significant role of ILS in the southern facade that directly affects energy savings.
3.2. Daylighting Performance Evaluation
The evaluation of the daylighting performance of various integrated transparencies of STPV a-Si windows combined with ILS scenarios was based on achieving a balance between climate-based daylight metrics (DA300 lux & UDI100 lux-2000 lux thresholds) and DGP for glare comfort. It is important to mention that a-Si windows modules were treated as uniform optical properties. Three effective visible transmittance values of the STPV window modules were simulated: 10%, 20%, and 30%. The minimum value of 10% was selected to ensure a certain minimum view to the outdoors.
The figures in Tables 9–12 present the DA300 lux distribution to quantify the daylighting performance of the reference model comparing various STPV configurations with and without ILS in cardinal orientation in different climates. The reference model achieves the DA300 lux requirements in all-sky conditions, at least 78% in cardinal orientation. On the contrary, the first group, which replaced the clear glazing with STPVs with all transparencies, did not meet the requirements of illuminance design in office 300 lux, the highest percentage obtained in the south orientation with less than 20% in the best scenario. The second group noted a remarkable improvement compared to the first group.
Specifically, the south orientation reached up to 20%, 15%, 9%, and 34% in Riyadh, London, Kuala Lumpur, and Algiers, respectively; this is due to the reflection of daylight that occurs in the middle of the office because of the integration of ILS and 25% of clear glass. However, this enhancement in DA300 lux distribution still did not achieve the minimum target of 50%. The third group can effectively improve luminous environment and exceed 50% of DA300 lux in all the southern offices in all climate regions, increasing from 32% to 59% for (50% of STPV 30%) compared to (75% of STPV 30%) in Riyadh, 30% to 61%, 11% to 64%, and 40% to 73% in London, Kuala Lumpur, and Algiers, for the east-west axis only achieved in tropical climate.
Table 9: DA300 lux distribution of fully glazed open office in cardinal orientations (Riyadh).
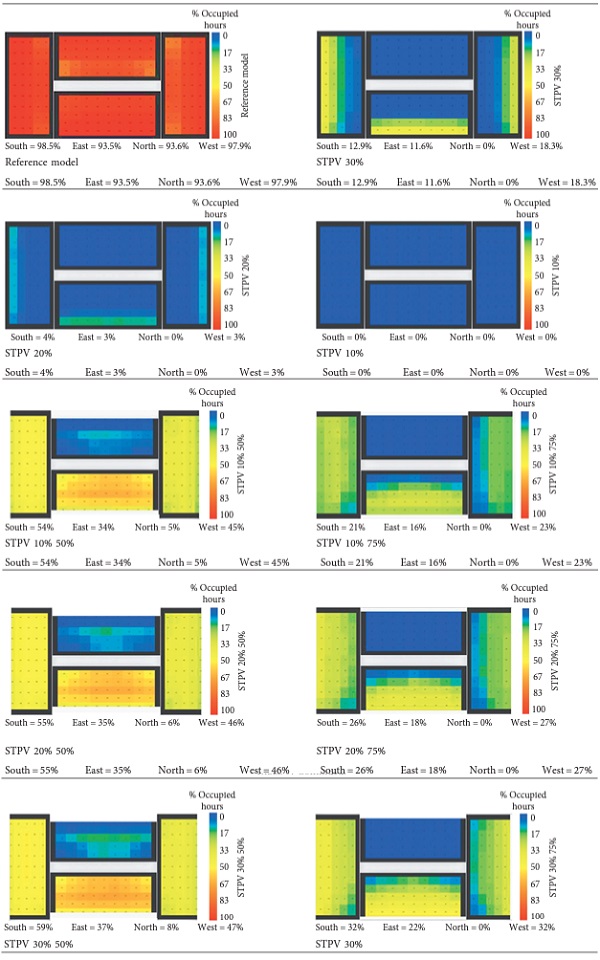
Table 10: DA300 lux distribution of fully glazed open office in cardinal orientations (London).
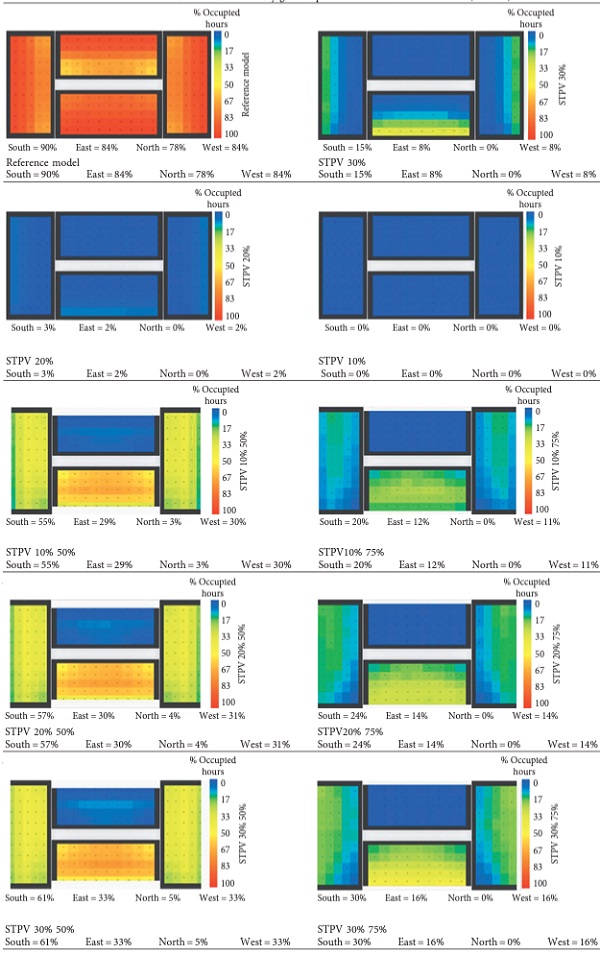
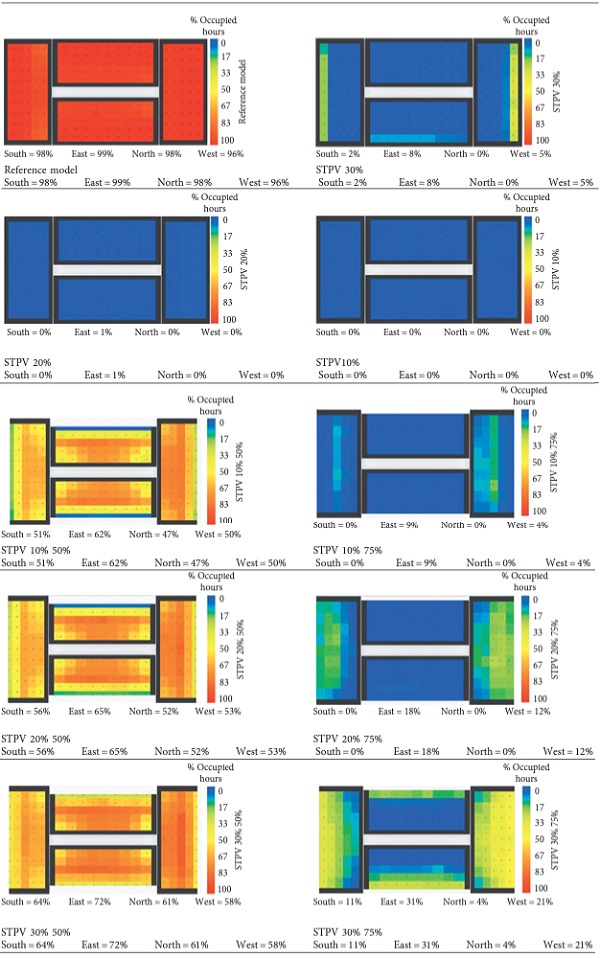
Table 12: DA300 lux distribution of fully glazed open office in cardinal orientations (Algiers).
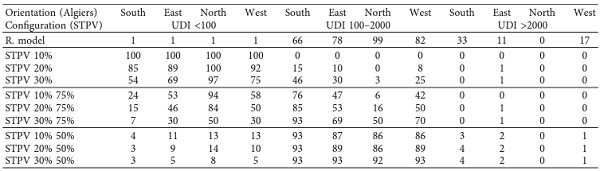
Tables 13–16 display the three UDI bins of the same configurations mentioned with the first climate-based daylight metric. The results confirmed again that the reference model achieved higher than 50% UDI100 lux–2000 lux, but a considerable percentage of UDI >2000 lux exposed to glare thermal discomfort in the south facade due to high transmittance reached 25%, 28%, and 33% in Riyadh, London, and Algiers, respectively, and 24% in Kuala Lumpur east-orientation. It can be seen that UDI <100 in the first group configuration ranges from 100% for STPV10% to 66%, 62%, 55%, and 54% for STPV30% in in Riyadh, London, Kuala Lumpur, and Algiers, respectively. Consequently, these results indicated that the performance of daylighting is unsuitable for the integration in open-office buildings in all climates. The integration of ILS in the second and third groups revealed a significant proportion of the working hours of desirable levels of illumination (i.e., appearing in the UDI100–2000 lux threshold), while the UDI >2000 lux was barely neglectable.
Table 13: UDI thresholds in cardinal orientations under clear sky condition (Riyadh city).
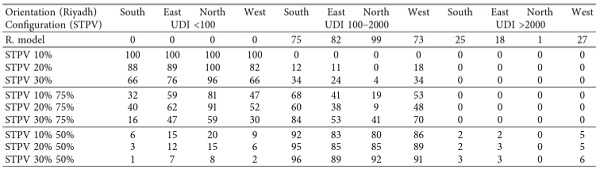
Table 14: UDI thresholds in cardinal orientations under overcast sky condition (London city).
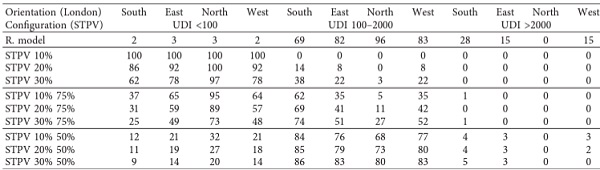
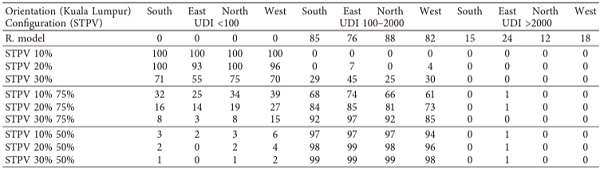
Table 16: UDI thresholds in cardinal orientations under CEI clear sky condition (Algiers city).
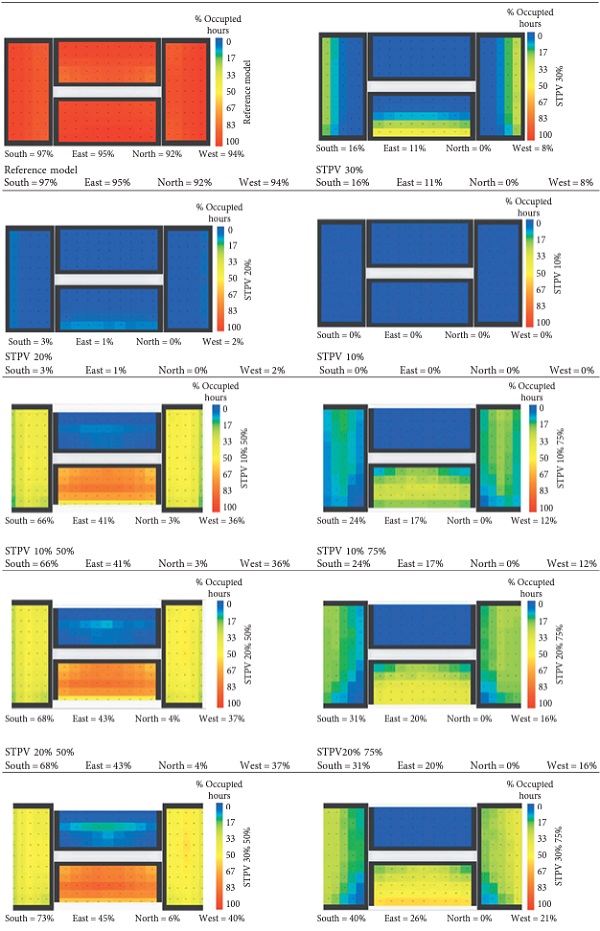
3.3. Visual Glare Evaluation
Glare is one of the most disturbing side effects of lighting. High luminance or extreme luminance differences associated with the visual field cause this effect. Computation of glare indices is done based on equations that can correlate luminance values or luminance distributions relating to the field of view of the observer, with the human glare sensation. Therefore, the DGP metric was employed to evaluate the annual daylight glare of reference models compared to the optimum STPV combined with ILS configurations based on their net energy and climate-based daylight metrics performance in various orientations and climates as shown in the figures included in Table 17.
Table 17: DGP in cardinal orientation of reference model open-office buildings in different cities.
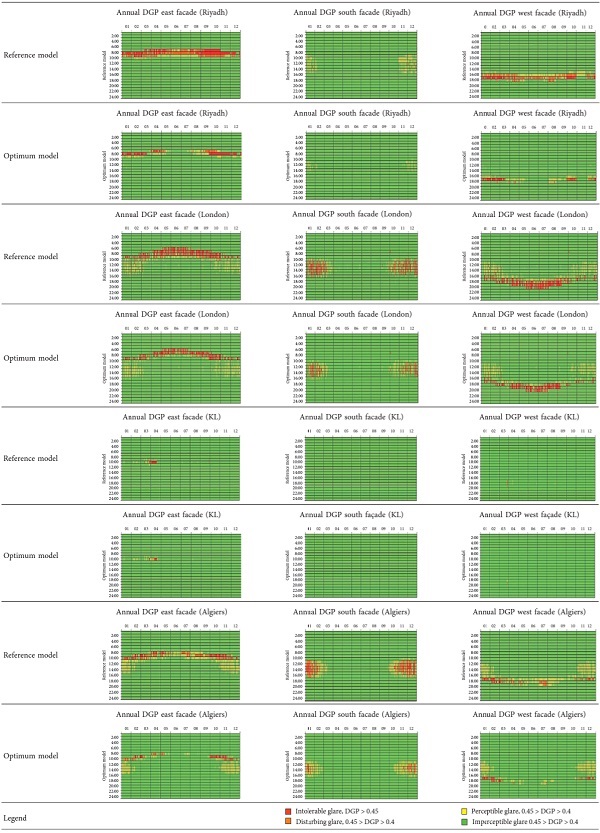
The temporal maps of the occupied hours of the reference model illustrated that the simulated office in tropical climates (low latitudes) has imperceptible glare through the year. This is because the solar altitude, which is higher at midday, caused a remarkable drop in cardinal orientation, especially when adopting ILS. In contrary, the remaining tested climates (medium and high latitudes) show intolerable glare in the east-west axis, which can be explained due to the solar altitude in the winter season being lower, which causes a direct penetration to the office. The integration of optimum configuration eliminates intolerable glare from an imperceptible glare state in the summer season in cardinal orientation due to the usage of ILS that reflects the direct sunlight to the center and back area of the office. Furthermore, it provides a significant improvement of reducing glare states, in particular in southern orientations.
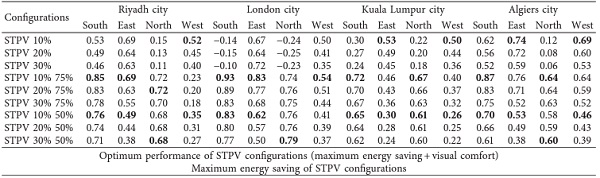
3.4. Energy Saving Evaluation
The largest potential of maximum and optimum percentage savings that can be attained by integrating nine STPV glazing combined with and without ILS compared of employing the reference model (see the base model) in cardinal alignments within four different cities can be seen in Table 18. The table showcases inconsistent savings in an approximate range of 6% to 93%, and, in some cases, the result was negative (no-savings) compared to the base model. A significant percentage of savings was achieved in the southern orientation by using STPV10 75%, whose maximum energy savings were estimated to be 85%, 93%, 72%, and 87%, due to receiving the maximum solar energy, high conversion efficiency compared with other STPV modules and the important role of ILS that reduce the control the distribution of light in deep office which offers reduction in lighting and cooling energy.
Nevertheless, the lowest saving achieved in the northern orientation by using the first group (fully STPV) had a negative percentage in London city. The integration of STPV10% in east-west axis shows the highest saving percentages because of the low performance of ILS in these orientations. The optimum performance of both axes obtained with the third group (STPV10 75%) is explained by the failure to fulfil the visual comfort conditions in particular the first group.
4. Conclusions
A comprehensive investigation was carried out in this study to evaluate the net energy and visual comfort of STPV configurations combined with and without ILS compared to a reference model of an open-office building in different climate regions. The key findings of this study are as follows:
- In hot regions, the integration of DG-STPV (first group) instead of DG-clear glazing can effectively reduce cooling energy consumption. Conversely, it increases the heating energy in a temperate climate region (London) mainly due to the thermal properties of DG-STPV, especially in south-north axis.
- The first and second group configurations did not provide sufficient daylight to the office. But the third group configurations meet the visual comfort requirements (DA300 lux, UDI100 lux–2000 lux) and eliminate a significant portion of glare in all climates because of the adoption of ILS that reflects and balances the quantity of illuminance in the centre and back daylit areas.
- The maximum performance in terms of overall energy is achieved by means of the second group in the south-north axis, with the first group in the east-west axis including all transparencies. As depicted in Table 17, the optimum performance of both axes obtained with the third group is explained by the failure to fulfil the conditions for visual comfort for the first group, as presented in Figure 3. The energy produced by a-Si modules with 50% of the total glazing area can compensate the lighting energy consumption. Thus, a significant percentage of saving was achieved by the south-north axis: 76% to 68%, 83% to 79%, 65% to 61%, and 70% to 60%. This is higher than the east-west axis: 49% to 35%, 62% to 54%, 30% to 26%, and 53% to 46% in Riyadh, London, Kuala Lumpur, and Algiers, respectively.
Overall, these outcomes give a vision of the correlation between the net energy visual comforts related to the spatial distribution of STPVs and clear glazing configurations combined with ILS in various climates. Also its adoption offers a range of benefits for the carbon footprint within buildings and develops design strategies that seek to balance implemention of STPV window and ILS with the improvements in energy efficiency and luminous environment aspects. Further studies need to evaluate the impact of internal dynamic shading devices and any STPV technology in terms of thermooptical properties and high conversion efficiency with various sizing. Eventually, the potential of applying STPVs combined with ILS has a substantial influence to provide better visual comfort and save energy in open-office buildings.
Data Availability
The data used in the study can be made available upon sending request to the corresponding author.
Conflicts of Interest
The authors declare that there are no conflicts of interest regarding the publication of this paper.
Acknowledgments
This research has been funded from Research Deanship in University of Ha’il, Saudi Arabia, through Project no. RG-20 105.
References
- Y. Cheng, M. Gao, J. Dong, J. Jia, X. Zhao, and G. Li, “Investigation on the daylight and overall energy performance of semi-transparent photovoltaic facades in cold climatic regions of China,” Applied Energy, vol. 232, pp. 517–526, 2018. View at: Publisher Site | Google Scholar
- K. Konis, “Evaluating daylighting effectiveness and occupant visual comfort in a side-lit open-plan office building in San Francisco, California,” Building and Environment, vol. 59, pp. 662–677, 2013. View at: Publisher Site | Google Scholar
- A. Ghosh and B. Norton, “Advances in switchable and highly insulating autonomous (self-powered) glazing systems for adaptive low energy buildings,” Renewable Energy, vol. 126, pp. 1003–1031, 2018. View at: Publisher Site | Google Scholar
- I. L. Wong, “A review of daylighting design and implementation in buildings,” Renewable and Sustainable Energy Reviews, vol. 74, pp. 959–968, 2017. View at: Publisher Site | Google Scholar
- A. A. Y. Freewan and J. A. Al Dalala, “Assessment of daylight performance of advanced daylighting strategies in large University classrooms; case study classrooms at JUST,” Alexandria Engineering Journal, vol. 59, no. 2, pp. 791–802, 2020. View at: Publisher Site | Google Scholar
- A. Mesloub and A. Ghosh, “Daylighting performance of light shelf photovoltaics (LSPV) for office buildings in hot desert-like regions,” Applied Sciences, vol. 10, no. 22, p. 7959, 2020. View at: Publisher Site | Google Scholar
- A. Kontadakis, A. Tsangrassoulis, L. Doulos, and S. C. Zerefos, “A review of light shelf designs for daylit environments,” Sustainability, vol. 10, no. 1, p. 71, 2018. View at: Publisher Site | Google Scholar
- H. Lee, S. Park, and J. Seo, “Development and performance evaluation of light shelves using width-adjustable reflectors,” Advances in Civil Engineering, vol. 2018, Article ID 2028065, 9 pages, 2018. View at: Publisher Site | Google Scholar
- A. Ghosh, “Potential of building integrated and attached/applied photovoltaic (BIPV/BAPV) for adaptive less energy-hungry building’s skin: a comprehensive review,” Journal of Cleaner Production, vol. 276, Article ID 123343, 2020. View at: Publisher Site | Google Scholar
- B. Joseph, T. Pogrebnaya, and B. Kichonge, “Semitransparent building-integrated photovoltaic: review on energy performance, challenges, and future potential,” International Journal of Photoenergy, vol. 2019, Article ID 5214150, 17 pages, 2019. View at: Publisher Site | Google Scholar
- H. Alrashidi, W. Issa, N. Sellami, A. Ghosh, T. K. Mallick, and S. Sundaram, “Performance assessment of cadmium telluride-based semi-transparent glazing for power saving in façade buildings,” Energy and Buildings, vol. 215, Article ID 109585, 2020. View at: Publisher Site | Google Scholar
- Y. Hamakawa, Thin-Film Solar Cells: Next Generation Photovoltaics and Its Applications, vol. 13, Springer Science & Business Media, Berlin, Germany, 2013.
- A. Shah, “Thin-film silicon solar cells,” in McEvoy’s Handbook of Photovoltaics, pp. 235–307, Elsevier, Amsterdam, Netherlands, 3rd edition, 2017. View at: Google Scholar
- A. Roy, A. Ghosh, S. Bhandari, P. Selvaraj, S. Sundaram, and T. K. Mallick, “Color comfort evaluation of dye-sensitized solar cell (DSSC) based building-integrated photovoltaic (BIPV) glazing after 2 years of ambient exposure,” The Journal of Physical Chemistry C, vol. 123, no. 39, pp. 23834–23837, 2019. View at: Publisher Site | Google Scholar
- S. Bhandari, A. Roy, and A. GhoshT. K. MallickS. Sundaram, “Perceiving the temperature coefficient of carbon-based perovskite solar cells,” Sustainable Energy & Fuels, vol. 4, 2020. View at: Publisher Site | Google Scholar
- A. Ghosh, S. Bhandari, S. Sundaram, and T. K. Mallick, “Carbon counter electrode mesoscopic ambient processed & characterised perovskite for adaptive BIPV fenestration,” Renewable Energy, vol. 145, pp. 2151–2158, 2020. View at: Publisher Site | Google Scholar
- Laboratory NREL, Champion Photovoltaic Module Efficiency Chart, NREL, Washington, D.C, USA, 2020.
- A. N. Özakın, S. Karsli, F. Kaya, and H. Güllüce, “The heat recovery with heat transfer methods from solar photovoltaic systems,” in Journal of Physics: Conference Series, vol. 707, no. 1, IOP Publishing, 2016. View at: Publisher Site | Google Scholar
- C. Kurayama, “Development of a measurement system for SHGC and U-value: study on SHGC and U-value for fenestration and shading system part 1,” Journal of Environmental Engineering (Transactions of AIJ), vol. 71, no. 604, pp. 15–22, 2006. View at: Publisher Site | Google Scholar
- P. Orouji, A. Vakili, M. K. Behrouz et al., “Methodology of standardizing the energy labeling and rating of window fenestration in Iran,” Sustainable Energy Technologies and Assessments, vol. 33, pp. 24–33, 2019. View at: Publisher Site | Google Scholar
- T. Y. Y. Fung and H. Yang, “Study on thermal performance of semi-transparent building-integrated photovoltaic glazings,” Energy and Buildings, vol. 40, no. 3, pp. 341–350, 2008. View at: Publisher Site | Google Scholar
- W. He, Y. X. Zhang, W. Sun, J. X. Hou, Q. Y. Jiang, and J. Ji, “Experimental and numerical investigation on the performance of amorphous silicon photovoltaics window in East China,” Building and Environment, vol. 46, no. 2, pp. 363–369, 2011. View at: Publisher Site | Google Scholar
- E. L. Didoné and A. Wagner, “Semi-transparent PV windows: a study for office buildings in Brazil,” Energy and Buildings, vol. 67, pp. 136–142, 2013. View at: Publisher Site | Google Scholar
- P. K. Ng, N. Mithraratne, and H. W. Kua, “Energy analysis of semi-transparent BIPV in Singapore buildings,” Energy and Buildings, vol. 66, pp. 274–281, 2013. View at: Publisher Site | Google Scholar
- A. Mesloub, G. A. Albaqawy, and M. Z. Kandar, “The optimum performance of building integrated photovoltaic (BIPV) windows under a semi-arid climate in Algerian office buildings,” Sustainability, vol. 12, no. 4, p. 1654, 2020. View at: Publisher Site | Google Scholar
- L. Olivieri, E. Caamaño-Martin, F. Olivieri, and J. Neila, “Integral energy performance characterization of semi-transparent photovoltaic elements for building integration under real operation conditions,” Energy and Buildings, vol. 68, pp. 280–291, 2014. View at: Publisher Site | Google Scholar
- Y. Huang, J.-L. Niu, and T.-M. Chung, “Comprehensive analysis on thermal and daylighting performance of glazing and shading designs on office building envelope in cooling-dominant climates,” Applied Energy, vol. 134, pp. 215–228, 2014. View at: Publisher Site | Google Scholar
- K. Kapsis, V. Dermardiros, and A. K. Athienitis, “Daylight performance of perimeter office façades utilizing semi-transparent photovoltaic windows: a simulation study,” Energy Procedia, vol. 78, pp. 334–339, 2015. View at: Publisher Site | Google Scholar
- K. Kapsis and A. K. Athienitis, “Building integrated semi-transparent photovoltaics: energy and daylighting performance,” in Photonics North 2011, SPIE, Bellingham, USA, 2011. View at: Google Scholar
- Z. Li, L. Wang, and H. Zhang, “Research on the lighting environment using photovoltaic glass in office space—a case study in Tianjin,” China Illuminating Engineering Journal, vol. 1, pp. 23–28, 2015. View at: Google Scholar
- M. Abdelhakim, Y.-W. Lim, and M. Z. Kandar, “Optimum glazing configurations for visual performance in Algerian classrooms under mediterranean climate,” Journal of Daylighting, vol. 6, no. 1, pp. 11–22, 2019. View at: Publisher Site | Google Scholar
- G. Chinazzo, A. Legrain, G. Peronato, J. Wienold, and M. Andersen, “Energy performance and occupancy-based analysis of visual and thermal comfort for transmittance level and layout variations of semi-transparent photovoltaics,” in Proceedings of the 16th IBPSA International Conference and Exhibition, Rome, Italy, September 2019. View at: Publisher Site | Google Scholar
- Y. Sun, K. Shanks, H. Baig et al., “Integrated semi-transparent cadmium telluride photovoltaic glazing into windows: energy and daylight performance for different architecture designs,” Applied Energy, vol. 231, pp. 972–984, 2018. View at: Publisher Site | Google Scholar
- A. McNeil, E. S. Lee, and J. C. Jonsson, “Daylight performance of a microstructured prismatic window film in deep open plan offices,” Building and Environment, vol. 113, pp. 280–297, 2017. View at: Publisher Site | Google Scholar
- W. Zhang and L. Lu, “Overall energy assessment of semi-transparent photovoltaic insulated glass units for building integration under different climate conditions,” Renewable Energy, vol. 134, pp. 818–827, 2019. View at: Publisher Site | Google Scholar
- M. Abdelhakim, M. Z. Kandar, M. Zin Kandar, and Y.-W. Lim, “Experimental investigation of overall energy performance in Algerian office building integrated photovoltaic window under semi-arid climate,” Journal of Daylighting, vol. 6, no. 1, pp. 23–41, 2019. View at: Publisher Site | Google Scholar
- K. R. Wagiman, M. N. Abdullah, M. Y. Hassan, and N. H. M. Radzi, “A new optimal light sensor placement method of an indoor lighting control system for improving energy performance and visual comfort,” Journal of Building Engineering, vol. 30, Article ID 101295, 2020. View at: Publisher Site | Google Scholar
- C. Reinhart and P.-F. Breton, “Experimental validation of autodesk® 3ds max® design 2009 and daysim 3.0,” LEUKOS The Journal of the Illuminating Engineering Society of North America, vol. 6, pp. 7–35, 2009. View at: Publisher Site | Google Scholar
- A. F. Alajmi, F. Abaalkhail, and A. Alanezi, “Climate-based daylighting metrics assessment to select among optimum energy efficient windows’ shading devices solutions: a case study of an office in a hot climate,” in Proceedings of the 16th IBPSA International Conference and Exhibition, January 2019Rome, Italy. View at: Publisher Site | Google Scholar
- S. Nundy and A. Ghosh, “Thermal and visual comfort analysis of adaptive vacuum integrated switchable suspended particle device window for temperate climate,” Renewable Energy, vol. 156, pp. 1361–1372, 2020. View at: Publisher Site | Google Scholar
- Y. Sun, X. Liu, W. Qu, G. Cao, and N. Zou, “Analysis of daylight glare and optimal lighting design for comfortable office lighting,” Optik, vol. 206, Article ID 164291, 2020. View at: Publisher Site | Google Scholar