
Estonian Journal of Engineering, 2012, 18, 1, 3–11
Abstract
The paper shows that the residual stress at the surface of tempered glass panels may vary both locally (at a distance equal to the distance between the cooling jets) and globally, i.e., stresses near the edges and corners of the panels may be considerably different from the stresses in the middle part of the panels. That should be borne in mind while assessing the degree of temper by non-destructive measuring of the residual surface stress.
1. INTRODUCTION
According to the European Standard EN 12150-2:2004, to establish whether a product conforms to the definition of thermally toughened soda lime silicate safety glass, initial type testing shall consist of a) mechanical strength measurement in accordance with EN 12150-1 (also EN 1288-3:2000) and/or b) fragmentation test in accordance with EN 12150-1:2000. Thus European standards prescribe application of the four-point bending test and/or the fragmentation test. Both of these tests are destructive and time-consuming.
At the same time, during recent years photoelastic residual stress measurementmethods have been considerably developed and applied. In [1] data is described about testing of 360 glass panels by first measuring the residual surface stress with the GASP polariscope (GASP is registered trademark of Strainoptics Technologies, Inc.) [2]. Paper [1] shows that a good correlation exists between surface compressive stress data and mechanical strength according to EN 1288-3 (Fig. 1). Similar results have been obtained by several other authors [3–6].
In a somewhat simplified form the relationship between the bending strength sbs and surface stress ssf can be expressed as
![]()
where sa is the strength of the annealed float glass and k is an empirical coefficient (k ![]() 1). Since sa is known, measurement of the surface residual stress roughly determines the bending strength of the glass. Equation (1) does not take into account that the flaw population changes as a result of the strengthening process.
1). Since sa is known, measurement of the surface residual stress roughly determines the bending strength of the glass. Equation (1) does not take into account that the flaw population changes as a result of the strengthening process.
By assessing the degree of temper in glass panels via non-destructive residual stress measurement, one should bear in mind the following. Residual compressive stress at the surface of glass panels in the middle part of the panel is usually isotropic. It means that the compressive stress has the same value in all
the directions in the surface of the panel. However, near the borders and corners of the panel this is usually no longer the case and measurement results depend on the direction of the stress measurement. Since European standards demand stress measurement both in the centre as well as at the corners of the glass panels, that should be taken into account.
Another factor to be considered is possible local variation of the residual stress. Since in tempering furnaces the cooling of the panels is carried out by jets, the cooling of the surface of the panel is inhomogeneous. Due to this, the residual stress may vary at a distance commensurable with the distance between cooling jets. Let us mention that vibration of the jet grids leads to more uniform distribution of the tempering stress (see, e.g. [7], p. 135).

Fig. 1. Relationship between the surface compression and strength of clear float glass specimens (from [1], courtesy of GPD 2005).
Click to enlarge
UserFiles/fig1(4).jpg
The aim of this paper is to investigate how this global and local inhomogeneity of the tempering stress field may influence the measurement results.
2. MEASUREMENT APPARATUS
Scattered light polariscopes for residual stress measurement in glass have been developed by several authors [8,9]. However, these polariscopes are complicated devices, which can be used only in laboratory conditions and cannot be used in factory conditions near the production line.
For industrial applications, a portable scattered light polariscope, referred to as the SCALP, has been developed at GlasStress Ltd [6]. A schematic of the optical measurement arrangement and a photograph of the SCALP are shown in Fig. 2. A laser beam is passed through the panel at an angle of about 45°. Stress birefringence changes the polarisation of the laser beam. These changes are recorded by measuring the variation of the intensity of the scattered light along the laser beam with a CCD camera. From this measurement data the stress profile through the panel thickness is determined. Spatial resolution of the SCALP in the plane of the panel to be measured is about 0.5 mm; in the direction of the thickness of the panel it is about 20 μm.
The SCALP is calibrated using a four point bending test. Since it has no moving parts, no additional calibration is needed. The polariscope is automatic, and stress profile measurement time is about 3 s. However, to calculate the stresses, the value of the photoelastic constant is to be known.

Fig. 2. Optical measurement arrangement schematic (a) and photograph (b) of the portable scattered light polariscope SCALP.
Click to enlarge
UserFiles/fig2(3).jpg

Fig. 3. Principal stress profiles through the panel thickness at a point on the symmetry axis of a tempered glass panel of thickness 6 mm: (——) σ1 , ( - - - ) σ2 .
If the residual stress state is isotropic (σ1 =σ2 ) then measurement in one direction using the device is sufficient. If σ1 ≠σ2 , measurements in two perpendicular directions using the device, parallel to the principal stress directions, are needed. Figure 3 shows an example of principal stress profiles through the thickness of a tempered glass panel of thickness 6 mm. In the general case, measurements in three directions (0°, + 45°, – 45°) permit measurement of the principal stress directions and their profiles through the panel thickness.
3. LOCAL VARIATION OF THE TEMPERING STRESSES
Stress field in a tempered glass panel No. 1 of dimension 300 × 300 mm with thickness 5.5 mm was calculated and partly measured experimentally with the SCALP [10]. Calculations were made on the basis of a mathematical model, described in [11]. Figure 4 shows photoelastic fringe pattern in a circular polariscope. Inhomogeneity of the stress field is clearly visible.
Distribution of the calculated and measured stress σx in the mid-surface and upper surface of the plate are compared in Fig. 5. It should be mentioned that the very high stress gradient in the plane of the plate may have influenced the precision of the photoelastic measurements.

Fig. 4. Photoelastic fringe pattern of the panel No. 1.

Fig. 5. Distribution near the edge of σ x on the x axis in panel No. 1 (—— calculated, - - -measured).
Click to enlarge
UserFiles/fig5(3).jpg
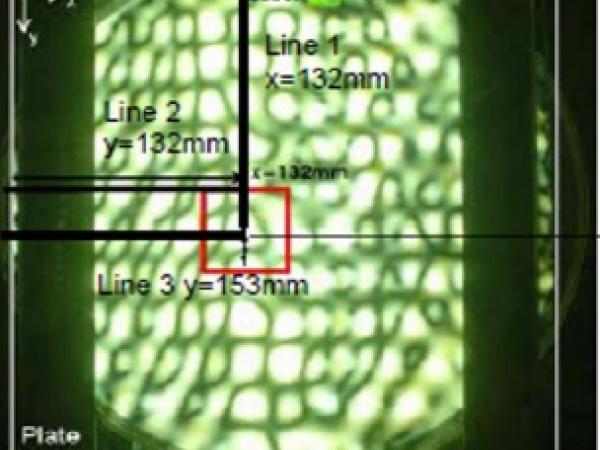
Figure 6 shows the fringe pattern of a part of a tempered glass panel No. 2 and variation of the stresses σx and σy along the scanned line.
It can be seen that in the middle part of the panel (at a distance from the edge more than 50 mm) the stresses are more or less isotropic, i.e., σx ![]() σy , while near the edge the stress components σx and σy differ considerably. Local variation of the stresses between x = 7 mm and x = 31mm is also distinct – being about 10 MPa at a distance of 10 mm.
σy , while near the edge the stress components σx and σy differ considerably. Local variation of the stresses between x = 7 mm and x = 31mm is also distinct – being about 10 MPa at a distance of 10 mm.

Fig. 6. Fringe pattern near the edge of the tempered glass panel No. 2 and distribution of the surface stresses σ x and σ y along the scanned line.
Click to enlarge
UserFiles/fig6(1).jpg

Fig. 7. Interference pattern in a circular polariscope of the central part of a sidelite.
Fig. 8. Directional variation of the surface stress at points #1 and #2 of the sidelite shown in Fig. 7.
Click to enlarge
UserFiles/fig7(1).jpg
Let us mention that if surface stress measurement is carried out with the SCALP, which measures stress variation along a laser beam, the local variation of the surface stress can be measured and the stress value is determined at the point where the laser beam enters the surface of the panel. In contrast, the GASP device gives an average value of the stresses for a small distance along the measurement direction.
Figure 7 shows the fringe pattern in a transmission polariscope of the middle part of a sidelite. Figure 8 depicts the surface stress ellipses for the points 1 and 2, the distance between which is 12 mm. It is seen that although the distance between the points 1 and 2 is very small, the surface stresses differ considerably.
4. GLOBAL VARIATION OF THE TEMPERING STRESSES
Besides the local variation of the tempering stresses in the scale of several centimetres, on glass panels the value and character of the residual stresses depends also on the location on the panel. In the middle part of the panels the residual stresses have mostly isotropic or close to the isotropic character, i.e. in all the directions the stresses have about the same value. Near the edges and corners the formation of the tempering stresses is influenced by inhomogeneous cooling conditions and therefore stresses in different directions may differ considerably. This is valid in general. However, local variation of stresses may considerably influence the situation.
Figure 9 shows geometry of a tempered glass panel of thickness 6 mm. According to European standards the surface residual stress should be measured at the centre and at the points A, B, C and E. Figure 10 depicts the surface stress ellipses at the central point and at the corner point A and E. It can be seen that, as expected, residual stress at the central point is rather homogeneous, with stresses in all directions being approximately equal.

Fig. 9. Geometry of a tempered glass panel. According to European standards the stresses are to be measured at the centre and at the four corners.
Fig. 10. Directional variation of the surface residual stress at the centre and at the points A and E.
Click to enlarge
UserFiles/fig8(1).jpg
At the corner points the stress ellipses have considerable eccentricity. It means that at these points stress measurement in an arbitrary direction is not sufficient. To obtain real values of the residual stresses, if measurements are carried out with the SCALP, the measurements should be carried out in three directions, at 0°, 45° and 90° to the coordinate axes. On the basis of these measurements the directions of the principal stresses and their values are automatically calculated.
5. CONCLUSIONS
It has been shown that residual stresses in tempered glass panels can be highly inhomogeneous. Both the local and global inhomogeneity has been investigated and demonstrated on several examples. General information about the inhomogeneity of the stresses can be obtained by observing the panel normal to its surface in a plane circular polariscope. Principle of the work of a scattered light polariscope, or SCALP, has been explained.
Using this device, both local and global inhomogeneity of the tempering stresses have been recorded in several cases. From the given examples it follows that while in the middle of the glass panels the tempering stress is usually isotropic and stress measurement in one direction may be sufficient, near the edges and corners that may not be the case and direction-dependent measurements should be carried out.
Due to possible local inhomogeneity of tempering stresses, to talk about the precise value of the residual stress at the panel surface has no sense. One may speak about a certain interval of the values of tempering stresses. This interval depends on the technology of tempering.
Since the local variation of the surface tempering stress may reach about 10 MPa or even more, the precision of the SCALP (several Mpa’s) is sufficient for non-destructive assessment of the strength of the panels.
ACKNOWLEDGEMENT
The authors are thankful to Dr. Jonathan Williams and to Dr. Jüri Josepson for helpful remarks.
REFERENCES
- Schiavonato, M., Mognato, E. and Redner, A. S. Stress measurement, fragmentation and mechanical strength. In Proc. International Conference “Glass Processing Days”. Tampere, Finland, 2005, 92–95.
- Faingold, J. M. Non-destructive instruments offer stress relief to glass fabricators to test for mechanical strength and impact resistance. Verre, 2005, No. 2, 66–69.
- Carré, H. and Daudeville, L. Analysis of residual stresses and of the load-bearing capacity of tempered glass plates. In Proc. 4th European Conference on Residual Stresses. Cluny en Bourgogne, 1996, 377–386.
- Dubru, M., Nugue, J.-C. and van Marcke de Lummen, G. Toughened glass: mechanical properties and EN 12600 behaviour. In Proc. International Conference “Glass Processing Days”. Tampere, Finland, 2005, 66–70.
- Rodichev, Y., Maslov, V., Netychuk, A. Bodunov, V. and Yevplov, Y. Bending strength and fracture of glass materials under the different loading conditions. In Proc. International Conference “Glass Performance Days”. Tampere, Finland, 2007, 615–618.
- Aben, H., Anton, J., Errapart, A., Hödemann, S., Kikas, J., Klaassen, H. and Lamp, M. On complete non-destructive residual stress measurement in architectural glass panels and automotive glazing. In Proc. International Conference “Glass Performance Days”. Tampere, Finland, 2009, 923–925.
- Aben, H. and Guillemet, C. Photoelasticity of Glass. Springer-Verlag, Berlin, Heidelberg, 1993.
- Weissmann, R. and Dürkop, D. A novel method for measuring stresses in flat glass. In Proc. XV International Congress on Glass. Leningrad, 1989, vol. 3b, 217–220.
- Hundhammer, I., Lenhart, A. and Pontesch, D. Stress measurement in transparent materials using scattered laser light. Glass Sci. Technol., 2002, 75, 236–242.
- Lochegnies, D., Romero, E., Anton, J., Errapart, A. and Aben, H. Measurement of complete residual stress fields in tempered glass plates. In Proc. International Conference “Glass Processing Days”. Tampere, Finland, 2005, 88–91.
- Romero, E., Lochegnies, D. and Duquennoy, M. Numerical modeling, experimental investigations and stress control for flat glass tempering. In Proc. International Conference “Glass Processing Days”. Tampere, Finland, 2001, 56–62.
AUTHORS:
Johan Anton (A), Andrei Errapartb (A), Mart Paemurru (A), Dominique Lochegnies (B), Siim Hödemann (C) and Hillar Aben (D)
(A) GlasStress Ltd, Akadeemia tee 21, 12618 Tallinn, Estonia; info@glasstress.com
(B) L.A.M.I.H UMR 8530 CNRS, Université de Valenciennes, Le Mont Houy, 59313 Valenciennes, France
(C) Institute of Physics, University of Tartu, Riia 142, 51014 Tartu, Estonia
(D) Institute of Cybernetics, Tallinn University of Technology, Akadeemia tee 21, 12618 Tallinn, Estonia
* This paper was first published in the Proceedings of the Conference “gpd”, Tampere, 2011, Glaston Finland OY, 2011, pp. 113–121.


