This paper was first presented at GPD 2023.
Link to the full GPD 2023 conference book: https://www.gpd.fi/GPD2023_proceedings_book/

Authors:
- Louis Dellieu, PhD, Eclat Digital, France
- Michael Elstner, AGC Glass Europe, Belgium
- Chloé Therreau, PhD, Eclat Digital, France
Abstract
Flatness tolerances of tempered glass are frequently discussed when large size glazing units are installed in high-rise buildings with strict criteria for the optical quality. Today, certain quality parameters are mentioned in the relevant product standards, but very often such criteria are not sufficient for architects and building owners or investors to reach the desired optical quality in terms of flatness. For projects, the agreed tolerances are very often verified by means of physical mock-ups. But to compare different levels of the flatness tolerances it is nearly impossible to supply glass samples with intentionally different levels of flatness tolerances. Here, software simulation tools can help to visualize the flatness tolerances through visual comparison. Furthermore, the number of mock- ups could perhaps be reduced, thus improving the CO2 footprint of this process. This paper describes how these visualization tools work and what are the basic differences between different techniques of this kind of software tool. Examples of different flatness levels are presented together with a description of the limits of this solution and its benefits.
Speaker presentation
Michael Elstner is the manager of the Technical Advisory Service at AGC Glass Europe. Prior to this he worked for nearly 20 years at AGC INTERPANE as the Head of Technical Consultancy Service and a Director of INTERPANE E & B. He is a member of the board in different associations including, ift Rosenheim e. V., Bundesverband Flachglas e. V. and also Gütegemeinschaft Flachglas e. V.. He is also member of different working groups and standard committees which address the uses and applications of glass for building. Louis Dellieu works for Eclat Digital, a software company specialized into optical simulations. After his PhD in physics, he joined AGC in 2017 as Glass Lamination Project Manager. After three years, he joined Eclat Digital as a business developer and has worked intensively on its application in the glass sector. He’s a member of the ASOM group (Alliance for Solar Mobility) and authors of several scientific publications.
After a PhD in particle physics, Chloe Therreau joined Eclat Digital in October 2020 as R&D engineer / Project Manager, developing new features for the software developed by Eclat digital and managing projects for international clients in fields as diverse as architecture, car design, phone screen and watch design, etc.
Introduction
Nowadays glass is used not only as an infilling element but also as a structural or a building envelope component. This means that glass has become a multifunctional technological building material for a wide range of applications. Depending on the application and the requirements, different glass types need to be used. The basic glass product is soda-lime silicate glass manufactured through the float glass process.
According to the standard EN 572, float glass is defined as “a flat, transparent, clear or tinted soda-lime silicate glass with parallel and polished faces, obtained by continuous casting and floatation on a metal bath.” It is characterised by a very good optical quality. It can be used to produce refined glass products such as coated glass, multi-pane insulating glass, thermally toughened and laminated safety glass as well as decorative glass. Each glass type has inherent properties such as the structural and thermal stress resistance. As mentioned above the choice of the one or the other glass type depends on the application and other requirements, for example, safety regulations. For high-rise buildings, thermally toughened glass is very often used as the outer pane due to its higher mechanical and thermal stress resistance compared with annealed float glass. Due to the manufacturing process, thermally toughened glass is not totally flat anymore. Assessing the extent of glass distortion is frequently under discussion for important projects and can be a very time consuming process.
Visualizing these glass distortions arising from specific treatments, for example, thermal toughening, is usually only possible once the glass has been processed and after installation on the facade. It may result in delays or other contractual or cost issues potentially impacting the smooth running of the project. Early identification and resolution of any visual distortion concerns help to guarantee the aesthetic quality of the building under construction.
An innovative countermeasure for tackling this problem is the use of so-called virtual prototyping. This approach aims at achieving predictive, quantitative and physical true images. It acts as a digital decision-making roadmap over the complete duration of the project, preventing the need of unnecessary physical mock-ups and enabling the project team to identify any potential optical issues at earlier stages.
This paper focuses on explaining the most common types of visual distortion from the glass production process and considers a virtual prototyping approach. The glass deformation data is used as input to the virtual prototyping software edited by Eclat Digital “Ocean™” and is based on standards and project related specifications. The following sections describe the theoretical framework of Ocean™ and related simulation results.
Basics about thermally toughened glass
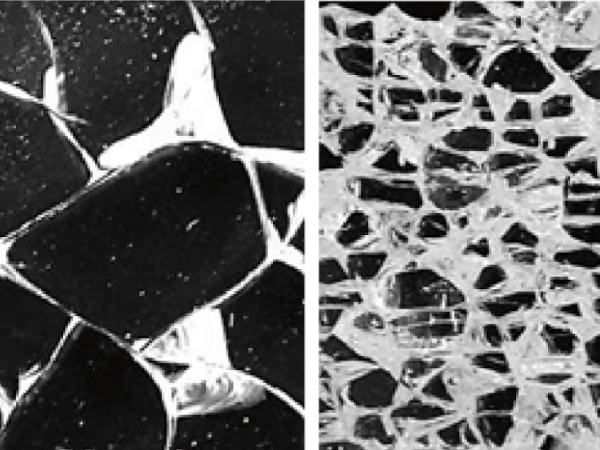
According EN 12150 “thermally toughened soda lime silicate safety glass or thermally toughened safety glass is a glass within which a permanent surface compressive stress, additionally to the basic mechanical strength, has been induced by a controlled heating and cooling process in order to give it greatly increased resistance to mechanical and thermal stress and prescribed fragmentation characteristics.”
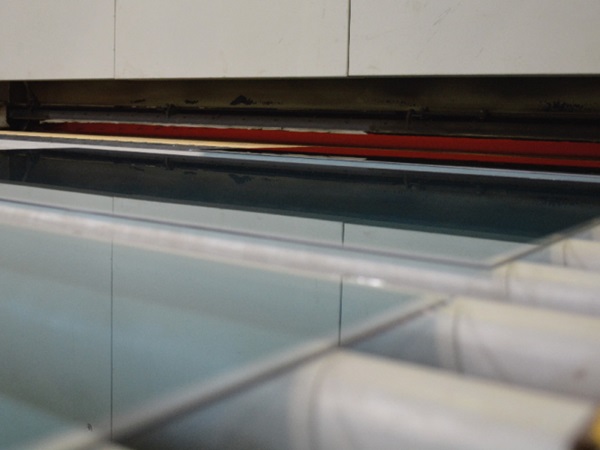
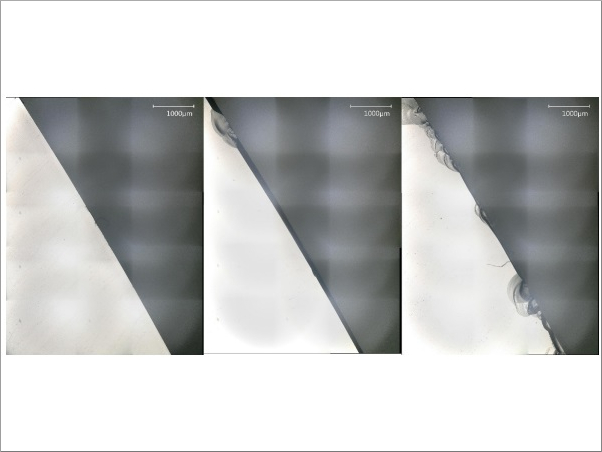
When annealed float glass is thermally toughened it is heated up to about 650 °C. During the thermal toughening process, which takes place in horizontal tempering furnaces, glass is transported on ceramic rollers in the furnace and on transport rollers which are wrapped with Kevlar helical strips in the quench. The glass, once heated, then softens due to the change in its viscosity. As the glass is transported on rollers throughout the entire process, the initially good flatness of the float glass is subsequently affected by the oscillation process over the ceramic rollers.
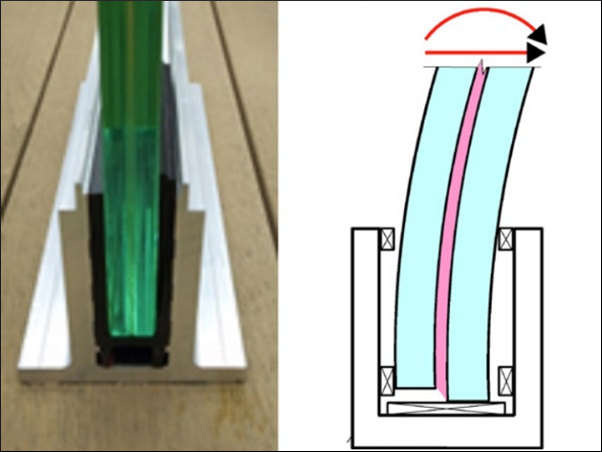
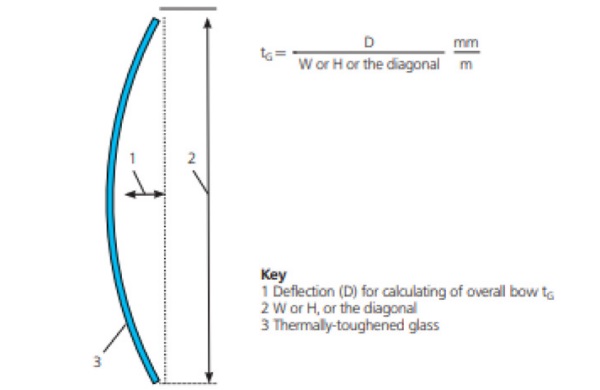
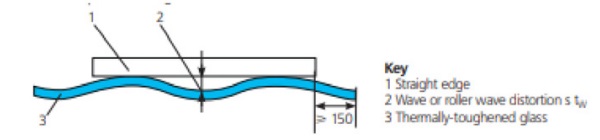
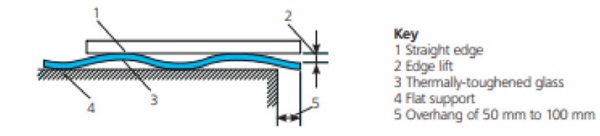
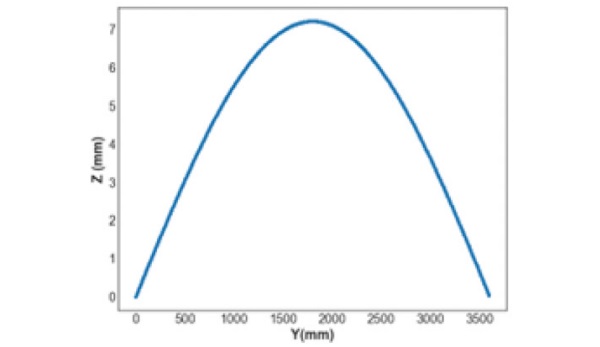
This condition is described in chapter 6.3 of EN 12150-1:2015 + A1:2019. “By the very nature of the toughening process, it is not possible to obtain a product as flat as annealed float glass. The difference in flatness depends on the type of glass, e. g. coated glass etc., glass dimensions, i. e. the nominal thickness, the dimensions and the ratio between the dimensions, and the toughening process employed.” These variables are also affecting the overall bow, which is an overall concave or convex deformation of the glass pane and the edge dip or edge lift. The edge lift or edge dip is a deformation at the front and back edge of the glass pane in the tempering furnace normally at edge distances up to around 150 mm to 200 mm. In summary, the process is affected by three typical sources of flatness distortion:
- Overall bow
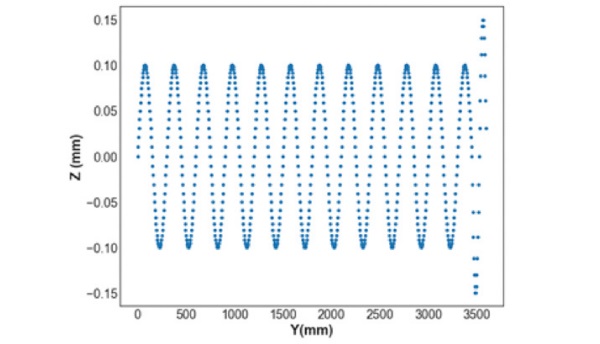
- Roller wave (distortion)
- Edge lift (edge dip)
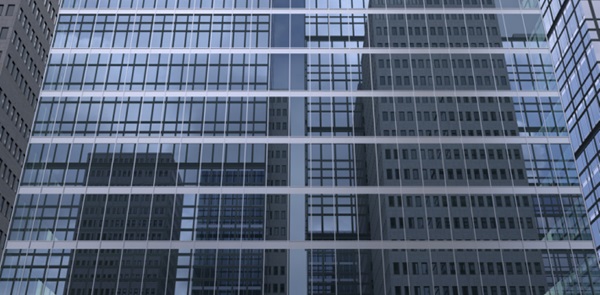
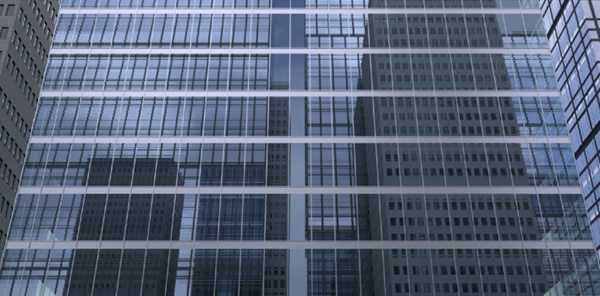
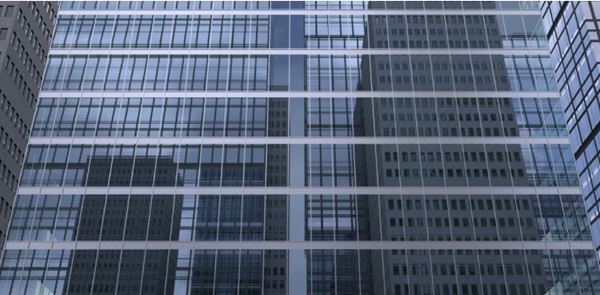
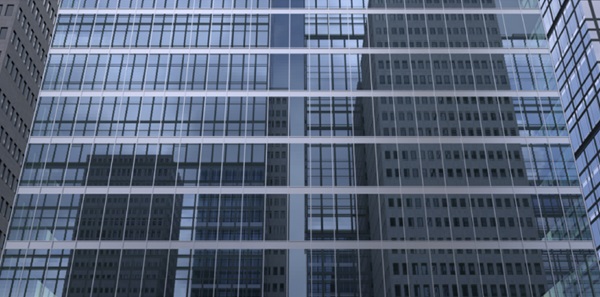
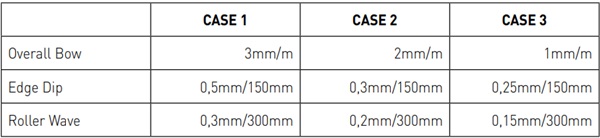
The tolerances for each distortion source are specified also in the mentioned standard. In case of high-specification projects, the referred tolerances are very often specified to tighter criteria than the those provided by the EN standard. Table 1 shows the values which have been used for the study described in this paper. In addition to the “standard” tolerances, the most typically specified tolerances have been analysed together with other representative tolerances which can be achieved in highly specialised productions.
Study approach
A 3D model of the building was developed, including an insulating glass unit with a size of 1.6 x 3.6 m (Fig. 5).
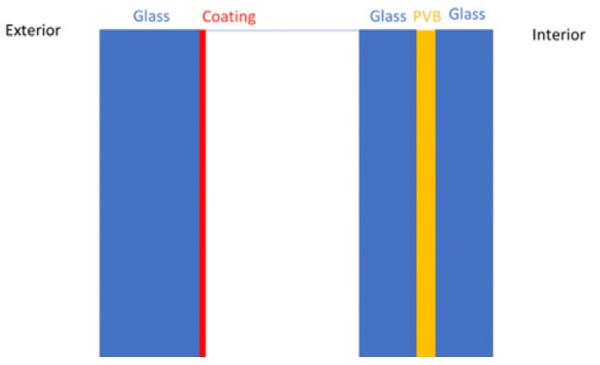
Within the study we have simulated a building with 15 floors. The façade is consists of a vision glazing and spandrel panels The vision glazing is an insulating glass unit (IGU)with the following glass configuration:
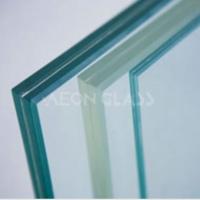
Outer pane: Stopray Vision 50 on Planibel Clearvision / Cavity 16 mm / 55.2 laminated glass with Planibel Clearlite and a PVB interlayer. The spandrel is made from brushed aluminium.The outer pane is a thermally toughened glass whereas the inner pane is annealed glass. The observer was ‘placed’ in several different positions. Firstly with a pedestrian view and a distance of 40 m and 50 m from the building with a viewing angle of 45 degree. We have analysed also a point of view which is closer to the building. 5 m distance an upper view. The weather conditions selected are a “cloudy” and a “sunny” day.
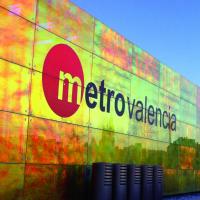
Exterior lighting contribution is expected to impact the global light distribution. In this study, a sunny day environment is considered, with a mean horizontal luminance of 1x10⁵ lux. Exterior environment objects (e.g. other buildings) are reflected on the studied building, allowing the visualization of the optical distortions. This environment is simulated with 3D objects in the scene.
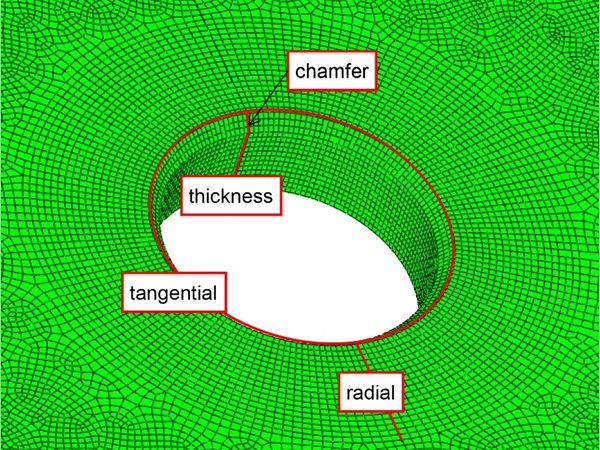
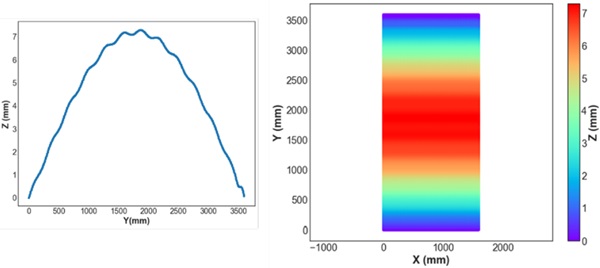
Three glass deformations are considered : overall bow, roller wave and edge dip. The deformations are defined as shown in figures 1 (overall bow), 2 (roller wave) and 3 (edge dip). The value of each deformation is defined in table 1.
As an example, the resulting deformation for the CASE 2 values on a glass of 1.6m x 3.6m is shown in figures 6 to 8. In those figures, Z is defined as the “height” of the deformation, Y is defined as the length of the glass and X as the width. This deformation is used and applied as deformation map (“height” map) in OceanTM.
Theoretical framework
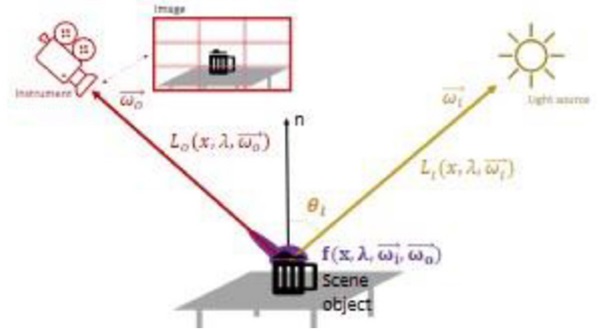
The virtual prototyping software used in this study is Ocean™, a ray-tracing tool used for physically-based rendering. The algorithm consists in extending rays into a scene and bouncing them off surfaces and towards light sources for computing pixel information (see figure 1). Governed by geometrical optics, it uses a stochastic Monte-Carlo approach for generating and sampling light paths. These latter can be launched from a sensor object (instrument) and, optionally, also from the light source (bidirectional ray-tracing, see figure 9).
A research algorithm is then applied on each generated ray: If a ray from the instrument is found to cross the light source (or if rays from the instrument and the light source are crossing in scene in case of bidirectional raytracing) then, the light path across the scene is considered to contribute to the pixel.
The light path is determined by solving the well-known light transport equation (LTE), given in equation 1 [REF]. It describes the equilibrium distribution of radiance in a scene. It gives the total reflected radiance Lo at a point x in the direction (ω→₀) on a surface in terms of the surface emission Le , its bidirectional scattering distribution function (BSDF) f, and the distribution of incident illumination Li arriving at the point x from the direction (ω→₀), with a given angle θi (see figure 9).
BSDF can be decomposed as the sum of the bidirectional reflectance distribution function (BRDF) and the bidirectional transmittance distribution function (BTDF). It can be seen from Eq. 1 that this element integrates a spectral dependency λ. While the majority of the rendering software considered integrated quantities over the visible solar spectrum or a limited number of sub-bands (e.g. RGB), Ocean™ gives a full spectral calculation from near ultra-violet to near infra-red. This specificity enables the spectral description of materials or the customisation of instrument response function, allowing a wide range of simulations and quantifications (such as non-visual effect of human circadian rhythm, complex material (e.g. glazing) effect on colour perception or light pollution, etc...) [REF] Objects in a scene can be described from both a surface or a volume perspective. Surface descriptions concerns opaque materials (e.g. metal or painting) and are computed in terms of BSDF. Volume description concerns transparent/translucent materials (e.g. plastic or glass) and computation includes effects such as light absorption, refraction at interface or volume scattering (for example Mie or Rayleigh scattering).

Light source can be defined as an object in the scene with emission properties (with a custom emission spectrum, theoretical or measured) or as an infinitely distant light source, called an environment. Environments are either theoretical or captured - environment map. Environment maps have a fixed sun position and allow modelling complex light conditions (complex weather, specific horizon, indoor environment etc..). Theoretical environments allow the simulation of sky light, with different sun positions, atmosphere turbidities and different wavelength spectra. Several models are available, such as a Direct sun (including the sun position, the air mass and the direct normal irradiance), Perez sky environment [REF] or Hosek-Wilkie sky environment [8], etc...
Integrating all the above mentioned features, ray tracer software allow rendering accurate and photo-realistic images of the scene and enables a large range of spectrophotometric measurements such as colorimetry assessment, energy quantification or transmittance and reflectance measurement including BSDF function determination. Ocean™ has obtained an independent validation that assessed the accuracy of lighting computer programs according to CIE 171:2006. This validation was provided by the Ecole Nationale des Travaux Publics de l’Etat (ENTPE) in 2014 [REF].
Results
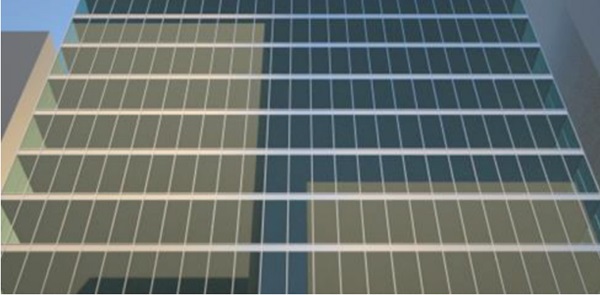
The following images should give a first visual impression for one point of view and for a cloudy day only. Within the simulation we have not considered the deformation due to climatic loads.
Conclusion
Virtual prototyping can really help to refine, improve and speed up the mock- up process for projects of any scale. A virtual prototyping study of a project’s requirements at early design stage can reduce the amount of glass samples required, saving precious time and resources, evermore important as the built environment rises to meet its Sustainability challenges.