Authors: Angelica Rota, Marco Zaccaria and Francesco Fiorito
Source: Glass Struct Eng 8, 235–254 (2023)
DOI: https://doi.org/10.1007/s40940-023-00233-0
Abstract
Architectural flat glass typically follows a linear life cycle. Its recyclability potential is not yet fully exploited due to the challenges of collecting it as well as the issues in quality compatibility with a float furnace. While the challenges of recycling glass remain, there might be the opportunity to do even more than recycling: reuse. A robust reuse practice calls for a qualification of the properties and performances by means of a quality protocol as well as the identification of the new use. This study explored the prospect of reusing post-consumer architectural flat glass panes for remanufacturing in insulating glass units. A set of IGUs harvested from residential buildings in Belgium was disassembled manually in the laboratory and the collected glass panes were classified in different quality levels as a function of the size and density of surface defects. The influence of the lifespan of the insulating glass as well as the face of the insulating glass unit was also considered. Through this study, it was found that post-consumer glass with high surface quality can exhibit similar strength values of pre-consumer glass. This suggest that it would be possible to reuse post-consumer glass in a safe and valid manner.
1 Closing the loop of the flat glass life-cycle
1.1 From manufacturing to re-manufacturing
Flat glass is produced by the float process, which is classified as an energy intensive industry: 1.2 kg of raw materials produce 1 kg of glass and the corresponding GWP is 1.13 kg CO2-eq due to the manufacturing process, raw material supply and energy consumption (AGC Glass Europe 2018b). Glass manufacturers have reduced the emissions related to glass manufacturing by almost 70% in the last 50 years by means of incremental improvements in combustion and process emission (Glass Alliance Europe 2019). Furthermore, glass companies set an ambitious road-map to reach the target of carbon neutrality in 2050 (Glass for Europe 2020). In this road-map there is a first target to reach 30% reduction of carbon emissions, versus the 2019 reference, by 2030. This goal will be tackled by a holistic approach with a strong focus on recycling.
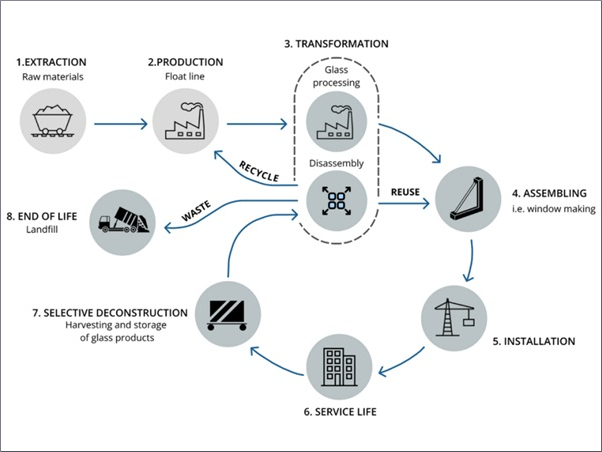
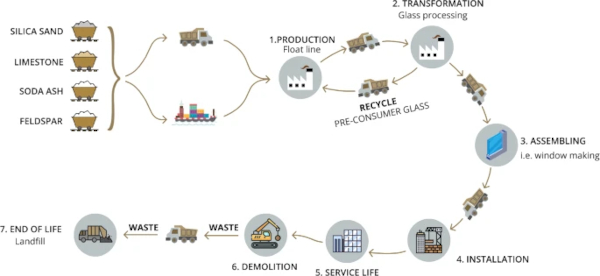
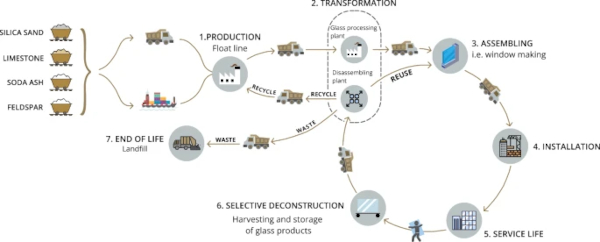
As of today, the life cycle of glass is linear (Fig. 1), for two main reasons (DeBrincat and Babic 2019; Hartwell et al. 2022). Firstly, the post-consumer glass is characterized by inter-connection between glass and other materials (i.e. silicone, butyl, spacer for the case of insulating glazing). These contaminations compel the glass waste to be treated (i.e., crushing and handling) (AGC Glass Europe 2018a) prior to be reintroduced into the float melting tank, but these treatments require time and resources. The second main reason is that the repatriation chain from the consumer to the float plant is deemed to be more expensive and complex than landfill (Geboes et al. 2022).
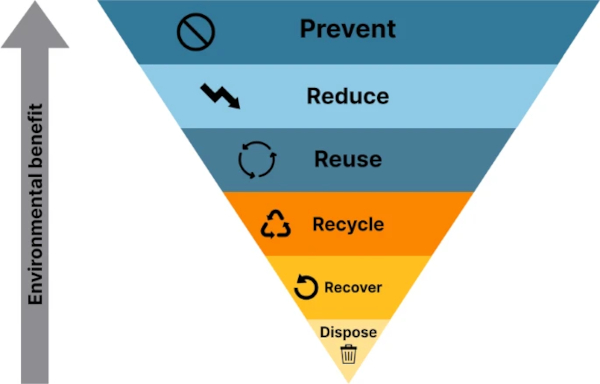
Allwood and Cullen (2012) emphasized urgent actions related to reducing material needed to fight global warming and the importance of prioritizing the most impacting. In this context, the waste hierarchy triangle (Fig. 2) would suggest to prioritize reuse over recycling. This is justified by the fact that the glass would not need re-melting (Hartwell et al. 2022). The word reuse, by definition, means reusing as it is. For example, reusing an insulating glass unit (IGU) means dismounting it from a location and reinstalling it to another, but this operation makes sense only if weighted against its remaining service-life. Besides problems of warranty would arise with the direct reuse of the IGU. The disassembling of a glazing product though, would enable the reuse of its components for manufacturing new glazing products. This practice is defined as ‘re-manufacturing’ (European commission 2020) involving disassembling followed by manufacturing process. Disassembling an IGU is not an easy and fast process since this product was not originally designed to be disassembled. In addition, harvesting and collection operations would face similar challenges as those mentioned before for post-consumer glass recycling. However, the following initiatives can contribute significantly to the shift in that direction:
- Policymakers are implementing mandatory limits of embodied carbon (EC) for buildings, whereby reused materials are strongly encouraged, for example, by having no EC impact (RE2020).
- Companies are exploring pioneering solutions to disassemble glazing products, even if not originally conceived for being disassembled, so that the material components can be reused (Glass on Web 2023).
- Companies involved with demolition or material waste are setting-up dedicated working group to convert the waste into resources.
As urgent actions are on the way to be tackled, circular practices, such as design for disassembling (DfD), Lambert and Gupta (2004) ought to become standard practice, especially in the highly energy intensive construction sector. Fairly recent research projects explore the possibility of applying DfD to the IGU (Mohamed 2020; Rota 2022).
In order to enable the reuse of materials it is essential that the re-manufactured products comply with a set of performances and warranties, with the target being same as new.
1.2 Manufacturing insulating glass units using post-consumer glass panes
Insulating glass units (IGU) are the most common architectural glazing product. They are not originally designed for disassembly, but to some degree it is possible to break them apart for reusing at least part of its components. Let us consider the case-study of insulating double glazing to explore how the disassembly should be undertaken and how the components can be qualified for reuse. The approach could be extended to the wide, yet finite, variety of commercially available glazing products. In the hypothesis of disassembling IGUs with the purpose of reusing the constituting glass panel, the life-cycle shown in Fig. 1 would become circular (Fig. 3). The assumption shown in Fig. 3 is that the disassembling facility would be integrated within an IGU processing plant. This is strategic for the following points:
- The processing plants are closer to the end-user than float plants: this would therefore minimize the transport between the site and the factory.
- The coexistence of disassembling and processing plant on the same site would facilitate the remanufacturing process of the recovered post-consumer glass and the transportation would be avoided.
- All the glass that does not qualify for reuse but qualifies for recycling could be transported back to the float plant on the return journey of the fleet delivering new glass to the processing plant.
Harvesting the glass does not systematically mean reuse: to be more specific, Fig. 4 shows all the decisions to make when considering reuse. The decisions arise with the following questions:
- Is it worth collecting? This would depend on building features, such as the size of the site (i.e. how many glazing to collect) vs the distance from the disassembling facility and the ease of dismounting from the building (i.e., the collection can be done by hand or is required a machine?);
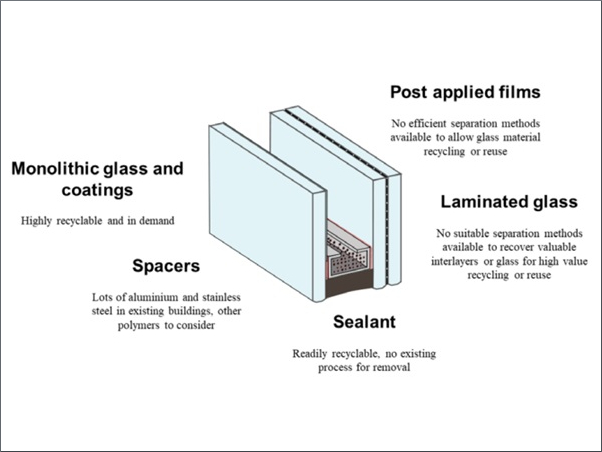
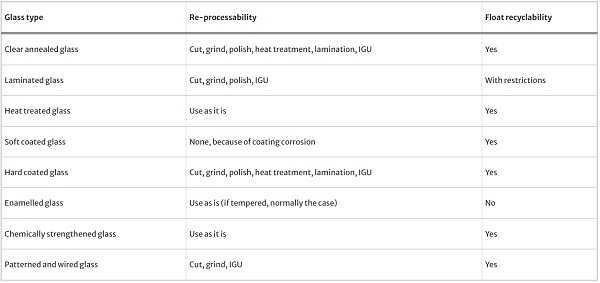
- Is the type of glass reusable? An extensive, but not exhaustive list of the glass types commonly constituting IGUs is reported in Table 1, along with an assessment of their respective re-processability and float recyclability potential.
- Is the glass pane of good enough quality for reuse? To reprocess a recovered glass panel into a new product it is necessary to know its performances and the specifications of its new application. That is, to set-up a quality protocol.
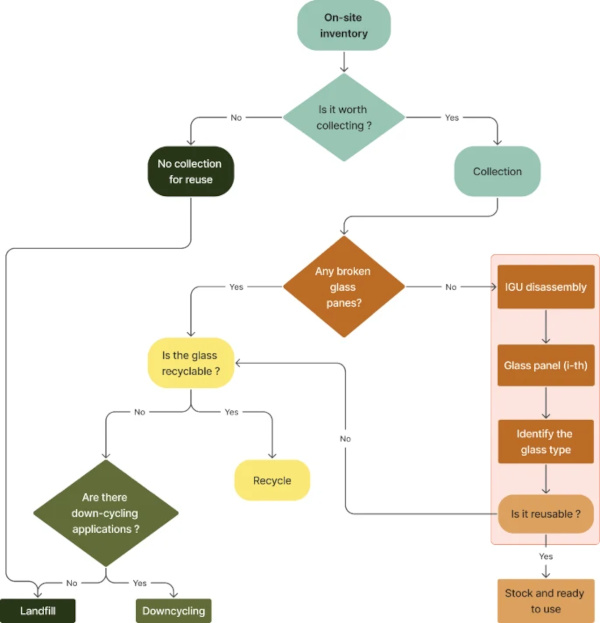
Table 1 Re-manufacturability and recyclability of IGU glass panes - Full size table
The scope of this study is drafting a quality protocol for clear annealed glass reuse. The approach used for clear annealed glass could be extended or tailored to the other glass types as well, but will not be subject of this paper. After performing the quality protocol, the glass panes classified as good enough could be used to remanufacture a new IGU. In this case, it ought to be considered that the panes would be 1 new float coated glass and 1 post-consumer panel. A panel of new coated glass is needed to provide the IGU with thermal insulation or solar protection property. The flowchart in Fig. 5 can be used to determine how many post-consumer glass panes can be used for IGU re-manufacturing in the general case. In the flowchart of Fig. 4 is also highlighted which part of this workflow will be the focus of the present study.
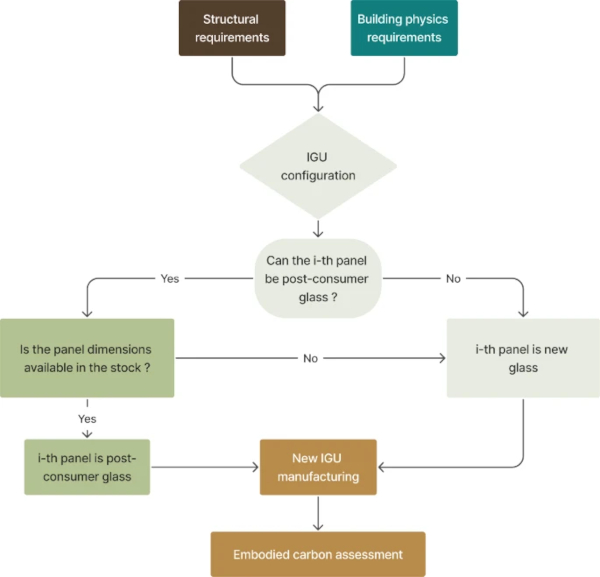
Along with the technical feasibility of the IGU remanufacturing is important to evaluate the environmental benefits associated with this practice. A life cycle assessment of the IGU built with a post-consumer glass panel is needed to have a measure of the embodied carbon emissions (Fig. 5).
1.3 Environmental impact of re-manufacturing
Reusing glass does not involve melting, it is therefore intuitive that there is an environmental benefit in reusing, but how large is the benefit? The assessment of the embodied carbon of a product is responsibility of the manufacturer (EN 15804+A1 2019) and is made by means of the Environmental Product Declarations (EPD). EPDs quantify the environmental impact for every stage of the life-cycle of a construction’s product in terms of Global Warming Potential (GWP), expressed in amount of CO2 emitted for kg of functional unit (FU). As remanufacturing is not yet a commercially available product there are not EPDs, but it is possible to list the parameters that would affect the GWP, namely:
- Transport the distance between the service site and the disassembling factory.
- Process the energy needed for disassembling and remanufacturing.
- Yield the amount of glass panes that can be re-used following each disassembling process.
- Cascading yield the amount of glass not eligible for remanufacturing which is then recycled, downcycled or landfilled.
- Bi-products contribution what would be the end of life chain of the secondary products, such as spacer, sealant, desiccant?
A theoretical, yet interesting perspective could be that the environmental benefits of re-manufacturing would be meaningful when the scale of it would be such to allow to turn-off a float plant without affecting the glass market needs.
1.4 Qualify post-consumer glass
New glass undergoes a quality control upon production, following the EN 572-1 + A1 (2016) product standard that defines the accepted threshold in terms of density of spot-like and scratch-like defects. The density of defects mentioned above represents the number and size of defects which can be found in the glass final cut size. Manufacturing, handling, transportation and service-life do surely generate additional dotted and linear defects on the glass (Luible et al. 2008) and as a result, post-consumer glass is unlikely to match the same nearly-pristine quality of new glass. Most of these additional defects are difficult to spot by the human eye, but yet they affect glass strength. This was confirmed by Zammit and Overend (2009) who showed that naturally aged glass (used ~ 40 years as infill panel) is substantially weaker than new glass.
In their study they also showed how the face exposed to weathering is more damaged than the face exposed to the interior by means of microscopy. Also, Datsiou and Overend (2017) confirmed the decrease in strength of aged glass, adding an indirect quantification of the glass surface damage by comparing naturally aged glass vs artificially aged glass (Datsiou and Overend 2017). Rodichev and Veer (2010) aimed at relating the flaw size with the glass strength, but in their study they could measure the flaw only after the destructive test. The weathering action could be different for each type of glass, i.e., annealed and tempered glass. Afolabi et al. (2016) tested a fully tempered glass with a 20 years of service life, demonstrating that the failure loads is 150% larger than the load resistance calculated using ASTM E1300-12a (2012).
Ideally, a quality control for post-consumer glass ought to qualify the glass surface with a level of detail that would allow to predict the strength, but, how to measure the depth of all surface flaws (or alternatively to identify and measure the critical flaw) of a given glass panel in a precise and fast way? Recently, Sofokleous (2022) combined an optical profilometer with a digital microscope to measure the flaw depth of glass, followed by coaxial double ring (CDR) testing. It was found that the technique is effective for measuring the flaw depth, but the size of the equipment and the time needed to analyze the data fits to lab scale only. Recently, Nategh et al. (2021) fine-tuned a technique to artificially generate flaws on glass of controlled size that could help to better predict the glass strength when the surface is qualified. Most of the float production lines as well as double glazing lines are equipped with a scanner, that can detect spot-like and scratch-like defects on the glass surface, but the depth of these defects cannot be measured.
This control is purely visual, but fast and non-destructive. Perhaps the scanners could be adapted to serve the purpose of qualifying post-consumer glass: the quantitative information might be used to classify the surface according to pre-defined quality levels (QL), that is the density and size of spot-like and scratch-like defects. For example, the reference quality level could be the acceptance criteria for cut-size float glass, according to the EN 572-8 + A1 (2016). By defining different QL, it is expected that, for a sample population large enough, the higher the QL, the higher the strength and vice-versa. The scope of this paper is to investigate the strength of post-consumer glass based on a predefined categorized surface quality. The classification in terms of QL proposed by the authors is based on the EN 572-8 + A1 qualification criteria. The outcome of the study will answer:
- Can post-consumer glass be safely reused?
- Is the QL classification effective in qualifying the glass surface?
2 Method
In this study, the mechanical performance of post-consumer glass classified by surface quality was evaluated. Forty three IGUs of random size were carefully collected in Belgium from residential building wherein glazing replacement took place. The units were carefully collected by a company experienced in the domain of window replacement. The year of production of the IGUs could be identified by markings on the spacer bar: the IGUs in the lot dated 1980, 1990, 1991, 1993, leading to a 28 to 41 years of service-life span. After collection, the following steps were undertaken:
- Disassembling.
- Sorting by glass type and surface qualification.
- Sampling.
- Testing.
2.1 Disassembly
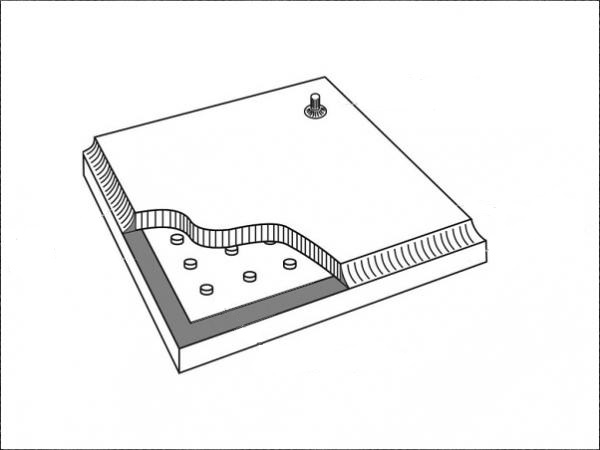
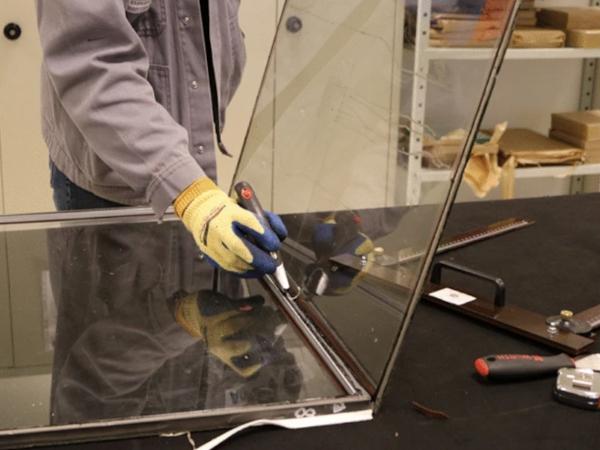
IGUs are not designed for being disassembly. However, cutting through the sealant to collect the desiccant and measuring the relative water content is a standard practice complying with the water permeation test (EN 1279-2 2018). Hence this method was used to manually disassemble the IGU in the laboratory. More specifically:
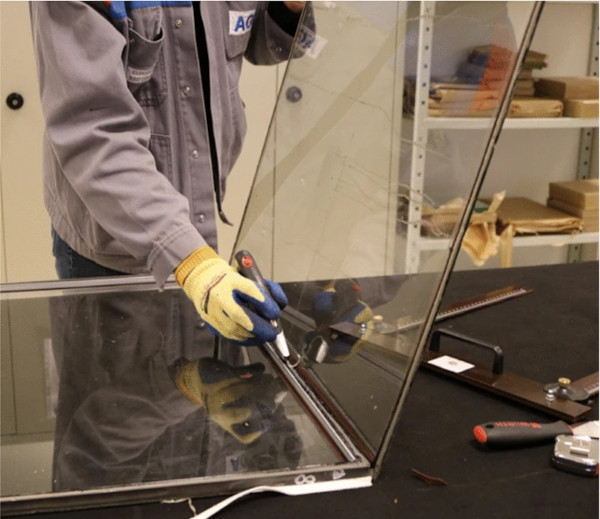
- Cutting the IGU was cut perimetrically with a utility knife in the interface between the sealants and the glass panels (Fig. 6);
- Components separation the two panels of glass, the spacer and the loose part of the sealants were separated. All the operation was done by hand with the use of a utility knife. The spacer and the sealant were disposed of, whilst the glass was kept;
- Edge trimming the primary and secondary sealant of the IGU could not be fully removed, hence it was chosen to trim perimetrically about 3 cm from the glass edges. A diamond glass cutter and a square were used to make the edge cutting;
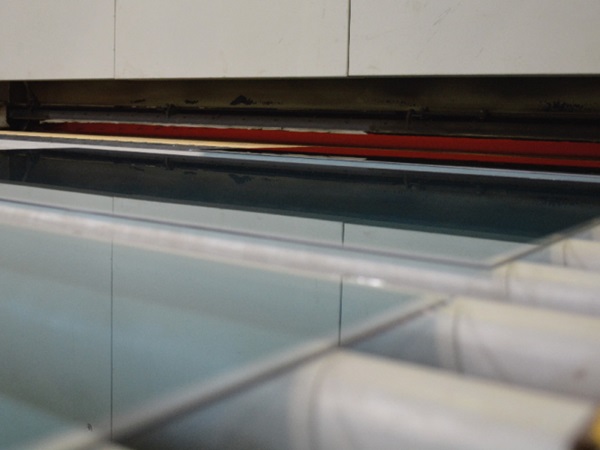
- Glass cleaning washing was performed with an industrial washing machine using solely water-jet power and no brush. Dirt was still present after the washing machine, therefore, further manual cleaning was done involving lint-free cloth, as well as an abrasive sponge for the heaviest dirt;
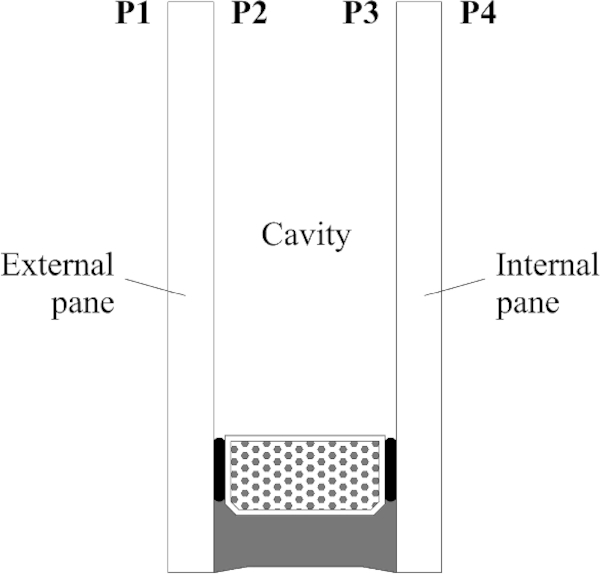
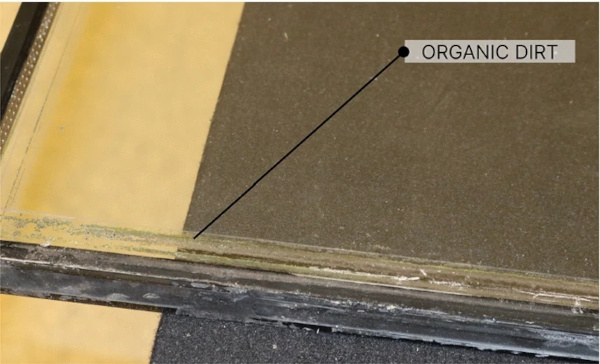
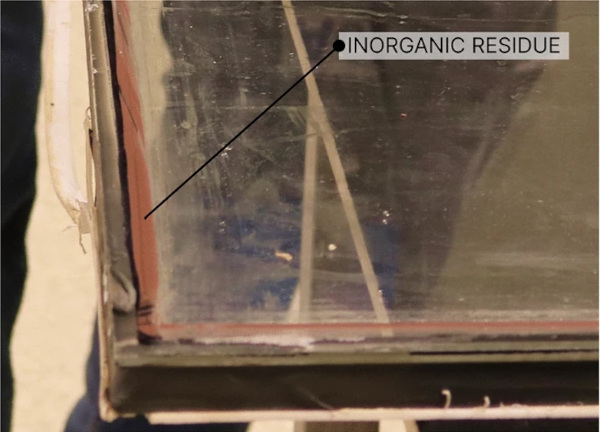
- Identification of the internal/external panel of the IGU the classification of the panels former position (Fig. 7) was assessed by the presence of one or multiple of the following elements, based on the work of Zammit and Overend (2010) and established design and installation practices of IGUs, notably:
- Organic dirt (Fig. 8) and inorganic residue (Fig. 9)
- Coating on P3 (Fig. 7);
- Laminated glass as outer panel.
Nevertheless, when possible, direct labelling to indicate the orientation during harvesting should be endorsed.
2.2 Sorting by glass type and surface qualification
The disassembled glass panes were visually inspected and classified by type of glass. A polariscope was used to identify heat strengthened glass, although such a glass ought to come with a stamp indicating its compliance with the relevant product standard (i.e. EN 12150 2015 or equivalent). All glass panes were 4 mm of thickness. Following, the optical quality was assessed for all (and solely) the annealed clear glass panels. This was done by means of an industrial commercially available scanner fitted on a manufacturing IGU line. The scanner works in transmission only and features a camera with a maximum 400 dpi of resolution and a 16bit technology (Softsolution GmbH n.d.). The transmission technology means that the image collecting the defects is the superposition of the two faces of the glass pane. In other words, it is not possible to distinguish on which face of the glass panel a specific defect is.
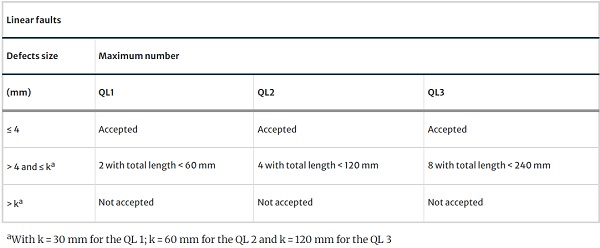
The density and size of spot-like and scratch-like defects was recorded. These metrics allowed to classify the glass surface quality according to an in-house classification method summarized in Tables 2 and 3 for spot flaws and linear faults, respectively. The size and number of defects allowed in the QL1 is actually equal to the acceptance level established by the standard EN 572-8 + A1 (2016) for the cut sizes of the clear annealed glass. All glass panes that would not even classify for QL3 or of a glass type that does not qualify for reuse (i.e., coated glass or glass with non-removable visive obstruction, such as corrosion) was not scanned and labelled as unqualified.
Table 2 Specs of quality level for the spot defects - Full size table
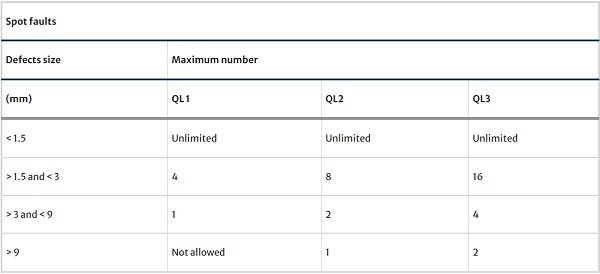
Table 3 Specs of quality level for the linear scratches - Full size table
2.3 Sampling
Sampling was made so that the surface glass quality, which provides metrics of the existing flaws on glass, could be put in relationship with the characteristic bending stress of the glass, which is function of the existing flaws on glass. This means that the specimens constituting a series were cut-off from the same glass panel in the quantity of about 30 to allow a meaningful statistical analysis. This posed the restriction of keeping the sample size as small as possible. Only occasionally the series were made of specimens coming from different panels. In those cases, the specimens were sourced by no more than 2 glass panes featuring homogeneous quality level. The year of production as well as the position in the IGU were also investigated as influencing parameters.
2.4 Testing method
The focus of the test is to determine the characteristic bending strength of glass surface, which calls for the coaxial double ring test (CDR). The CDR is regulated by the ISO 1288-1 (2016) or by the ASTM C1499 (2003). The EN 1288-02 (2000) defines a standard sample size of 1000 mm × 1000 mm to be tested with loading and supporting ring diameter measuring 300 mm and 400 mm, respectively. Using such a large sample size when testing post-consumer glass panels is not ideal, especially if the aim is to source the maximum number of samples from the same panel. Anyway, these dimensions represents the reference size to determine the nominal characteristic bending stress. The ASTM C1499-03 (2003) give the freedom to choose the sample size, as long as they fit within specific limits. These limits are such to ensure that the shear stresses remain negligible vs axial stresses arising from the bending moment.
Therefore, the ASTM approach was chosen, yielding to the following ring size combinations: 20 mm/80 mm, 40 mm/80 mm and 80 mm/150 mm in diameter of loading ring/supporting ring, respectively. A complete summary of the series including the sample’s size is reported in Table 4. In this table, the series are sorted by quality levels and information such as the year of production and the tested face are reported. In the test campaign are included also few series derived from unqualified glass panels (the panels which didn’t fit into any QL after the scanning) (Table 4), with the idea of associating a lower bound of performances to this category.
Not enough glass were classified in the QL2 to create a testing series. In addition to annealed clear glass, also the thermal tempered glass was tested. The tempering process was done for two series of new and post-consumer glass to assess the thermal healing benefit for post-consumer glass (Zaccaria and Overend 2016). The series number 1 is a batch of pre-consumer glass which qualifies as QL 1 and it is considered as a reference for comparing thermally tempered glass performance. The thermal tempering was performed on a pilot tempering line: no surface residual stress was measured, but it can be assumed the same value for all the glasses, as the same settings were used throughout.
Table 4 Summary of the tested series - Full size table

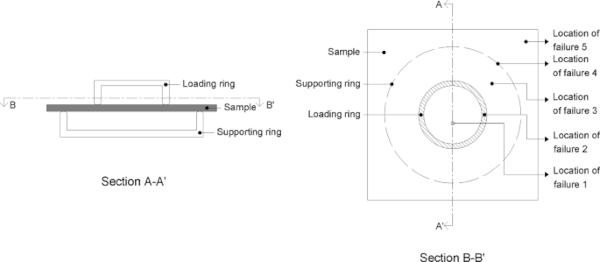
All the glass specimens were tested using an electromechanical testing machine with a 30-kN load cell. The load was applied at a constant stress-rate of 2 MPa/s. The conversion between the applied stress rate and the units (force/time) used by the machine to control the displacement rate was done in compliance with the Kirchhoff–Love plate theory. Silicone rubber was placed between the supporting ring and the glass specimens to avoid any stress concentration in the glass. To hold the fragments together after the breakage and allow to locate the fracture origin, a self-adhesive film was applied to the side of the specimens undergoing compression. A statistical analysis was conducted using only the data gained from the tested specimens with a fracture origin within the perimeter of the loading ring (location of failure 1 and 2 in Fig. 10). That is because in this area the stress is uniformly at its maximum value.
The specimens with a fracture origin between the rings or above the supporting ring (location of failure 3 and 4) could not be considered for data analysis. A large amount of failure type 3 or 4 in the same series might be an indication that the loading ring size is not big enough to embed the full representation of the random flaws of the panel. This issue could be by-passed by increasing the loading ring size (and consequently the sample size), but this would clash with the need of sourcing all the samples from the same panel. Specimens with a fracture origin in correspondence of the glass edge (location of failure 5) were also not included for the data analysis. However, the tested specimens with this type of failure didn’t provide any evidence of critical flaws being excluded. This because the edge-defect originating fracture was probably made while cutting the panel into the specimen’s dimensions and was not due to the glass being post-consumer.
The flaws of the series undergoing thermal tempering were inspected with a microscope before and after thermal tempering in order to track the evolution of the thermally induced flaws.
3 Results
3.1 Surface quality classification
The glass panels constituting the disassembled IGUs are distributed among the following glass types:
- Annealed clear glass: 79%;
- Annealed coated glass: 12%;
- Laminated glass: 9%.
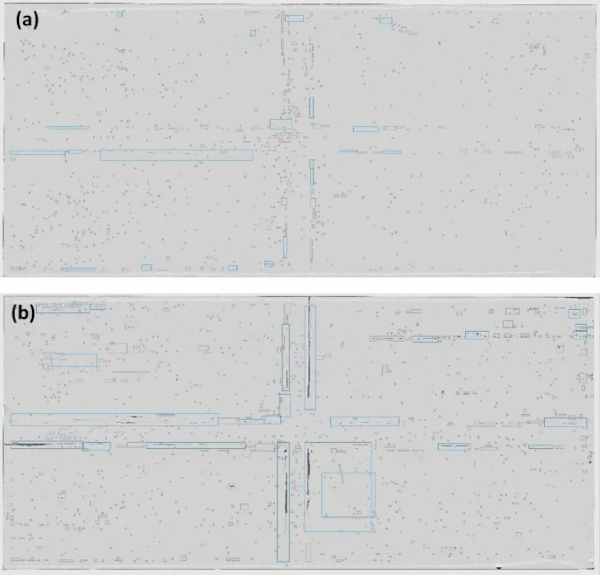
As the focus of this study is annealed clear glass, only this glass type was subjected to the scanner inspection and surface quality classification. The scanner allowed to classify the surface quality according to Tables 2 and 3. The share by quality level is shown in Fig. 11. By comparing the scanned images of the exterior panel versus the interior panel of the same IGU it was systematically observed that the external panel (Fig. 12a) has higher density of damage than the interior panel (Fig. 12b). This output seems to be an upscaling of lab-based microscopy on weathered glass described by Zammit and Overend (2010) and Sofokleous (2022).
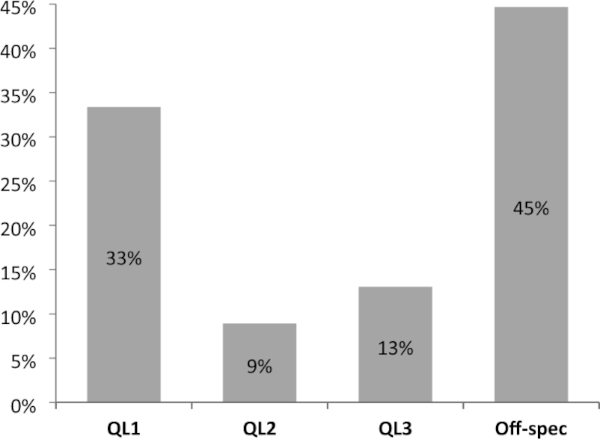
The results of the surface quality classification show that 33% of the total inspected glass falls in the QL1 category, whilst only 9% and 13% were classified in QL2 and QL3, respectively. Most of the scanned glass ends up in the unqualified category, accounting for 45% of the total inspected glass.
3.2 Fracture strength
The failure load obtained from the CDR test for each specimen was converted to failure stress using the Kirchhoff–Love plate theory. The equation used to calculate the tensile strength inside the loading ring is the following:

where F is the load at failure (N), h is the average of two thickness measurements taken from the specimen (mm), ν is the Poisson ratio, ϕS is diameter of the support ring (mm), ϕL is the diameter of the loading ring (mm), ϕ is the diameter of a circle (mm), which expresses the characteristic size of a plate and it is calculated as follows:

where l is the length of the side of the square specimens (mm).
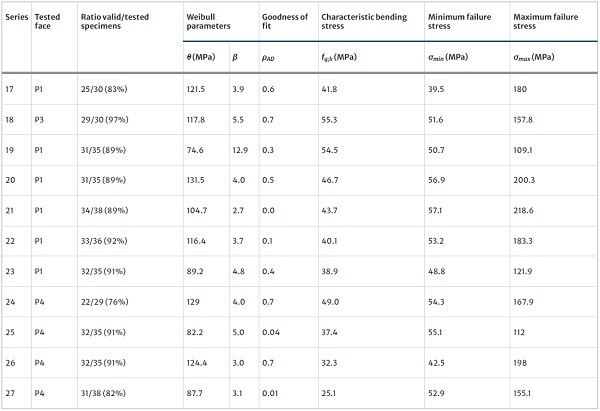
The failure stress data collected were statistically analysed with a two-parameter Weibull distribution. The parameters were estimated with the Weighted Least Squares Regression (WLR) using the method of moment (Datsiou and Overend 2018). The arising characteristic bending stress, fg;k, is defined as the stress corresponding to the 95% lower bound interval at the 5% probability of failure. The results of the data analysis is reported in Tables 5, 6 and 7, including the scale parameter θ, the shape parameter β and the goodness of fit ρAD, as well as the minimum and maximum failure stress for each series.
Table 5 Results of the Weibull analysis for the series of glass classified in QL 1 - Full size table
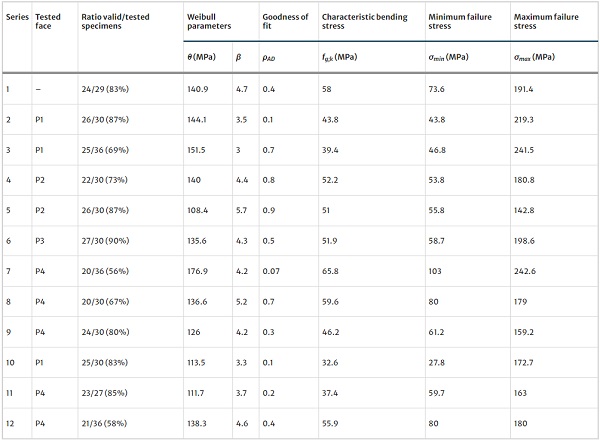
Table 6 Results of the Weibull analysis for the series of glass classified in QL 3 - Full size table
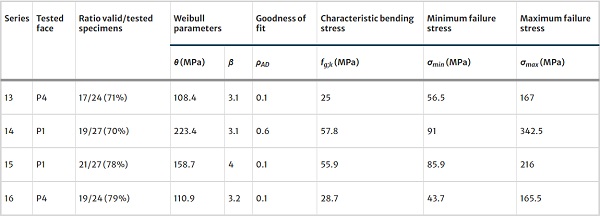
Table 7 Results of the Weibull analysis for series of glass not classified in any quality levels (unqualified) - Full size table
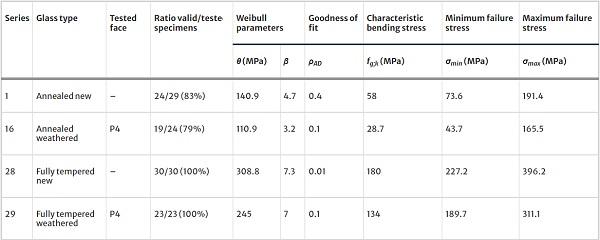
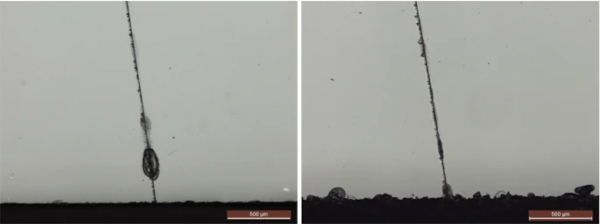
In Table 8 are shown the data for the thermally tempered series. For ease of results comparison the samples of the two series (annealed and fully tempered weathered) were taken from the same IGU panel. Two micrographs comparing the same surface flaws before and after undergoing thermal tempering is shown in Fig. 13. These pictures were taken by means of an optical microscope.
Table 8 Weibull statistical analysis on the fracture strength data of the special batches - Full size table
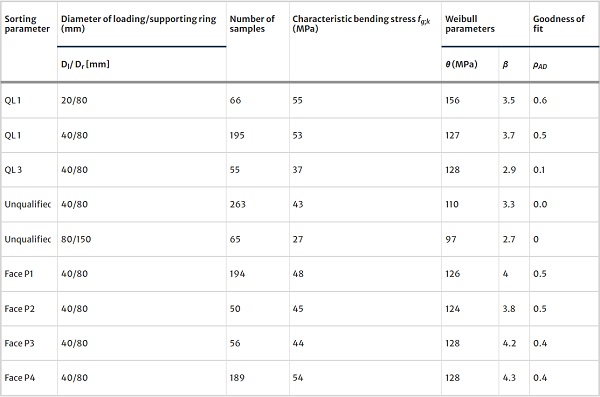
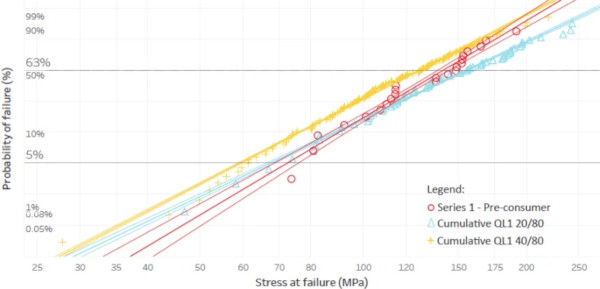
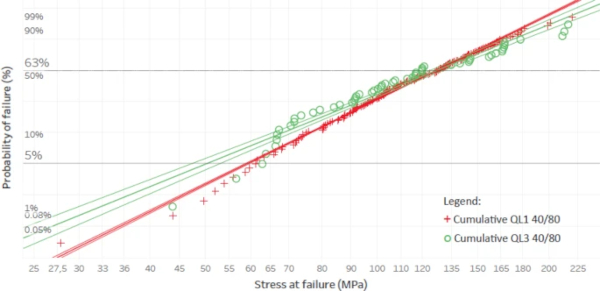
For a thorough assessment of the results, data were sorted by homogeneous quality level or homogeneous face in the IGU (i.e. P1, P2, P3, P4) and grouped to perform a cumulative Weibull analysis: the results are reported in Table 9. The grouping was made only for series characterized by the same rig sizes so that the size effect could be ruled out of the comparison. A selected set of Weibull plots are shown in Figs. 14 and 15: the series chosen for each plot are meant to guide the points raised in the discussion section. The cumulative series analysis was conducted with the aim of improving the significance of the results and facilitating the assessment of the large test campaign.
Table 9 Weibull analysis by cumulative series - Full size table
4 Discussion
4.1 The strength of post-consumer glass
The characteristic bending stress of the QL1 glass can be deduced by the cumulative series: 55 MPa and 53 MPa, for the 20/80 mm and 40/80 mm loading ring diameter/supporting ring diameter. These two cumulative series of QL1 are characterized respectively by a population of 66 and 195 samples. The batch of new glass tested with the 40/80 mm fixture recorded a value of 58 MPa. By comparing these data is possible to state that the new and post-consumer glass with a similar surface quality (i.e., the case of the QL1 glass) and they are tested with the same rig size yield almost identical mechanical performance (Fig. 14). This conclusion directly addresses the question of safety related to the use of post-consumer glass. The previous studies about weathered glass (already cited in paragraph 1.4) have shown that the glass strength is considerably low: Datsiou and Overend (2017) documented a 38 MPa of strength for artificial aged glass and Sofokleous (2022) recorded a minimum strength value of 23 MPa for one series of post-consumer glass. However, it is not possible to directly compare their results with this study because the samples differ in size and testing set up. It should be noted, however, that in the present study low values of strength was recorded for QL 3 glass.
4.2 The influence of the surface quality
The surface quality has a direct effect on the strength of glass. This can be understood by comparing the cumulative series of QL1 and QL3 using the same rig size: 53 MPa versus 37 MPa, respectively. In order to provide more conclusive information, QL2 glass ought to have been tested, but not enough glass qualified to make a series of QL2. The effect of the lower surface quality can be understood by looking at the Weibull plot (Fig. 15): the QL3 has several data points that scatter away from the best-fit line. This is likely to indicate that the flaw population deviates from the hypothesis of nearly pristine surface. The cumulative data of the unqualified glass ought not be deemed to go in contrast with the quality level tendency: the surface of this glass was not actually scanned; hence the surface quality is unqualified.
Therefore, it’s not possible to establish a lower bound performance with this type of glass with the cumulative Weibull for the 40/80 rings combination yielding to a fracture strength even higher than that of the QL3 glass (45 against 37 MPa). The surface quality classification proposed in this study appears to be effective, as it demonstrates a strong correlation with the mechanical performances of the glass. Increasing the population of QL 2 and QL 3 tested glass would be useful to confirm this trend. Based on these findings, it is possible to estimate the percentage of post-consumer glass suitable for reuse, by considering that only the glass classified in QL1 showed similar strength of new glass. The 33% of the collected post-consumer glass can be considered for a further use in buildings, instead of being disposed of in landfill. Other reuse applications with lower performance requirements may also increase this percentage.
4.3 The influence of the face
The comparison of the results for the cumulative series sorted by tested face highlights an unexpected trend: the faces towards the cavity (i.e. P2, P3) have lower strength than the faces towards the environment (i.e. P1 and P4) (Table 9). The reason why this is unexpected is because the faces towards the cavity do not receive direct impact during their life-time. As a suggestion, it would be useful to repeat the investigation of this parameter by aligning the face with the panel quality levels.
4.4 Age of the glass
The lifespan of the disassembled IGU was considered as one of the factors that could influence the mechanical performance of the glass, but eventually this parameter didn't seem to have any noticeable effect on it. This is clearly understandable by comparing the results for the series of glass with the same age and quality level. The QL1 glass series from 2 to 9 (Table 5), which came from 1993-year-old glass panels, showed strength values between 39.4 and 65.8 MPa. The unqualified glass series from number 19 to 27 (Table 7), which came from 1980-year-old glass panels, showed strength values between 25.1 and 54.5 MPa. The two ranges show a significant variation of strength and no evident relationship with the age parameter.
4.5 The influence of thermal treatment
Thermal tempering leads to an increase in the glass strength. By comparing the data in Table 8 is clear that the strength gain attributable to the tempering is higher for the new glass, characterized by an increase of 122 MPa, comparing to the ~ 105 MPa for the post-consumer glass. The two series of post-consumer glass were sorted from a panel of QL3, and the results suggests that the thermal treatment could be used to improve the performances of the post-consumer glass. The microscopical investigation carried out for few samples of post-consumer glass, before and after the thermal process, pointed out that crack healing occurs during the tempering (Fig. 13), but still this doesn’t mean that on a large scale the defects dimensions and density on the glass panel would be affected in a visible way. Further investigation is needed to understand up to which extent the thermal treatment (i.e. tempering and annealing) on the post-consumer glass is worth the trade-off spent in systematic re-processing.
4.6 Testing post-consumer glass
The used testing protocol would require further development in the following aspects:
- The sample size;
- The surface quality.
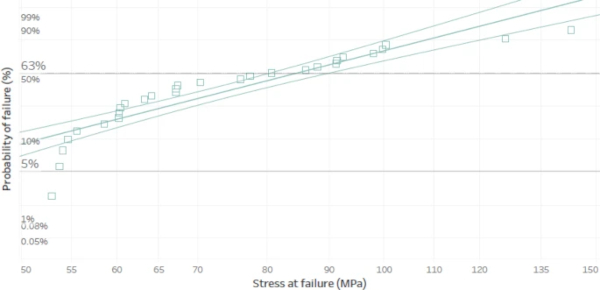
In order to have a significant amount of specimens to make a series the glass ought to be sourced from the same panel. But this means fairly small samples. The problem with a small sample size is twofold: it is not possible to compare the results with the nominal value of new glass, as that is derived from 1mx1m sample size; the small tested area fails to embed all the critical flaws, hence, a significantly large amount of samples failed from outside the loading ring (for example, series 3, 4, 7, 8, 12, 13, 14). Considering that the series tested with the 80/150 mm loading/supporting ring (i.e. 21 and 27) had an acceptable ratio of valid/tested samples, it could make sense to continue the studies on post-consumer glass by using a ring small enough to collect all the samples from the same pane, but large enough for preventing too many invalid data. It is very relevant also that these sizes are standardized, so that the scientific community can easily compare their respective data. Another recurrent problem is that the weathered surface yields a flaw population that not always best-fit with a Weibull analysis (Fig. 16).
The classification of the surface quality showed an influence on the glass strength, so it seems to be a relevant approach for classifying the post-consumer glass. However, the protocol of measuring the surface quality proposed in this study could be improved by considering the following aspects:
- Scalability the protocol used in this study defines the density of defects, but no reference to a specimen size was considered. This doesn’t represent a sensible error for the present study, because the glass pane size were similar one-another. Anyway, in the general case the defects metrics ought to be scaled to the surface (in order to have a max number of defects allowed per glass surface;
- Not all defects are so severe to affect glass strength. To maximize the amount of post-consumer glass for reuse, invisible defects should not be limited. The defects affecting the strength ought to be better qualified: ideally, the depth ought to be measured. These measurements will help in the development of a robust method for characterising the nature of flaws which are considered critical in affecting the strength of glass.
5 Conclusion
The suitability of reusing post-consumer glass was assessed in this study. Three main aspects are investigated in this study: the effect of given surface quality levels on the glass performances, the influence of the panel position in the former IGU and the appropriate testing method for post-consumer glass. The main goal of this experimental investigation is the assessment of the post-consumer glass performances by addressing three aspects that came up during the investigation and understanding which of these factors affects glass strength more. Forty-three IGUs, collected from residential buildings in Belgium were disassembled manually and the glass panels tested destructively with a Coaxial Double Ring test. The quality classification of post-consumer glass, based on the density of surface flaws, shows an influence on the glass failure stress.
The strength value of the QL1 glass is highly comparable to the strength value of new glass, whilst a decrease in strength was found for glass with lower surface quality (i.e., QL 3). The results of the tests suggest that the post-consumer glass with a good surface quality (i.e. QL1) can be safely reused to remanufacture a new IGU. During the glass strength assessment, also the panel faces were considered, but in contrast to what expected, the faces toward the cavity resulted to have lower performances. The lifespan of the IGU shows no relevant influence on the mechanical performances of the tested glass. Different combinations of rig and samples size were used to test the post-consumer glass in this study and the comparison of the results suggests that the combination of 80/150 mm loading and supporting ring yields the highest number of valid test samples.
As a conclusion, future studies about the reuse of post-consumer glass should focus on:
- The effect of ring size on the glass strength, in order to identify a size of the ring loading area that take into account a representative flaw population;
- The improvement of the surface quality protocol elaborated in this research. The quality classification should be scalable to the panel size;
- Categorisation of panels position by labelling the IGUs as they are removed from the building (exterior pane/interior pane). In this way, it would be possible to conduct more valid investigations into the effects exposure to external/ internal environments on mechanical performance;
- The extension of the performance assessment to other type of post-consumer flat glass (i.e., fully tempered, coated and laminated glass);
- An assessment of the embodied carbon associated to the process of the IGU remanufacturing;
- The identification of valid reconditioning methods that can be used to improve the performances of the post-consumer glass which can still provide a positive environmental balance vs recycling.
References
Funding
Open access funding provided by Politecnico di Bari within the CRUI-CARE Agreement.
Author information
Authors and Affiliations
- Department of Civil, Environmental, Land, Building Engineering and Chemistry, Polytechnic University of Bari, 70125, Bari, Italy - Angelica Rota & Francesco Fiorito
- AGC Glass Europe - Technovation Centre, Rue Louis Blériot 12, 6041, Gosselies, Belgium - Angelica Rota & Marco Zaccaria
Contributions
On behalf of all authors, the corresponding author states that there is no conflict of interest.
Corresponding author
Correspondence to Angelica Rota.