
Authors: E. J. van Nieuwenhuijzen, J. I. A. Tetteroo, M. van de Vliet & E. Melet
Source: Glass Structures & Engineering (2023)
DOI: https://doi.org/10.1007/s40940-023-00225-0
Abstract
High level circular use of post-consumer insulating glass units will contribute to lower the environmental and social impact of insulation glass industry. The application of various circular strategies for insulating glass units (IGU’s) is rising. The product age will give an indication of the remaining life-time of an IGU, but a method which includes screening a technical quality is needed to check if an IGU is indeed suitable for re-use on a high level of circularity. In this study the argon concentration is suggested as discriminative quality. Energy efficient double glazing applied in windows of buildings situated in The Netherlands were studied. Product codes were noted and unraveled. Measurements were performed using the Sparklike Laser Portable, a non-invasive argon measuring device, which generates argon concentration, glass thickness and cavity width values. In addition, measurements were performed with a Glass Check thickness meter. The resulting data were analyzed. Measuring errors were explored and used to setup a testing procedure. Threshold values of the product age and argon concentration were selected for different circular strategies. In conclusion, a screening method using the product age and argon concentration to determine the circular use potential of insulating glass units is proposed.
1 Introduction
1.1 Environmental and social impact of insulating glass industry (Why?)
The use of insulating glass units (IGU’s) in windows of buildings is a must-have in terms of daylight access with limited heat loss, but its production has a negative environmental and social impact. The insulating glass window market, estimated at 12 billion USD in 2020, is expected to grow due to the rising trend of energy efficient buildings (Markets and Markets 2021). IGU’s have a lower thermal transmittance (U-value) than single glass panes that were used in the past. The U-value depends on the composition of the assembled unit (EN 673, Van den Bergh et al. 2013). A typical IGU consists of two or more glass panes separated by a spacer that is filled with a desiccant, glued together by edge seals (Van de Voorde et al. 2015; Weller et al. 2016). But there is more to IGU’s. For example, low-e coatings are applied on the surface of a glass panel and cavities are filled with heavy inert gas to increase the thermal performance of IGU’s (Gläser 2008; Savić et al. 2013; Wakili et al. 2021).
Nowadays the use of energy efficient double glazing that contain low emissivity (low-e) coatings and argon is common (Glass for Europe 2019). Meanwhile, the application of even better insulating glazing, like triple and vacuum glazing, is rising (Jelle et al. 2015; Watts et al. 2022). However, a mayor concern is the contribution of the IGU production to the greenhouse gas emissions (GGE) and therefore global warming (IPCC 2018, 2022). For example, the production of float glass made of virgin material contributes around 0.6 kg up to 1.2 kg greenhouse gas emissions (GHG) per kilogram glass (Asif 2019; Usbeck et al. 2011; Zier et al. 2021). Also, the gathering of virgin resources such as metals and sand has negative impacts and concerns (Mancini et al. 2013, UNEP 2019, World Bank Group 2020). The European Union emphasizes these issues and enforces companies to take action by implementation of the Corporate Sustainability Reporting Directive and the European Union Emissions Trading System (European Commission 2018, 2021).
1.2 High-level use of post-consumer window glazing (How?)
Window glazing currently present in facades of buildings could be a potential material stock for the production of new IGU’s. The amount of post-consumer flat glass released due to renovation of buildings is estimated at 1.3 million tons in the EU-28 in 2013 (Hestin et al. 2016). No data has been found on the contribution per type of window glazing, but single glass panes and first generation double glazing are likely to be the main contributors. Theories of the circular economy imply, that the higher the level of circularity, the less environmental impact and material use (Potting et al. 2016; Stahel 2016). Nowadays, a large amount of flat glass waste still goes to low-level application. Flat glass is largely used for land fill (Glass for Europe 2013; Yu et al. 2020). In Europe a small volume of glass from construction and demolition waste is being recycled, but mainly involves downcycling like using glass fragments for insulation material and packaging glass (European Commission 2017, Wittekoek 2020, Geboes et al. 2022). Once flat glass has been downcycled it can never be recycled back into flat glass (Geboes et al. 2022). This underlines the interest to maximize the circular level of IGU use, instead of maintaining the common paths of waste use.
The application of different types of high level use of post-consumer window glazing can be considered (Debacker et al. 2021). For example, remelting post-consumer flat glass cullets to produce new flat glass. This will reduce the use of raw materials and carbon dioxide emissions compared to a flat glass product made of virgin materials (Bristogianni and Oikonomopoulou 2022). Recycling of pre-consumed float glass cullets is common practice, but the use of end-of-life cullets to make flat glass is more difficult due to high-quality requirements of flat glass production (Wittekoek 2020; Westbroek et al. 2021). Interestingly, tests with end-of-life cullets have been performed and a first flat glass product made of roughly 70% reused glass cullets is commercially available (“News” 2022, Saint-Gobain 2022).
Next to recycling also re-use strategies could be applied. Recently, the Dutch company GSF Glasgroep has launched a circular IGU made of uncoated flat glass obtained from disassembled postconsumer IGU’s and virgin coated glass. By re-using post-consumer glass plates, heat for melting glass at about 1500 °C is avoided and consequently less greenhouse gas emissions are released (Glass Alliance Europe 2021; Westbroek et al. 2021). In addition, the highest level of circularity for an IGU is considered to be the direct re-use of a complete insulating glass unit as a whole. Although a rarely applied re-use strategy, examples are known, such as the Noorderparkbar in The Netherlands designed by Bureau SLA or the more generally known buildings listed by Baratta et al. (2019). Finally, techniques to repair or upgrade IGU’s should be noted, like the refill of argon gas in IGU’s or the addition of an extra glass plate to old double glazing in order to upgrade the insulation quality. Thus far, studies on the actual application and the obtained service-life extension of repair and upgrade strategies in practice and theory are lacking.
1.3 Developing a method to screen the high-level re-use potential of double glazing in buildings based on IGU age and argon concentration (What?)
1.3.1 The age of an IGU is helpful to screen its re-use potential
Although all types of insulating window glazing are potentially suitable for a high-level circular use, not all types are interesting for the highest levels of circularity. For example, it seems unlikely to re-use IGU’s as a whole when they are older than 15 years. Mainly, because this age indicates good performance for at least another 10 years and a remaining technical service-life of at least 15 years. In Europe the EN 1279 is written under the assumption of well performing IGU’s of a 25 year period, including a rather stable u-value. In practice, it’s not a decrease in U-value but the presence of a visually broken glass or moisture condensation (fog) inside the panel that shows total failure and therefore the end of life time of an IGU (Garvin and Wilson 1998; Mohamed 2020).
The exact lifetime of an applied IGU is hard to predict, because internal fogging depends on many factors including the quality of the design, manufacturing and installation of the IGU and the climate conditions during its lifetime (Wolf 2002; Garvin and Wilson 1998). In general the technical lifetime of an IGU is expected to be around 30 up to 40 years (Torok et al. 2002; Wolf 2002; Howard et al. 2007; Lingnell and Spetz 2007). Next to the expected life time, the age of an IGU is also helpful to predict other IGU characteristics, like the presence of a low-e coating or the type of spacer, which will be enlightened in the discussion. Overall, IGU’s aged 15 years or younger seem favorable in terms of checking their suitability for the highest levels of circularity.
1.3.2 Why is a screening method needed based on the technical quality of an IGU?
IGU’s have to meet various requirements when sold as a product due to legislation and customer demands (Savić et al. 2013). The initial quality of an IGU depends on the individual components used, including the spacer bar, low-e coating, cavity filling, sealants and desiccant (Garvin and Wilson 1998; Knorr et al. 2016; Mohamed 2020). Furthermore, a proper manufacturing process and installation into the frames is of great importance (Garvin and Wilson 1998). Despite these, some IGU’s may fail earlier than the expected 30 years and properties like the U-value of the product can already decline before total failure (Howard et al. 2007; Lingnell and Spetz 2007). Therefore, the age of the IGU will give an indication of the remaining life-time of an IGU, but a method screening the technical quality of the IGU is needed to check if an IGU is indeed suitable to re-use the IGU as whole.
1.3.3 Why argon concentration and which method?
Since the 1950s IGU’s became commonly available (Van de Voorde et al. 2015). The U-value is a measure for the insulating capacity of IGU’s and therefor an important characteristic (Aspaugh et al. 2016, Glass for Europe 2019). It specifies how much heat flow or heat loss occurs through the glass due to the difference between indoor and outdoor temperatures. In the last decades, cavities of IGU’s are generally filled with argon (Samaitis et al. 2022). The positive effect of filling the cavity of an IGU with argon or other gasses like krypton or xenon is known for years (Gläser 2008; Garvin and Wilson 1998). These gases have a lowered heat transmission coefficient compared to air filled IGU’s due to their positive effect on the thermal conductivity and convection in the cavity (Respondek 2020; Wakili et al. 2021).
A drawback of gas filling is the gradual loss of gas via the edge seal. In general, the impact of argon on the U-value of IGU’s is rather small compared to the impact of low-e coatings, but it does contribute to a higher energy efficiency (Aspaugh et al. 2016; Bizoňová and Bagoňa 2019). Regulations or clients may require a minimal U-value which is only feasible when argon is applied. In The Netherlands for example, insulating glass units with a center pane U-value of ≤ 1.2 W/m2K are often required (referred to as HR++ glazing), which can only be met with double glazing when a good performing low-e coating is applied together with an inert gas (BRL2202 2012, NPR-CEN ISO 2017).
The argon concentration is an interesting property of the IGU and valuable to measure, due to its decrease in time (Aspaugh et al. 2016). The EN 1279-3 (2002, 2018) requires a gas loss rate of equal or less than 1% for IGU’s with specific dimensions after artificial ageing. It’s written under the assumption that this threshold ensures a maximal gas loss of the IGU installed in a building of less than 5% over 25 years and an u-value decrease of not more than 0,1 W/m2K. Considering IGU’s generally having a nominal value of 90% and a minimal real value of 85%, a well performing in-use IGU should therefor contain more than 80% argon. In-use IGU’s with a real value of 80% or less will likely have a worse u-value degradation than assumed in the EN 1279-3. Also, the gas loss rate is higher than it should be, when considering the occurrence of production errors during gas filling to be negligible. It suggests IGU’s having a less functioning barrier than good performing IGU’s and therefore being more prone to moist penetration and internal fogging (Wolf 2002). In conclusion, the argon concentration of in-use IGU’s will provide indirect information on the U-value degradation and sealing performance in an early stage.
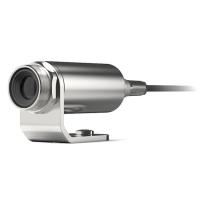
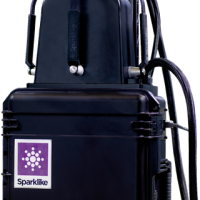
The argon concentration is a suitable quality to screen because it is possible to measure it on IGU’s situated in buildings. In the case of renovation plans or new construction after demolition, it is desirable to screen the re-use potential of IGU’s on forehand, while the IGU’s are still in place. The company Sparklike developed non-invasive methods to measure insulating gases of IGU’s based on spectroscopy (Niiranen et al. 2018, Sparklike 2021a, Wakili et al. 2021). The different types of Sparklike devices are developed for quality control in IGU production. Some have technical requirements that can be easily met in a factory but not at the façade of a building. For example, the Sparklike Handheld cannot cope with light shining through the glass and requires argon concentrations above 50% according to the manufacturer (Sparklike 2021a). One device does seem suitable to determine argon concentrations of IGU’s in the field: the Sparklike Laser Portable.
Alternative methods for the Sparklike Laser measurements that have been considered to obtain additional information on the quality of insulating glass units in buildings:
- Intrusive gas analyzers can be used to determine the gas content of IGU’s (Sergeyev and Borysow 2008). Oxygen gas analyzers are in general more easy to use than gas chromatograph analyzers. Although commercially available analyzers, like devices of Servomex or DGT Anlagen und Systeme GmbH, might be interesting in terms of handling or measuring accuracy, the device needs to punctuate the edge seal of an IGU with a syringe in order to obtain a gas sample. When IGU’s are applied in buildings, the side of an IGU is not accessible.
- At the Kaunas University of Technology a Hybrid ultrasonic technique for non-invasive evaluation of argon gas has been developed (Samaitis et al. 2022). Unfortunately, a portable version to apply in buildings is not yet available.
- The use of a dewpoint meter can provide information on the moisture content of IGU’s but may not be sufficient to monitor initial quality loss of an IGU. The amount of moist present in an IGU situated in a building can be measured with a dewpoint meter (Gjelsvik 1969; Garvin and Wilson 1998). The basic principle of this method is that water vapor will condense onto a surrounding surface, when that surface is cooler than the dew point temperature. However, the service-life prediction based on the amount of moist is uncertain, in particular when moist is still absent or hardly present. For example, due to the presence of desiccants in an IGU, the moist in the panel that has been enlocked during production will be removed, but a desiccant will also act during the lifespan of the IGU, if gas exchange occurs (Garvin and Wilson 1998, Van den Bergh et al. 2013).
- Measuring the U-value of an IGU will provide info, but the exact U-value of in-use glass is hard to measure. In-use glass cannot be tested according to the EN 675 (2011), because it requires the testing of specific specimens in lab conditions. In situ measurements could be performed according to the ISO 9869-1 heat flow meter method, but it requires a minimum test duration of 3 days and windows that can be opened (2014). Commercial U-value meters with short measuring times are available, like the Glassmeter 800 K or Netzsch UGlass. However, they either require a known argon percentage or access to the IGU from inside and outside.
- Infrared (IR) thermography has been used to assess the U-value of IGU’s in buildings, but it is too inaccurate to determine quality decrease of an in-use IGU. The basic principle of this technique is that material surfaces emit thermal radiation, the amount depending on temperature and emissivity (Soares et al. 2019). In order to calculate a reasonable U-value of an IGU in a building, IR thermography measurements of the IGU surface are needed under specific weather conditions, together with reliable information on the emissivity and the inside and outside air temperature (Fokaides and Kalogirou 2011; Soares et al. 2019; Maroy et al. 2017). Even then, the IR thermography based method is not sensitive enough to show a significant difference between an double glazing with and without argon (Maroy et al. 2017).
- Visual inspection of IGU’s on site might be suitable to select coated IGU’s near the end of their lifespan, but seems insufficient to objectively monitor initial quality loss of IGU’s in an early stage. The EN 1279 requires a method to determine the visual quality based on observations by the naked eye. No literature has yet been found on the visual quality of in-use IGU’s based on this method, but speculations were made by Dutch experts indicating a low failure rate.
A known studied topic is the effect of visible degradation of glass coatings. Different types of glass coatings can be applied on IGU’s, like solar control and thermal low-e coatings (Jelle et al. 2015; Stazi et al. 2016). In general, these coatings will not degrade inside a dry IGU. Sealants and desiccants are specially applied to keep the cavity dry (Van den Bergh et al. 2013). However, physical degradation of coatings can occur in the presence of moist, resulting in the appearance of white dots, or cracks and wrinkles (Ando and Miyazaki 1999; Stazi et al. 2016). These visual inspections are often performed using a microscope (Ando and Miyazaki 1999, Van den Bergh et al. 2013). It seems likely that only after severe degradation the stains are visible with the naked eye and therefore a symptom of IGU degradation in an advanced stage of failure.
In this study a Sparklike argon concentration measuring device was tested on IGU’s situated in buildings in order to screen a potential glass stock for high-level re-use, including direct re-use, upgrade the IGU as a whole, re-use of float glass plates and re-use of glass cullets. Other methods, like a thickness measurement, were also used to check parts of the Sparklike output. Threshold values of the argon concentration and product age are set for different categories of circular strategies as part of the screening method to determine the circular use potential of insulating glass units.
2 Methods
2.1 Applied devices & general procedures
A commercial Sparklike Laser Portable™ 2.0 was used to determine argon concentrations in IGU’s. The Sparklike Laser Portable is based on Tunable Diode Laser Absorption Spectroscopy and measures the thicknesses of the glass plates and cavity width of the IGU and the amount of oxygen present in the cavity. Thereafter, it calculates the insulating gas concentration (e.g. Argon or Krypton) in the cavity. According to the manufacturer,only the cavity width is used for the calculation of the insulating gas concentration together with the amount of oxygen (A. Koski, personal communications, 1 September 2022). In addition to the insulating gas, the rest of the gas present in the cavity is supposed to be air with an oxygen volume of 20,9%.
A Sparklike Laser Portable™ 2.0 was provided by Sparklike. The machine had ID LP20-20XX and was calibrated on 18/2/2022. The device had a declared repeatability of the gas measurements of ± 2% at a 95% confidence interval for a typical construction of the insulation gas (Sparklike 2021b). According to the corresponding calibration certificate, the following gas fill argon concentrations were used in the calibration: 1%, 70%, 80%, 85%, 90% and 95%.
After usage of the device on IGU’s studied in this work, the Sparklike device was sent back to the Sparklike laboratory and its accuracy was tested again, before and after cleaning the front glass panel of the measuring head.
The setup of the device was performed at the start of each measuring day according to the instruction manual (Sparklike 2021b). This involved the argon filling of the device followed by an inner residue oxygen concentration check, and a laser current and temperature (i.e. laser thermistor resistance) check.
At the end of a measuring day the oxygen concentration was checked again. The current and temperature check was not performed again, unless mentioned otherwise.
Although a specific position to measure the IGU is not prescribed, in this study a standard measuring spot was selected, unless indicated otherwise. The standard existed of placing the bottom edge of the measuring head of the Sparklike 5–10 cm above the bottom edge of an IGU.
Depending on the positioning of the measuring device on the inside or outside of the window, a glass plate will be referred to as glass 1æ or glass 2æ. When measuring from inside, the Sparklike measuring head is placed against the inner glass plate and this glass plate is then defined as glass 1æ. The symbol æ is added to emphasis its difference compared to usual numbering of glass panes from outside to inside. The width of the gap between the panes of an IGU is referred to as cavity width.
Before calculation of the average argon concentration and glass thickness and cavity width of an IGU, the data set was checked. When extreme outliers were recognized, these Sparklike readings were removed from the data set. First of all, the upper limit of measurable argon concentrations is 97%, which is deducted from the Sparklike calibration certificated. Therefore, argon concentration values higher than 97% were removed from the data set. Secondly, in this method a value is considered an outlier if the glass thickness differs more than 1 mm for glass 1æ or the cavity width differs more than 2 mm compared to other values measured in the same session. The thickness of second glass plates were not examined, because its value is irrelevant for the calculated argon concentration.
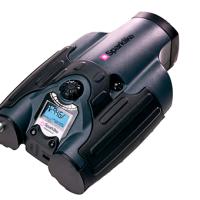
A Glass-Chek Elite GC3200 was also used to measure the glass thicknesses and the cavity width. The device was applied in the middle of the bottom of the IGU, according to the instruction manual. A single measurement was performed on each IGU, unless stated differently. The apparatus used, was rented from Ayrox SRL. The air space measurements have an accuracy of 0.3 mm and the glass thickness 0.2 mm (Elite manual). Generally, the standard mode was selected, according to the manufacturer resulting in round glass thickness based on the glass standard according to the American Society for Testing and Materials (ASTM).
Next to average values of the argon concentration, glass thickness and cavity width, standard deviations (SD’s) for a sample set of data were calculated. This is performed with excel according to STDEV.S.
In order to show the spread in thickness values of the Sparklike Laser Portable, the absolute difference between the highest and lowest measured thickness of glass 1æ and the cavity width are calculated. Based on practical experiences with the Sparklike Laser portable, the values of reliable measurements within a single measuring session are expected to be around 0.2 mm.
2.2 Tested insulating glass units
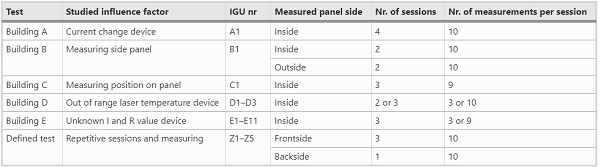
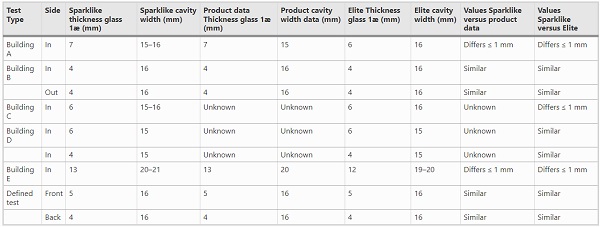
A defined indoor sample test and several in situ tests with in-use insulating glass units were performed (Table 1). Various factors that are expected to influence the operation and results of the Sparklike device were tested.
Table 1 Overview of the tests and their testing characteristics - Full size table
2.2.1 Building A—IGU A1: current change
A single IGU was measured in a three-story high office building in Rotterdam, The Netherlands. It was located on the first floor at the north-west oriented facade. To get an impression of the effect of a current change, measurements were performed with and without connection to the electricity grid. Measurements were performed on two different days. On the first day the window was measured from the inside in three sessions. On the second day the window was measured in a single session. Each session contained 10 measurements.
The IGU was made by manufacturer X.1 in 2010, sized 614 mm × 1370 mm. It was specified as a HR + + product made of a 5 mm outer pane in blank float glass, cavity of 15 mm with 90% argon, and a 6.8 mm laminated coated inner pane made of float glass.
2.2.2 Building B—IGU B1: inside and outside
A single IGU was measured of a three-story town house in Rotterdam, The Netherlands. It was located on the first floor at north-east oriented facade in a winged window. To get an impression of the effect of the IGU side on which the device is placed, the IGU was measured on the inside and outside. Measurement were performed on two days. Per side and day, 10 measurements were performed.
The IGU was made by manufacturer X.2 in 2011, sized 480 mm × 1260 mm. The product code revealed an argon containing product with a 4 mm outer pane in blank float glass, cavity of 16 mm with argon, and an 4 mm inner pane of low-e coated float glass.
2.2.3 Building C—IGU C1: measuring positions
A single window was measured in a nine-story high office building in Amsterdam, The Netherlands. It was located on the second floor at the south-west oriented facade. To get an impression of the impact on the Sparklike readings of different measuring positions of the IGU panel, 9 different measuring positions on the windows were tested in a three by three grid with a 20 cm row distance at the lower half of the IGU. The selected positions were numbered 1 to 9, from bottom left, to top right corners. The lowest three spots (number 1, 2 and 3) being 5 cm above the bottom of the window. The middle three spots (number 4, 5 and 6) being 30 cm and the upper three spots (number 7, 8 and 9) being 80 cm above the bottom.
Measurements were performed from inside during one measurement session. The IGU was made by manufacturer X.3, sized 938 mm × 1852 mm and specified as HR++ product. The production date is estimated to be 2010 based on the renovation year of the facade.
2.2.4 Building D—IGU D1–D3: out of range laser temperature
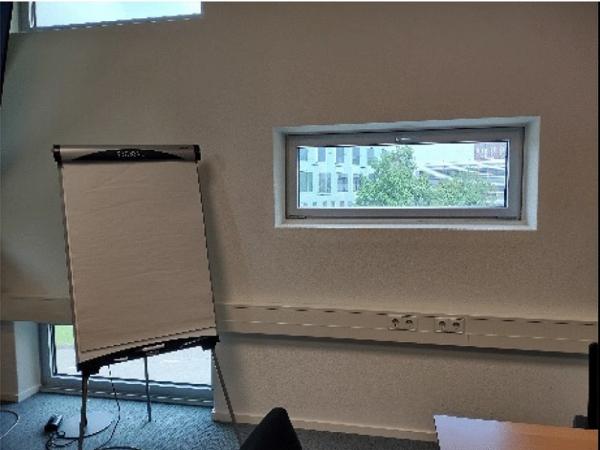
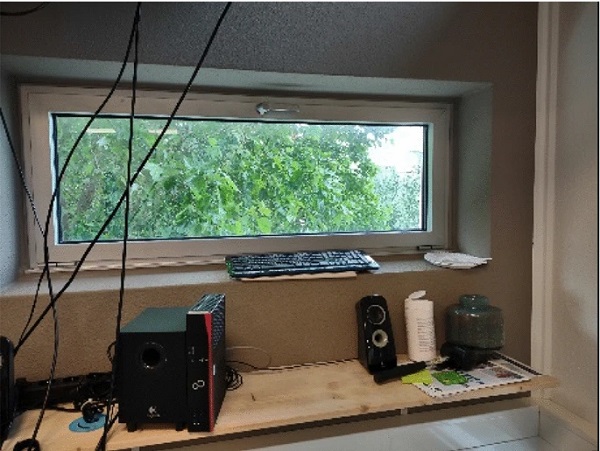
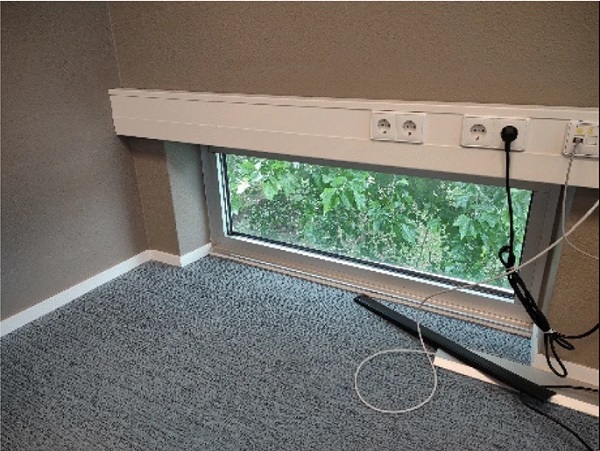
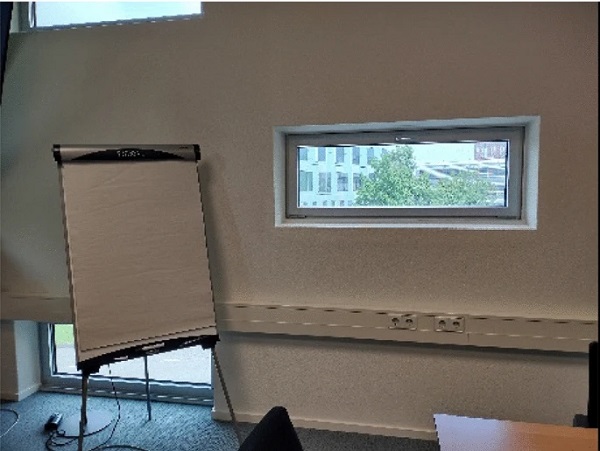
Three windows were measured from a four-story high office building in Utrecht, The Netherlands. They were located on the first floor (Figs. 1, 2, 3). IGU D1 and D2 faced north-west and IGU D3 faced north–east.
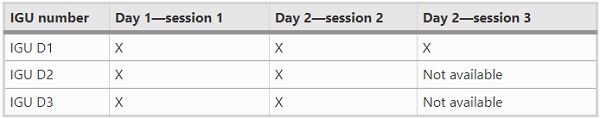
To get an impression of the effect of the laser temperature of the Sparklike device (i.e. laser thermistor resistance) being out of range, multiple IGU’s were tested with the device in normal conditions and in the condition that the laser temperature of the device was out of range. Three measurement sessions were performed on IGU D1, and two on IGU D2 and D3. The sessions were performed on two different days, as described in Table 2. 10 measurements were performed per window in a single session. While measuring, the device showed the notification ‘out of range laser temperature’ during the second session of window 3. The message disappeared after a few second and without further action the measurements were continued.
Table 2 Overview of the measuring sessions performed per IGU - Full size table
Identification of the spacer code showed that the windows were the same product type made by manufacturer X.3 on the same production date (09-26-2002). The size of IGU D1 and D2 was 1220 mm × 395 mm mm and the size of IGU D3 was 1235 mm × 410 mm. They were specified as an argon containing product with an outer pane in metal coated float glass, cavity, and an inner pane of blank float glass.
2.2.5 Building E—IGU E3.1-E10.8: unknown laser current and temperature
Eleven IGU’s of a ten-story high office building in Amsterdam, The Netherlands were measured from the inside. One IGU was located on the third floor, facing south-west, two on the ninth floor facing north-east and eight IGU’s on the tenth floor, four of which facing south-west and four facing north-east. The size of the IGU’s was 941 mm × 2942 mm.
All IGU’s were tested on three different days. In a single measurement session, an IGU was measured three times, except for the leak window on the third floor. This IGU was clearly not installed properly, because it contained a layer of water inside cavity. Measurements were performed in the middle of its width on three different heights: (1) at the height of the internal water, (2) right above the internal water, (3) in the centre of the window. The IGU on the third floor was measured nine times for each day and the other windows were measured threefold.
Identification of the spacer codes showed that the IGU’s were made by manufacturer X.4 in 2012 and 2013. One IGU did not show a code. The production dates varied, being 18-09-2012, 20-09-2012, 24-01-2013, 15-03-2013. The codes revealed the following composition: an outer pane of 6 mm glass with solar control coating, 20 mm cavity width and an inner pane of 12.8 mm laminated glass (66.2).
2.2.6 Defined sample test
Five IGU specimens were produced and tested at the factory of Glasindustrie Ben Evers BV in The Netherlands.
The IGU’s were sized 500 mm × 500 mm and composed of an outer glass plate made of 5 mm blank float glass, a cavity of 16 mm, and inner glass plate made of 4 mm blank float glass. An argon filler machine of Glastechnische Industrie Peter Lisec, named Lysec (type FPS-26/16U2, production year 2001) was used to fill the specimens. The argon concentration was set to 90%.
In total four measurement sessions were performed on a single day, three days after the specimens were produced. Three measurement sessions were performed on the frontside (corresponding with the outside) of the IGU. On the backside (corresponding with the inside) of the IGU, a single measurement session was performed. The Sparklike and the Glass Chek Elite were used 10 times, in each measurement session on a single IGU.
The setup of the Sparklike Laser Portable™ 2.0, as mentioned before, was performed according to the instruction manual (Sparklike 2021a; b). In contrast to the general procedure the current and temperature check was not only performed at the start of the day, but also at the end of the day.
Specimens were placed on a black non-reflective surfaced table, lifted nearly two centimeters above the table using small wooden blocks as spacers. The measuring head of the Sparklike was placed in the middle of the glass panel, using the naked eye for positioning. After each measurement, the head was released from the glass, rotated in a horizontal position and placed in the middle of the glass again.
3 Results
Raw Sparklike data of the in-situ tests and defined sample test are added as supplementary information.
3.1 Building A—IGU A1: current change
Session 1 was performed on day 1 with a Sparklike device that had a normal setup at the start of the day, but without connection to the electricity grid. So only the battery of the device was used during measuring. It resulted in an average argon concentration of 54.7% with SD 0.9% (Table 3). After session 1 the Sparklike crashed, due to energy shortage. The Sparklike was connected to the electricity grid directly after the crash, restarted and without calibration session 2 was performed. The readings resulted in an average argon concentration of 62.1% (SD 0.5), which is higher than session 1. Session 3 was started after a manual shut down and restart, while connected to the energy grid. It showed an average argon concentration of 55.3% (SD 0.8), which is in line with session 1. Session 4, measured on day 2, resulted in an average concentration of 53.2% (SD 0.7) similar or slightly lower to session 1 and 3 of day 1.
Table 3 Average gas concentration readings, glass 1æ thickness and cavity width with corresponding standard deviations of the IGU’s in building A, B, C and D measured with a Sparklike device and the calculated absolute difference between the highest and lowest reading of the glass 1æ thickness and cavity width - Full size table
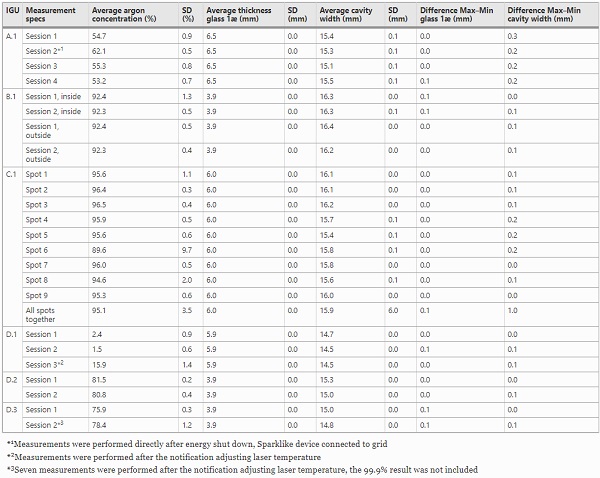
Combining the readings of the measurement sessions results in an average concentration of 56.3% with SD 3.5%, while leaving out the readings after the crash results in an average concentration of 54.4% with SD 1.2%.
The measured glass thickness and cavity width generally show similar values compared to the revealed product data. The inner glass pane should be 6.8 mm, and the Sparklike shows average thicknesses of 6.5 mm with an SD of 0.0%. The cavity width is declared to be 15 mm, and the Sparklike shows averages between 15.1 and 15.5 mm with an SD of 0.1.
The absolute difference between the highest and lowest thickness value of glass 1æ for an IGU within a single measuring session measured with the Sparklike 1 from inside was up to 0.1 mm and mm for the cavity width up to 0.3 mm (Table 3).
The Elite results are in line with the Sparklike measurements. It showed for all measurements an inner plate thickness of 6 mm, and cavity width of 15.7 or 15.8 mm.
3.2 Building B—IGU B1: inside and outside
Combining all values of the different measuring sessions results in an average concentration of 92% and a SD of 1%. Measuring from the inside or measuring from the outside showed a similar average concentration (Table 3).
The glass thicknesses and cavity widths measured show similar values compared to the revealed product data. The Elite measurements on both side of the window resulted in 4 mm, 16 mm and 4 mm for the inner glass plate, cavity width, and outer glass plate 2 respectively. The average thickness of the glass plates and cavity widths measured with the Sparklike corresponds with the results of the Elite.
In the case of measurements with the Sparklike, glass plate 1 is the inner pane for measurements from inside, while in the case of outside measurements glass plate 1 is the outer pane.
The absolute difference between the highest and lowest value of the thickness of glass 1æ and the cavity width for an IGU within a single measuring session measured with the Sparklike 1 from inside was up to 0.1 mm. The measuring session from outside showed a higher absolute difference between the highest and lowest cavity width value (0.2 mm).
3.3 Building C—IGU C1: measuring position
Combining the results of all nine measuring positions, the average argon concentration of the window was 95.1% with an SD of 3.5%.
The measurements performed at each spot show average argon concentrations of 89.6% and more (Table 3). Spot 2 shows the highest average argon concentration (96.4%) and spot 6 (89.6%) the lowest. However, a student’s t-test shows that the average of measurements taken at spot 2 is not statistically significant different compared to the average at spot 6 (p > 0.05). In addition, the lowest three spots (spot 1–3) did not have a significant different argon concentration compared to the upper three spots (spot 7–9).
The thickness of the two glass plates and the cavity width cannot be compared to factory information since product data is missing.
The thickness of glass 1æ measured with the Sparklike was 6.0 mm, regardless the position of the measuring spot. The cavity width varied from 15.4 to 16.2 mm. The Elite showed an inner glass plate thickness of 6 mm and a cavity width of 16 mm, generally in line with the Sparklike results.
The absolute difference between the highest and lowest thickness value of glass 1æ for an IGU within a single spot measured with the Sparklike was up to 0.1 mm and for the cavity width up to 0.2 mm.
3.4 Building D—IGU D1-D3: out of range laser temperature
As mentioned before, this data includes measurements taken with a device having an out of range laser temperature. It applies to the second session of IGU D3 and the third session of IGU D1.
Measuring session 1 on the three windows showed that IGU D1 had hardly any argon left in the cavity (2.4%), while IGU D2 and D3 had an argon concentration higher than 75%. The corresponding glass panel thicknesses showed very little spread for glass 1æ and the cavity width (SD 0.0%).
The second measuring session showed similar results for IGU D1 and D2. The average argon concentration was less than 1% lower for both IGU’s.
During the second session of IGU D3, the measuring device notified the laser temperature to be out of range. At the beginning of measurement number 4, while the measuring head of the Sparklike was pressed on the window and a vacuum between measuring head and IGU was created, a message came on the screen noting: ‘adjusting laser temperature’. The message disappeared in about 20 s and the machine could be used again for a new measurement. The resulting thickness values were in line with the other measurement, but the argon concentration showed 99.9%. After a few minutes break, the next measurements were performed, showing readings for this IGU between 78.4 and 79.0%. The average of the readings results in a higher argon concentration than in session 1 and a bigger spread (Table 3). Also the average of the readings of the third measurement session of IGU D1, being 15.9% (SD 1.3%), was higher compared to its previous sessions.
The thickness of the glass plates and the cavity width cannot be compared to factory information since product data is missing.
The average thickness of the inner glass plate and cavity measured with the Sparklike corresponded with the results of the Elite. The Elite showed for all measurements on IGU D1 an inner pane of 6 mm and a cavity width of 15 mm. For IGU D2 and D3 an inner pane of 4 mm was measured and again a cavity width of 15 mm.
The absolute difference between the highest and lowest thickness value of glass 1æ or cavity width for an IGU within a single measuring session measured with the Sparklike was up to 0.1 mm.
3.5 Building E—IGU E3.1-E10.8: unknown laser current and temperature
All IGU’s showed an average argon concentration based on the readings for each measuring day below 72% (Fig. 4). The selected IGU on the third floor was leak (E 3.1). It had several centimeters of liquid water inside at the bottom of the IGU panel. Above this liquid water condensation was visible. Only this IGU showed corresponding SD’s of more than 0.6%.
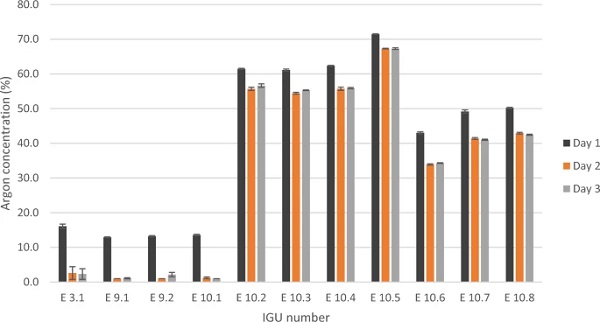
Remarkably, on the first measuring day, the average of the argon concentration readings of this leak IGU was 16.1% (SD 0.6%). On the other two measuring days the average was around 13,5% lower, dropping to 2.6% and 2.3%.
The other IGU’s also showed lower average readings on day 2 and 3 compared to day 1.
IGU W10.5 had the highest average argon concentration and showed the lowest SD in argon concentration of the readings of the three sessions combined (Table 4).
Table 4 Average gas concentration readings, glass 1æ thickness and cavity width with corresponding standard deviations of the IGU’s in building E measured with a Sparklike device - Full size table
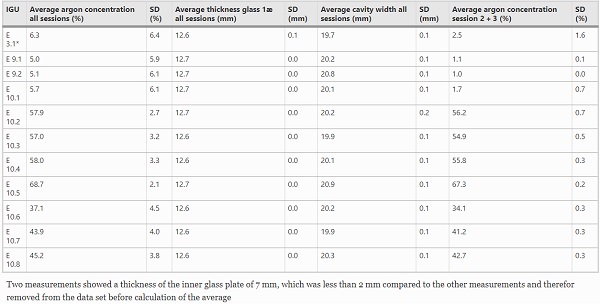
The measured glass 1æ thicknesses and cavity widths show similar values compared to the revealed product data that differ no more than 1 mm. The average of the thickness of all three days combined measured with the Sparklike showed for each IGU an inner glass plate of 12.6 mm or 12.7 mm with a SD of 0.1 and below. The average cavity width was 20 mm, except for IGU E9.2 and IGU E10.5. All averages corresponded with a low SD (Table 4).
For all IGU’s, the Elite showed an inner plate of 12 mm and a cavity width varying between 19.4 and 20.4 mm.
The absolute difference between the highest and lowest thickness value of glass 1æ for a IGU within a single measuring session measured with the Sparklike, was up to 0.2 mm and for the cavity width up to 0.3 mm.
Excluding the data of the leak IGU (E3.1) from the data set results in lower absolute differences: 0.1 mm for glass 1æ and 0.2 for the cavity width.
3.6 Defined sample test
Combining the measurements of all sessions on the frontside, each specimen had an average argon concentration of at least 92.2% up to 94.1% with an SD between 0.9 and 1.3%. The corresponding 95% confidence interval of the frontside measurements is not more than ± 0.48% for each specimen. The lowest argon concentration of all measurements was 90.0%, while the highest argon concentration measured was 96.3%.
The average argon concentration measured at the frontside of same specimen sometimes differed per session (Fig. 5). For example, specimen 1 showed a different average of session 1 (93.7% SD 0.9%) compared to session 3 (92.5%, SD 1.1). Results of a t-test showed a significant difference (p < 0.05). Another example is specimen 4, which showed to have a significant different average during session 2 compared to session 3.
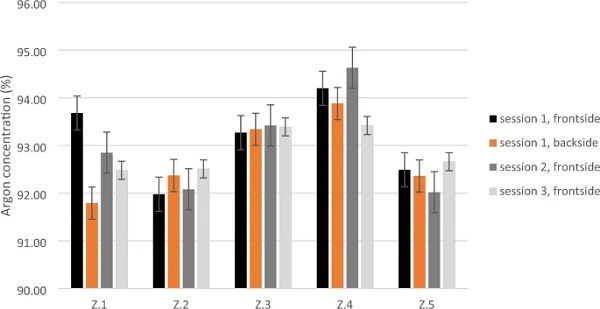
The average argon concentration measured at the backside is similar to the average argon concentration of the measuring sessions at the frontside, except for specimen 1.
The measured thicknesses are in line with the declared product data for the outer glass pane, cavity and inner glass pane (5 mm, 16 mm and 4 mm reps.). The Sparklike and the Glass Check Elite showed similar results (Table 5). The average thickness of the glass 1æ resulted in 5 mm for all specimens. The average thickness of the cavity width is 16 mm. The average spacer values measured with the Sparklike differ up to 0.2 mm with the average values measured with the Elite.
Table 5 Average gas glass 1æ thickness and cavity width with corresponding standard deviations of the defined sample test IGU’s and the calculated absolute difference between the highest and lowest thickness value of glass 1æ and the cavity width measured with the Sparklike Laser Portable - Full size table
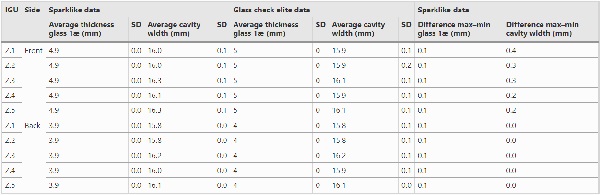
Although the absolute difference between the highest and lowest thickness value of glass 1æ and the cavity width for a single IGU measured with the Sparklike was up to 0.4 mm, the difference for a single IGU within a single measuring session was not more than 0.1 mm.
3.7 Ex-post control
When the device was shipped back to the Sparklike laboratory after finalizing the measurements of the IGU described in this study, the device did not pass the accuracy test in the laboratory. After the front glass panel of the measuring head was cleaned it did pass the test. The exact data are not available.
4 Discussion
4.1 Measuring errors using the Sparklike
Several aspects will influence the accuracy of gas concentration measurements with the Sparklike. They can be caused for example by the person performing the measurements (human effect), the inaccuracy of the measuring device (instrumental error) or the measured object (Kuselman and Pennecchi 2015; Harris and Smith 2009). The encountered examples observed in this study are discussed. Lessons are learned to minimize these effects for the circular use screening method.
4.1.1 Current change
The results of building A show an effect on the measured argon concentration after a shutdown of the machine due to an empty battery and rapid restart without a laser current and temperature check performed by the user. The average gas concentration of the measurements after the shutdown of the machine were too high. Compared to the other data on measuring day 1 and the data of measuring day 2, it differed 7–9%. These results show the importance of checking the current and temperature of the laser device after every (re)start of the Sparklike Laser Portable.
4.1.2 Adjusting laser temperature
The results of building D show an effect of using a device without a proper laser temperature.
The notification ‘adjusting laser temperature’ which occurred during measuring, implied that the laser temperature was out of range and should be adjusted. The measurements taken after this message, without restarting the device, were higher than before. It differed up to 14% in the case of IGU D1. These results show the importance of correct handling when the notification ‘adjusting laser temperature’ occurs.
4.1.3 Unknown laser current and temperature
The results of building E show an effect on the measured argon concentration after a single undocumented check of the laser current and temperature of the measuring device. The results of building E show a higher average of the argon concentration readings of the IGU’s measured on the first day than on the other two days. A possible explanation is an unnoticed setup-up error at the start of the day. These results show the importance of documenting the laser current and temperature check of the laser, when running the start-up protocol and performing a second laser current and temperature check at the end of the measuring day.
The difference in argon concentration in the IGU’s of building E between day 1 and the other two measuring days varies from 4 up to 14%. The measurements on day 2 and 3 are considered to be correct. This can be explained by the results of the leak window. This window has visual water in the cavity, showing that the IGU is not properly sealed anymore. Therefore, the window is expected to have no argon left, which should be reflected in a measurable argon concentration of around 1%. The measurements on day 2 and 3, showing an average argon concentration for the leak window of around 2.5%, which is closer to the expected value than the average argon concentration of day 1 (16%).
4.1.4 General observation related to laser current and temperature
A difference in measured values was to be expected for the three previous discussed factors based on the information of the Sparklike manual (Sparklike 2021b). It is unclear as to why the values are higher instead of lower when the temperature or current is out of range. Nevertheless, these results shows that it’s important to follow an elaborate measuring protocol or to accept measuring errors, which could be up to 14%.
4.1.5 Sampling position on IGU
The results of building C do show a difference in the measured cavity width between the lower measuring spots and the spots further away from border of the glass pane. A difference in the measured cavity width at different measuring heights could be attributed to production effects, climatic conditions or the measurements themselves. In particularly, the deflection of glass panes in IGU’s due to climate factors has been studied (Respondek and Major 2019). In the context of the performed Sparklike measurements, it is speculated that deflection due to the measurement itself could be at stake. During placement of the measuring head on the inner glass pane, the person handling the device will press against the glass. There is less pressure needed in the middle of the window to bend the inner glass plate. It may cause a smaller cavity width than near the spacer where the glass is clamped. The shape, size and thickness of the glass will also influence the bending of a glass pane (Feldmeier et al. 1984; Buddenberg et al. 2016; Respondek et al. 2022). To minimize the effect of variation in cavity width due to bending of glass panes, a fixed measuring position in the lower area of the IGU is recommended.
The results of building C indicate no effect of the different measuring spots on the argon concentration, despite differences in cavity width. This finding is to be expected. During a measurement session the absolute amount of gas molecules inside a cavity will remain constant. The argon concentration, alias ratio of argon compared to other gasses will therefor stay constant as well, regardless a potential change in volume or pressure due to bending of the glass.
4.1.6 Sampling side of IGU
The results of building B and the defined sample test show no effect of the measuring side. However, it does not prove that all types of double glazing will have the same thickness and argon measurements regardless the testing side. For example, it is known that the presence of a low-e coating on glass 1æ may have an effect the measured argon concentration (Niiranen et al. 2018). Low-e coatings are a standard part of current insulating glass units. They are developed for the application on glass in IGU’s in order to generate a low thermal emissivity (low-e) and a high light transmissivity (Gläser 2008).
To rule out the effect of differences in argon concentration potentially caused by the sampling side of the IGU, measuring all windows from one side is suggested. Due to practical reasons like dry measuring conditions and easy accessibility, the inside of buildings seems preferable.
4.1.7 Cleanliness measuring device
The results of the defined sample test show that the cleanliness of the Sparklike apparatus may have an effect on the measuring accuracy. Although handling the measuring head of the apparatus with care, the front glass situated in the measuring head, may touch the first glass pane of the IGU during measurement. Possibly, grease on the window could stick on the front glass of the measuring head.
These results show the importance of cleaning the front window of the measuring head regularly. Incorporating a cleaning step in the setup procedure of the device at the start of each measuring day is suggested.
4.1.8 Different measurement sessions
The Sparklike results of the defined sample test show that the 95% confidence interval of the argon gas measurements fit in the declared repeatability of ± 2% by the manufacturer (Sparklike 2021b). It also shows that either the number of repetitive measurements per single panel or the number of different measurement sessions should be carefully selected, in order to enable a reliable statistical comparison of average argon concentration between panels. In the defined sample test the selected repetition of 10 measurements were not sufficient to result in similar averages between measuring sessions of the same sample while using a t-test. A remarkable result if the settlement time of 3 days is enough for a newly produced IGU, that is. Based on these results, more specimens should be tested to understand the requirements for statistics of the Sparklike device.
4.1.9 Glass thickness and cavity width
The results of the defined sample test and in situ tests show that the absolute difference between the highest and lowest thickness value for glass 1æ within a single measuring session measured with the Sparklike was up to 0.2 mm and for the cavity width up to 0.3 mm (Table 6). These results include windows measured on multiple measuring positions and a leak window that contained water and condensation inside. As mentioned before, the various measuring positions could influence the glass thickness and cavity width measured. However, leaving all IGU’s measured on multiple measuring points out of the data set, an absolute difference between the highest and lowest thickness value for a window was still 0.1 mm for glass 1 and 0.3 mm for the spacer. These values are close to the previously mentioned 0.2 mm from general experience in practice.
Table 6 The highest absolute difference between the highest and lowest thickness value of glass 1æ and the cavity width within a single measuring session on a single IGU measured with the Sparklike measured in each test - Full size table
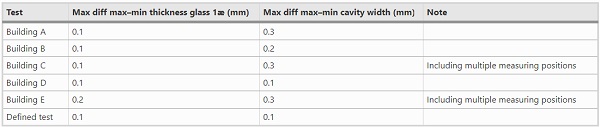
Although building F shows the biggest difference between the highest and lowest thickness value for a window within a single session, incorrect thicknesses measurements causing the difference in argon between the first and following measuring sessions are unlikely. The absolute difference between the highest and lowest thickness value of glass 1æ for each tested window of building F, except for the leak window, were in range with the other in situ tests. The value of the leak window was slightly higher, which could be explained by the different measuring positions on the window pane that were included.
Combining the thickness of the same IGU measured in multiple sessions may cause a higher spread than of each measuring session separately. This can be seen in the results of the defined sample test. Comparison of the deviations of the different windows is omitted, because it is considered less informative due to different sample sizes. The larger the sample set, the smaller the standard deviation of the sampling distribution gets. Based on the current data an absolute difference in cavity width measurements per window per session of up to 0.3 mm is considered reliable.
The results in this study show that product data and a second thickness measuring device can assure the reliability of the Sparklike measurements. Comparison of Sparklike values with product data and Elite values (Table 7) show that using values rounded to mm will show differences up to 1 mm.
Table 7 The glass 1æ thicknesses and cavity widths of the IGU’s per test, including the Sparklike, Elite and product data, and the comparison of the outcomes - Full size table
However, checking the glass thickness and cavity width of future Sparklike measurements on in-use IGU’s is advised to obtain more data on this topic. A double check with product data and a second measuring device seems ideal, because errors could occur due to different reasons, such as (1) application of the wrong product code on the spacer, (2) backwards placement of an IGU with different sized glass panes and (3) disruption of the optical process of a device due to specific materials.
4.2 Proposed screening method
4.2.1 Check the IGU age
In order to obtain indicative information on the remaining service life of the IGU, track down the production date using the spacer code. When a code is missing or does not reveal a production date, the production date may be estimated based on the building year or renovation year of the facade. However, one should be aware that the specific IGU could have a different production date compared to the surrounding IGU’s due to replacement.
As mentioned in the introduction the selected age of interest for the highest level of circular use is 15 years old and younger, based on general expected lifespan. This threshold offers additional benefits in terms of IGU quality, especially for IGU’s applied in Europe. The initial quality of the produced IGU is considered to be decent, because of the rise of CE marking in 2007 and onwards (Glass for Europe 2010, European Parliament and of the Council 2011). Also, the selection of IGU’s with old galvanized steel spacers is ruled out. This is helpful because they tend to start leaking after dismantling (P. Van Dijk, Kenniscentrum Vlakglas, personal communication, March 17th 2023).
In addition, old double glazing may have inferior performing low-e coatings or no coating at all (Gläser 2008, Van de Voorde et al. 2015). So direct re-use is unlikely, because they may not be able to meet the current U-value requirements. Upgrading old double glazing with an extra glass panel could overcome this problem. Although the service life of the old double glazed IGU may increase as climate loads can be reduced by adequate design, making a proper lifetime prediction will be a challenge. Finally, it should be noted that in case methods are developed that enable a life-extension of the moist-tightness of the seal or replacement of desiccants in an intact IGU, the threshold value of the IGU age could be reconsidered.
4.2.2 Argon concentration measurements
Use the Sparklike Laser Portable to obtain argon concentrations of an IGU. Checks of laser current and temperature at the start, during and at the end of a measuring day are recommended. If not performed, or the measured values at the end of the day do not meet the requirements as mentioned in the manual, one should keep in mind that a measured argon concentration might be higher than the actual argon-concentration in the cavity. Measure at least three times on one IGU with a Sparklike Laser Portable. Location of measuring: From the inside of the building at the middle of the lower area of the IGU; the same spot for all IGU’s.
4.2.3 Check outlying data
Outlying Sparklike data should be removed according to the rules set in the method section of this study, which includes:
(a) argon concentration readings higher than 97%
(b) readings that show a glass 1æ thickness which differs more than 1 mm or a cavity width that differs more than 2 mm compared to other values measured in the same session.
4.2.4 Check the argon concentration
Perform an argon quality assessment on IGU’s aged up to 15 years old in order to judge their re-use ability. As mentioned before, the argon quality will provide information on two important IGU characteristics. First of all, it will indicate the decrease in u-value due to the decrease of argon filling. Second, it will provide indirect information on the sealing performance of the IGU. Assessing the argon concentration of IGU’s that show visible condensation or visible deteriorated of an applied coating is not needed because these IGU’s have clearly failed.
In practice, meeting the prescribed level of argon concentration for new well performing IGU means that the post-consumer IGU should contain a tested argon concentration of 85% in order to meet a declared filling percentage of 90%. The gas filling percentage of 90% is a typical declared value (EN1279-3 2012) and obliged in some national assessment guidelines (BRL2202 2012). Because these regulations allow a range of tested argon of concentrations, namely up to − 5% and + 10% compared to the declared value, a post-consumer IGU with a tested argon concentration of 85% or more has a sufficient level of argon filling.
The advantage of a threshold of 85% for direct re-use of post-consumer IGU’s in terms of quality control is that test results of each individual IGU considered for re-use are required and post-consumer IGU with a high gas loss rate will not pass the screening. The older the IGU, the easier a high gas loss rate will be detected. Newly produced IGU’s will not be tested separately. One has to rely on incidental sampling and continuous uniform production process. Unfortunately production errors may occur. Nevertheless a poorly produced IGU’s resulting in a high gas loss rate, will be installed blindly.
4.2.5 Recommended circular strategies for IGU’s
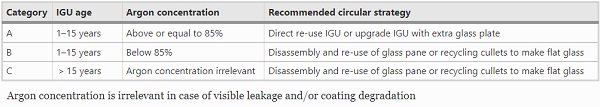
Select the recommended circular strategy for an in-use IGU based on its age and argon concentration using Table 8. The proposed screening method involves three main categories. Each category contains the best circular strategies in terms of circularity. Only high-level circular use strategies are recommend which have already been applied or known to be in development.
Table 8 Recommended circular strategies categorized based on the IGU age and the level of argon concentration - Full size table
4.3 Future developments
The proposed screening method is a first attempt to screen the high level re-use potential of insulation glass in buildings based on age and argon concentration. Future adjustments of the method are expected when the application of re-use strategies for IGU’s proceeds. The speed of implementation depends on the innovation strength of the insulating glass community to overcome hurdles. Limitations of IGU dimensions, proper packaging and forwarding of post-consumer IGU’s, impact of a renewed setting in a different frame are examples of current hurdles. Some recommendations to improve the proposed screening method are:
- Including the type of spacer in category A of the assessment, as psi-values of spacers influences the overall value of the fenestration product (Van den Bergh et al. 2013).
- Including the quality of encountered coatings in category A of the assessment. Possibly, this might also be of interest for category B, when re-use of intact coated glass panes is an established technique.
- Change of measuring devices and methods when collection centra of intact post-consumer IGU’s are common practice. The accessibility of the IGU after removal from the building, makes the use of other measuring devices and methods attractive, such as alternative argon measuring devices. However, for each method also new requirements should be taken into account. For example, when using intrusive measurements devices to analyse the argon concentration, the tiny hole made during the measurement should be closed properly. Or when using an alternative laser device, the possible effect of the laser on a low-e coating should be studied (Sparklike 2021a).
5 Conclusion
A method is developed to screen the high level circular use potential of double glazing in buildings based on their age and argon concentration. Three categories of high level circular strategies are suggested, each with their own threshold values for the product age and argon concentration. The Sparklike Laser Portable is considered to be a suitable device to measure argon concentration for this matter. To avoid substantial measuring errors using this device, a specific handling and data check procedure is recommended.
Data Availability
Spacer codes and building locations are not shared openly, to avoid unbalanced product information. Secondary data and original Elite data are included in this research. The original Sparklike data are provided as supplementary data.
References
Acknowledgements
The authors thank all individuals that enabled the measurements on site, in particularly Iratxe Jaio, Mikko Suomi and Peter van Dijk. The authors also thank the consortium members of this project, with a special thanks to Ayrox srl, Ben Evers Glasindustrie, HvA Facility Services, Kenniscentrum Glas, Sparklike Oy and Rijksvastgoedbedrijf (The Central Government Real Estate Agency). This publication is part of the project Hergebruikt isolatieglas (with projectnumber P.0002690621) of the research program RAAK-MKB, which is partly financed by Regieorgaan SIA, part of the Dutch Research Council (NWO).
Author information
Authors and Affiliations
- Faculty of Technology, Amsterdam University of Applied Sciences, Rhijnspoorplein 2, 1091 GC, Amsterdam, The Netherlands - E. J. van Nieuwenhuijzen, J. I. A. Tetteroo & E. Melet
- Peutz, PO Box 696, 2700 AR, Zoetermeer, The Netherlands - M. van de Vliet
Corresponding author
Correspondence to E. J. van Nieuwenhuijzen.


.")


Comments
Exploring the re-use potential of insulating glass in buildings presents a valuable opportunity to advance sustainability goals within the construction industry. This approach aligns with the principles of the circular economy, where materials are kept in use for as long as possible, thereby reducing the need for new production and minimizing energy consumption. more information