Authors: Yangjie Shi, Xiaobo Xi, Yifu Zhang, Haiyang Xu, Jianfeng Zhang and Ruihong Zhang
Source: Energies 2021, 14(18), 5769; MDPI
DOI: https://doi.org/10.3390/en14185769
Abstract
In this paper, a prediction method of the heat transfer coefficient of composite vacuum glazing (CVG) is proposed. By analyzing the heat transfer process of CVG, the theoretical calculation formula for the heat transfer coefficient of CVG is established. CVG temperature variation under the test conditions specified in the national standard is simulated using ANSYS. The CVG heat transfer coefficient is calculated by combining the theoretical formula and simulation results. The simulation results are then verified by comparison to a physical experiment. The results show that the deviations between the experimental and predicted values are ≤3.8%, verifying the accuracy of the simulation results and proving that the model can be used in engineering practice.
Furthermore, the effects of different coating positions on the heat transfer performance of CVG are studied. The results show that different coating positions have a significant impact on the heat transfer coefficient of CVG. The heat transfer coefficient is shown to be lowest to highest under the following conditions: when the Low-E coatings are located on both sides of the vacuum layer (2LC-V), followed by Low-E coatings on the side of glass pane II near the vacuum layer (1LC-V), Low-E coatings located on the side of glass pane I near insulating layer (1LC-I), and finally, when there are no Low-E coatings (NLC) on the glass panes. Overall, this model is an effective and accurate analysis method of the heat transfer coefficient.
1. Introduction
The energy lost by windows accounts for 45–50% of a building’s energy consumption. It is a critical medium of heat exchange in a building. The glass is the most prominent structural part of a window and has a considerable impact on the energy consumption of the building, especially with the wide application of large ground windows in recent years [1,2]. Applying energy-saving glazing to windows is vital to reduce building energy consumption [3,4].
Currently, two widely used energy-saving glazing products are insulating glazing and vacuum glazing [5,6]. Insulating glazing is generally composed of two or more glass panes with internal gas layers between them. The gas is typically argon, krypton, or xenon, although it can vary. The insulating performance of insulating glazing is better than that of ordinary flat glazing because the thermal conductivity of the internal gas layer is much lower than that of glass. This technique is widely used in various buildings because of its simple manufacturing process and good safety performance [7,8]. Vacuum glazing requires more parts than insulating glazing, with two glass panes and regularly-arranged support pillars surrounded by sealing solders. The vacuum is formed by heating and vacuum-pumping in a vacuum furnace. This technique has distinct thermal insulation properties compared to other types of glass because of the existence of the vacuum layer. However, due to the support pillars, its impact resistance cannot meet the requirements of safety glass standards. Therefore, it cannot be directly used as a glass curtain wall for high-rise buildings and other settings requiring safety glass [9,10,11].
To further improve the thermal insulation performance of glass, researchers have manufactured various types of multiple glazing units (MGU) based on combinations of insulating glazing and vacuum glazing, creating combinations such as insulating + insulating, vacuum + vacuum, and so on. Experiments have been conducted to test their performance. For example, Minxi Bao et al. [12] proposed a novel hybrid vacuum/triple glazing unit with pressure equalization design, and analyzed its mechanical properties. Laura Galuppi et al. [13] followed up and examined the influence of the structural parameters on the load sharing of multiple insulating glazing units through Green’s functions. Fang Y et al. [14] presented a method of predicting the thermal performance of vacuum glazing by using two-dimensional (2-D) finite element and three-dimensional (3-D) finite volume models. The results showed that the experimentally determined overall heat transfer coefficient and temperature profiles along the central line of the vacuum glazing agreed well with the predictions made using the 2-D and 3-D models. Fang Y et al. [15] analyzed the influence of the structural parameters on the thermal performance of triple vacuum glazing using simulations.
The results indicated a relatively significant increase in the overall thermal conductance of glazing without a frame when the width of the indium edge seal increased beyond a certain value. Mert Tükel et al. [16] investigated the effect of the thickness of the air layer between the glass, the glass coating emissivity, and the number of panes on the flow and heat transfer characteristics in a glazing roof system, and evaluated the thermal performance using the overall heat transfer coefficient and inner surface temperature. Michele Zinzi et al. [17] measured the solar and thermal properties of several solutions of glazing units with in-gap shading devices using an advanced experimental setup and numerical analyses to estimate the impact of this technology on the energy performance of office buildings. Guohui Gan [18] proposed a method for predicting the convective heat transfer coefficient, thermal resistance, and thermal transmittance for a double-glazing unit using computational fluid dynamics (CFD). The result showed that the predicted thermal resistance agreed with reference data.
The above studies essentially determined the reliability of the mechanical properties of the MGU and conducted in-depth research on its heat transfer performance. A series of theoretical calculation methods and prediction models were proposed. However, these studies were confined to ‘insulating + insulating’ and ‘vacuum + vacuum’ combinations of MGUs, and rarely involved a ‘vacuum + insulating’ combination, in particular, with composite vacuum glazing (CVG). Compared with the above two forms of MGUs, CVG is a compromise; it has the excellent performance of both vacuum and insulating glass, yet is easier to prepare.
Therefore, this paper focuses on the heat transfer performance of CVG. Here, we propose a prediction model to assess the heat transfer coefficient (U-value) of CVG. Due to numerous factors that can affect the U-value of CVG, it is difficult to obtain an accurate U-value through theoretical calculations, and the costs of large-scale physical tests are high. Therefore, the model is based on a combination of numerical simulations and theoretical calculations. The accuracy of the prediction method was then verified by comparison with the thermal performance experiment results. This model aims to provide theoretical guidance for the design and manufacture of CVG for both large- and small-scale implementation.
2. Materials and Methods
2.1. Heat Transfer of CVG
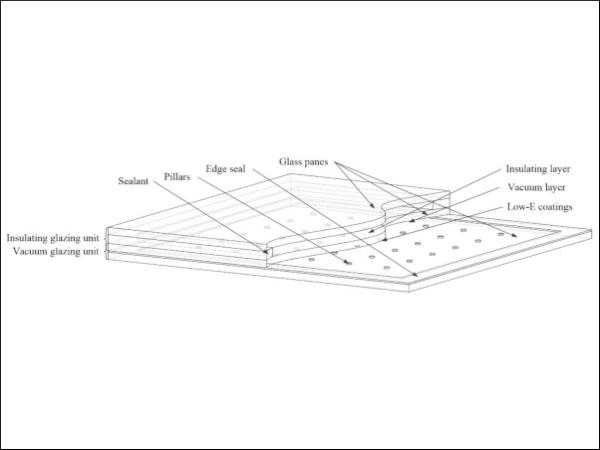
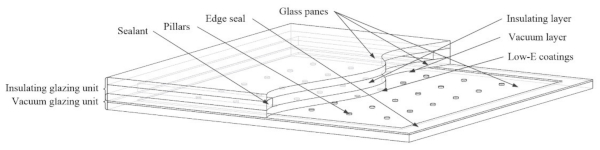
CVG is made by adding a glass pane on the basis of the vacuum glazing which has been sealed and formed, in which the middle part is separated by sealant and filled with an inert gas (argon, krypton or xenon; the former was applied in this paper). It is a typical three-glass–two-cavity structure. Its internal cavity is divided into two parts: an insulating layer and a vacuum layer. It is equivalent to the combination of one vacuum glass unit and one insulating glass unit. The thickness of the insulating layer is generally 6–24 mm, and the thickness of the vacuum layer is generally 0.1–0.3 mm. In practical use, at least one piece of glass is coated with low emissivity (Low-E) coating(s) to improve its thermal performance [19]. The Low-E coatings described in this paper are all single silver (Ag). The coatings are divided into three layers: oxide, functional and electrolyte. They are prepared by sputtering SnO2 and Ag onto an ordinary soda lime glass substrate by vacuum magnetron sputtering coating technology. The Ag functional layer reflects more than 85% of medium and far infrared thermal radiation. At the same time, more than 75% of visible light passes through. The general structure is shown in Figure 1.
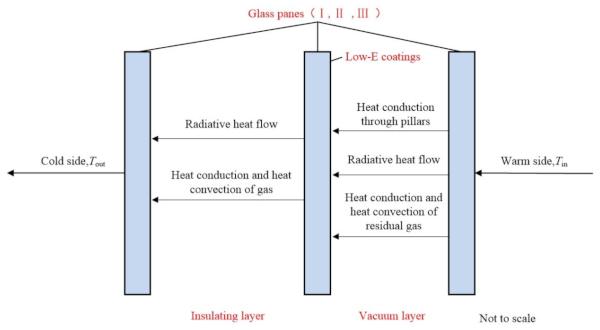
In this paper, the heat transfer research of CVG refers to the heat transfer in the central region of CVG, not the central point. Due to the unique structure of CVG, the heat transfer process in the central region combines vacuum glazing and insulating glazing characteristics. The heat transfer in the central region of the vacuum glazing is mainly composed of radiative heat flow, heat conduction through pillars, and heat conduction and convection of the residual gas. The heat transfer in the central region of the insulating glazing mainly consists of radiative heat flow, and heat conduction and convection of gas [20]. To simplify the calculations, the following assumptions were made:
- All the materials are homogeneous, and the thermal conductivity does not change with temperature. The internal temperature of each joint is the same, regardless of the temperature gradient in the horizontal and vertical directions, so the surface temperature of the inner and outer sides of each glass joint is the same. The 2-D heat transfer model can be used for calculation and analysis because the heat conduction along the vertical height direction of each structural layer is ignored. Furthermore, the heat conduction between adjacent nodes in the same structural layer in the vertical direction is not considered.
- In the range of daily temperature and temperature difference, the wavelength of thermal radiation is in the far-infrared band of 4–40 μm. The Soda-lime glass is essentially opaque in this band. Therefore, it is not necessary to consider the influence of radiation through the first glass pane on the third glass pane when calculating the radiation heat transfer of CVG. Rather, the radiant thermal resistance of the glass panes can be calculated in sections [21]. The heat transfer mechanism of CVG is shown in Figure 2.
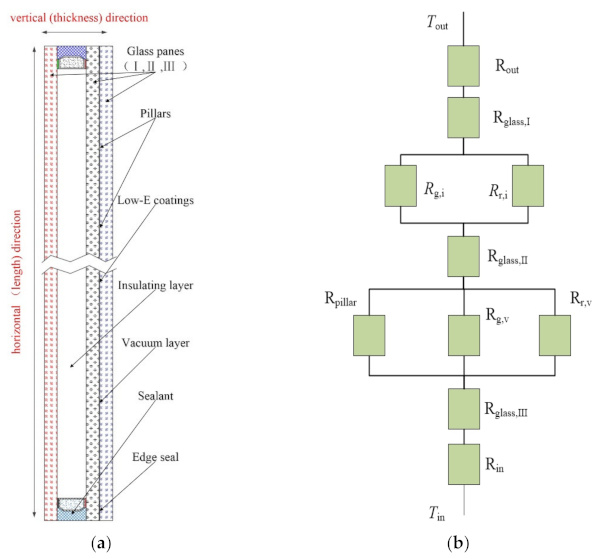
- The heat transfer of the support pillars in the central region is considered the same because of the symmetry of the CVG structure. The heat transfer in the central region is symmetric in its length and thickness. Therefore, the CVG model can be simplified as a unit model in the simulation analysis, as shown in Figure 3a.
2.2. Theoretical Calculation of U-Value
The U-value generally refers to the heat transfer coefficient in the central region of a glass system without solar radiation. A smaller U-value indicates better thermal insulation performance.
The analysis of thermal resistance composition is the basis of the present theoretical calculation. Heat in the central region of CVG needs to pass through three panes of glass, the vacuum layer, and the insulating layer, be it from the warm side to the cold side or vice versa [20]. A schematic diagram of the thermal resistance composition in the central region is shown in Figure 3b.
The thermal resistance per unit area of the glass sheets can be calculated by Equation (1) [20].

where λglass is the thermal conductivity of glass, and W m⁻¹ K⁻¹; tglass is the glass thickness, m.
The thermal resistance to radiative heat from the vacuum layer is determined by Equation (2) [20].
![]()
where Tv is the average absolute temperature of the two inner surfaces of the vacuum layer, K; εe,v is the effective surface emissivity, calculated by 𝜀e,v=(𝜀⁻¹₁+𝜀⁻¹₂−1)⁻¹, and ε1 and ε2 are the emittances of two inner surfaces of the vacuum layer; σ is the Stefan-Boltzmann constant, i.e., 5.67 × 10⁻⁸ W m⁻² K⁻⁴.
According to the heat transfer theory of thin gas, if the air pressure in the vacuum layer is less than 0.1 Pa, the internal residual gas is in a free molecular heat conduction state. The heat transfer is due to the collisions between the residual gas molecule and the glass [19]. Therefore, the thermal resistance of the residual gas in the vacuum layer is determined by Equation (3) [20].

where α is the gas comprehensive adaptation coefficient; γ is the gas heat capacity, J kg⁻¹ K⁻¹; R is the molar gas constant, J mol⁻¹ K⁻¹; P is the residual gas pressure (Pa); and M is the molar mass of gas, kg mol⁻¹.
The thermal resistance of the support pillar in the vacuum layer is determined by Equation (4) [20].

where r is the radius of the support pillar, m; a is the support pillar spacing, m; h is the support pillar height, m; and λpillar is the thermal conductivity of the support pillar, W m⁻¹ K⁻¹.
The radiative thermal resistance of the insulating layer is determined by Equation (5) [20].
![]()
where Ti is the average absolute temperature of the two inner surfaces of the insulating layer, K; εe,i is the effective surface emittance calculated by 𝜀e,i=(𝜀⁻¹₃+𝜀⁻¹₄−1)⁻¹; and ε3 and ε4 are the emittances of the two inner surfaces of the insulating layer.
The heat transfer resistance of the gas in the insulating layer is determined by Equation (6) [20].
![]()
where tg,i is the gas thickness of the insulating layer, m; Nu is the Nusselt number; and λg,i is the thermal conductivity of the insulating layer gas, W m⁻¹ K⁻¹.
The CVG is usually placed vertically, so Nu can be calculated by Equation (7) [20].
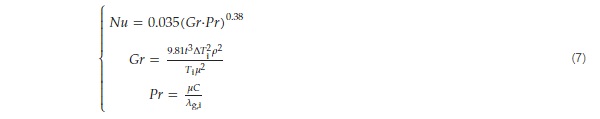
where Gr is the Grashof number; Pr is the Prandtl number; t is the thickness of the insulating layer, m; ∆Ti is the difference of temperature between the two inner surfaces of the insulating layer, K; ρ is the density, kg m⁻¹ s⁻¹; μ is the dynamic viscosity, kg m⁻¹ s⁻¹; and C is the specific heat capacity, J kg⁻¹ K⁻¹. If Nu is less than 1, then the Nu number was set at 1.
According to the CVG thermal resistance, as shown in Figure 3b, the total thermal resistance of CVG (Rtot) is determined by Equation (8).

The thermal resistance of the warm side (Rwarm) and cold side (Rcold) of the glass surfaces is the reciprocal of the convective heat transfer coefficient of the other glass surface (hwarm and hcold), i.e., Rwarm = 1/hwarm, Rcold = 1/hcold. Therefore, the total heat transfer coefficient in the central region of the CVG (Utot) is determined by Equation (9).
![]()
2.3. Numerical Simulation
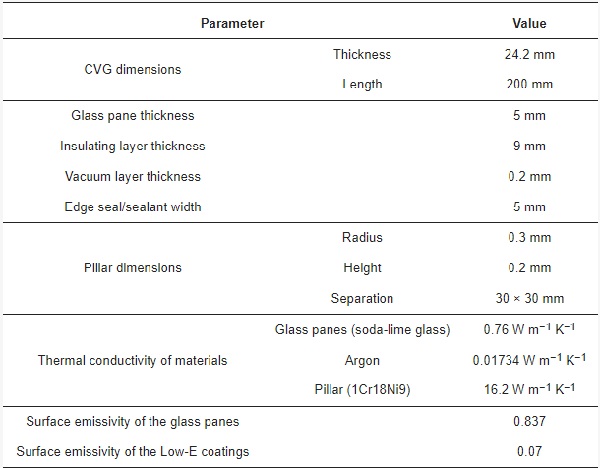
The primary function of the simulation is to determine the temperature of the two inner surfaces of the vacuum layer and the insulating layer to calculate the heat transfer coefficient according to Equations (1)–(9). In this paper, a 2-D heat transfer model was used to analyze the heat transfer of the CVG. Due to the fact that the test conditions of WINDOW (LBNL) do not meet the requirements specified in Chinese standards, the finite element model shown in Figure 4 was established using the ANSYS software. The model parameters are shown in Table 1.
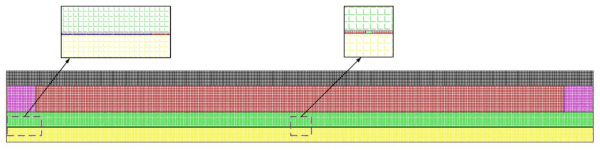
Table 1. Parameters of the CVG model.
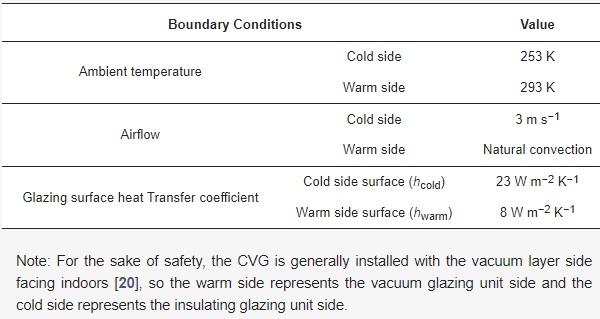
Due to the pressure in the vacuum layer being less than 0.1 Pa, the heat transfer of the residual gas in the vacuum layer is very small. To reduce the number of calculations, this parameter was not considered in the simulation. The GAMBIT software was used for mesh generation. A quadrilateral mesh was selected with a size of 0.5 mm × 0.5 mm, and the mesh of the contact part was further refined. The orthogonal deflection value of the divided grid was 0, and the orthogonal quality value was set to 1, providing suitable grid quality. The solver type was based on the pressure change, absolute velocity, steady state, and 2D plane solver. The boundary conditions of the CVG shown in Table 2 were determined according to the Industrial Standards of the People’s Republic of China “Technical Specification for Application of Architectural Glass” (JGJ 113-2015) [22].
Table 2. Boundary conditions of the CVG model.
The momentum equation used the Boussinesq model to consider the influence of natural convection on fluid momentum. The discrete propagation radiation model (DTRM) was selected as the radiation model. The default solution equation was the energy equation of the flow equation. The pressure velocity coupling equation was solved by the SIMPLEC algorithm, PRESTO! format was chosen for the pressure interpolation scheme, and the discrete equation was established using the QUICK format. The relaxation factors of the pressure term, momentum equation, and energy equation were set to 0.3, 0.7, and 0.8, respectively. The relaxation factors of other parameters were set to 1. The monitoring surfaces were set in the center of the model (mid), the axis position of each support pillar (pillar), and the inner and outer sides of the edge seal/sealant material (edge 1, edge 2) to monitor the temperature change of each surface along the thickness direction [23].
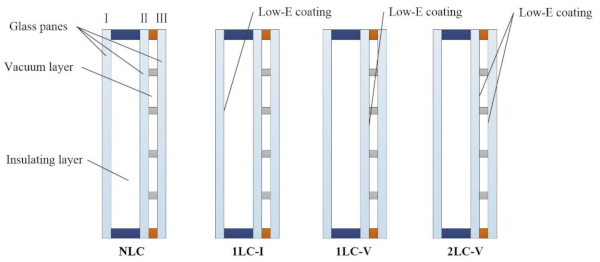
To concurrently study the influence of the location of the Low-E coatings on the heat transfer of CVG, the following four cases were simulated: (1) without Low-E coatings (NLC); (2) Low-E coatings located on the side of Glass pane I near the insulating layer (1LC-I); (3) Low-E coatings located on the side of Glass pane II near the vacuum layer (1LC-V); and (4) Low-E coatings located on both sides of the vacuum layer (2LC-V). Schematic diagrams of the above four conditions are shown in Figure 5. The boundary conditions and other parameters of the simulation analysis were consistent with the above.
2.4. Thermal Performance Experiments of CVG
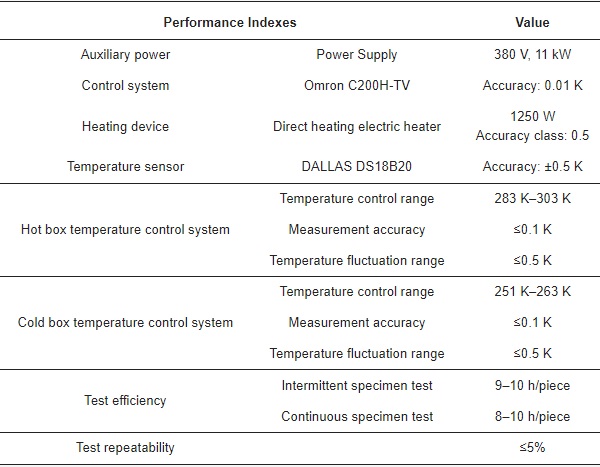
The CVG thermal performance test was performed according to the National Standard of China “Test Method for Thermal Insulating Performance for Building Exterior doors and Windows” (GB/T8484-2020) [24]. The test was performed on 20 December 2020, in Jiangsu Construction Engineering Quality Testing Center Co., Ltd. The detection device was the IMMCB-1818X testing equipment for thermal insulation performance of building doors and windows, produced by IMPAL (Tianjin) Measurement and Control Equipment Co., Ltd., Tianjin, China. The structure of the detection device is shown in Figure 6. The performance indexes of the equipment are shown in Table 3.
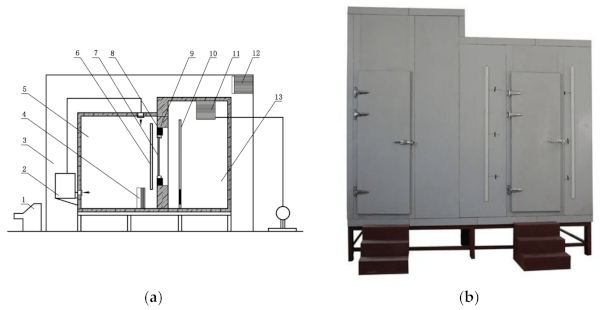
Table 3. The performance indexes of the IMMCB-1818X testing equipment.
The test method is based on the principle of steady-state heat transfer. One side of the specimen is a hot box to simulate indoor, heated air conditions in the winter. The other side is a cold box to simulate the outdoor temperature and air velocity. The gap of the test piece is sealed, and a stable air temperature is maintained throughout the experiment. Therefore, the airflow velocity and heat radiation on both sides of the test piece can be measured, along with the heating capacity of the heating device in the heat box per unit time minus the heat loss through the heat box wall, test piece frame, filler plate, test piece, and filler plate edge. The heat transfer coefficient of the test piece (door or window) can then be calculated by dividing the product of the test piece area and the air temperature difference on both sides. The heat transfer coefficient of the specimen (Uexperiment) can be calculated by Equation (10)
![]()
where Q is the heating power of the heating device, W; M₁ is the heat flux coefficient of the hot box wall determined by the calibration test, W K⁻¹; ∆θ₁ is the in the of weighted average temperatures between the inner and outer surface areas of the hot box wall, K; M₂ is the heat flux coefficient of the specimen frame determined by the calibration test, W K⁻¹; ∆θ₂ is the difference in the weighted average temperature between the inner and outer surface areas of the specimen frame, K; S is the area of the filler plate, m²; Λ is the heat transfer coefficient of the filler plate, W m⁻¹ K⁻¹; ∆θ₃ is the average temperature difference between the hot side and cold side of the filler plate, K; A is the area of the specimen, m²; Tw is the air temperature of the warm side, K; and Tc is the air temperature of the cold side, K.
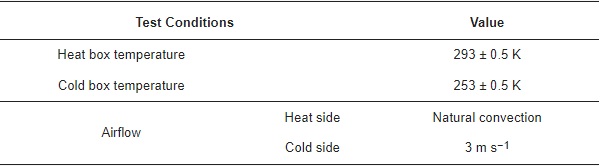
The parameters of the specimens are shown in Table 4. The settings of the test conditions are listed in Table 5.
Table 4. Parameters of specimens.
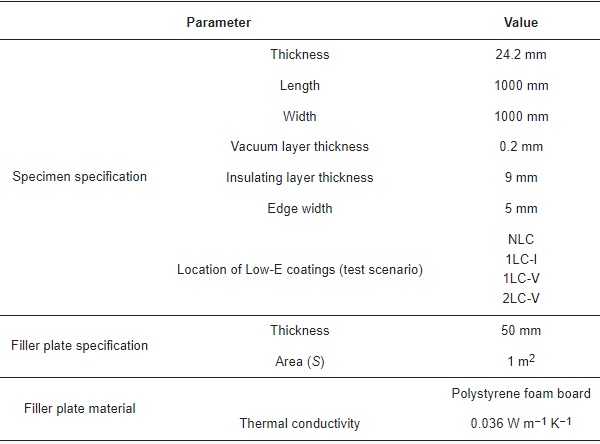
Table 5. Thermal performance test conditions.
Before the experiment, it is necessary to determine the heat flux coefficient of the hot box wall and the specimen frame, which is obtained through the calibration test specified in the standard (GB/T8484-2020). Since the calibration test was carried out during the calibration cycle of the equipment, the previously calibrated data are directly used in this paper [25], where M₁ = 8.659 W K⁻¹, M₂ = 1.039 W K⁻¹.
During the experiment, the specimen is placed on the specimen frame and sealed (the large gap is filled with filler plate and then sealed with sealant). The temperature measuring thermocouple is evenly arranged on the inner and outer wall surface of the hot box, the hot side surface and the cold side surface of the specimen frame and the filler plate, and is pasted with tin foil transparent tape. When the heat transfer process is stable, temperature sensor data is collected every 30 min, measuring six groups in total. The average value of the corresponding difference between the two groups of data is used as the input of ∆θ₁, ∆θ₂, and ∆θ₃.
3. Results and Discussion
3.1. Analysis of the CVG Simulation Results
Figure 7 shows the temperature distribution of CVG without Low-E coatings, and Figure 8 shows the temperature variations of the central region, edge seal/sealant region, and support pillars region along the thickness direction. The temperature changes of the warm and cold side surfaces of the glass panes were even in the central region of CVG (line mid) throughout the simulated time frame, except for the large temperature drop between the insulating layer and vacuum layer. The main reason for the breakpoint of the temperature change at the vacuum layer is that the heat transfer of the residual gas is ignored in the simulation. There is no heat conduction and convective heat transfer except the radiation heat transfer in the vacuum layer. The heat exchange mainly occurs in the support pillars and the edge seal region. The temperature distribution around the support pillars is a concentric isothermal zone with its own center and outward diffusion.
The temperature change at the support pillars (line pillar) is nonlinear. The temperature gradient increases closer to the support pillars, indicating that a large amount of heat exchange occurs through this region. The high thermal conductivity of the edge seal/sealant region greatly influences the nearest support pillar. This has little influence on the temperature distribution of the support pillars in the central region. The temperature change outside the edge seal/sealant region (line edge 1) is piecewise linear, indicating that the heat is transferred through conduction. The different slope of line edge 1 compared to the others indicates that heat is transferred by materials with varying values of conductivity. The temperature inside the edge sealing area (line edge 2) changes linearly along the thickness direction, indicating that heat is transferred through conduction in the region of the thickness of the glass panes.
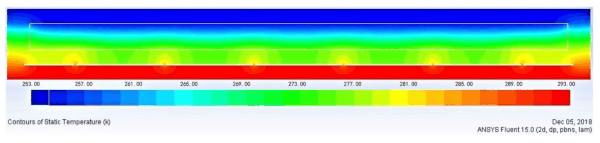
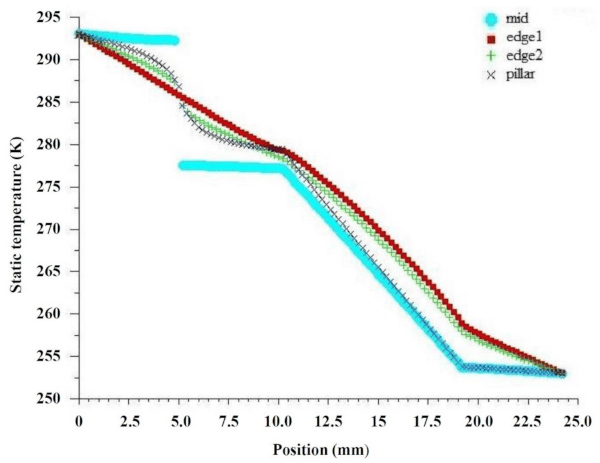
Figure 9 shows the temperature distribution of CVG with Low-E coatings located in various positions. By comparing Figure 7 and Figure 9a, it may be seen that there is little influence on the heat transfer performance of CVG with Low-E coatings in the insulating layer, and that there is no significant difference in temperature change among the different regions. The Low-E coating appears to have little influence on the system in this scenario. This is because the vacuum layer blocks most of the heat transfer, leading to a smaller temperature difference between two inner surfaces of the insulating layer and reducing radiation heat transfer intensity.
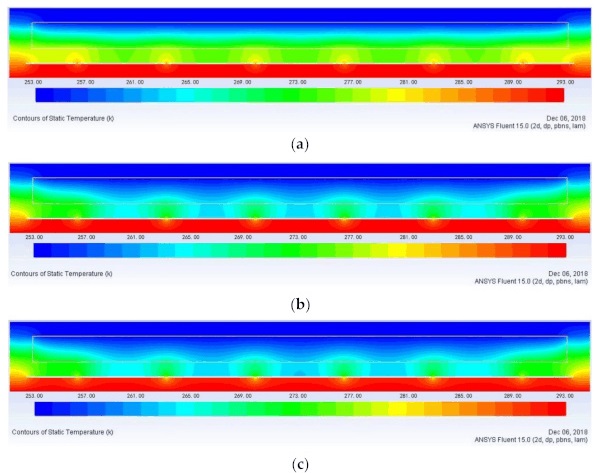
Comparing Figure 7 with Figure 9a,b, there is a significant influence on the heat transfer performance of CVG with Low-E coatings in the vacuum layer, but little impact on the edge sealing/sealant regions. Comparing with Figure 9a–c, the different locations of the Low-E coating have different effects on the heat transfer performance of CVG. 1LC-V and 2LC-V are noticeably better than 1LC-I, while 2LC-V is better than 1LC-V.
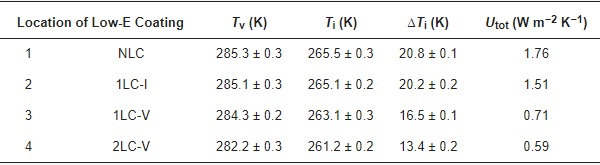
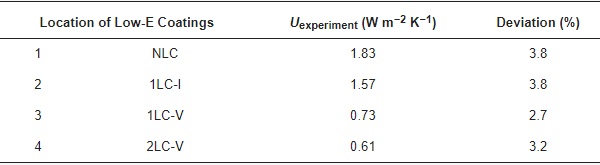
The residual air in the vacuum layer has a composition similar to that of air. Thus, α = 0.5, γ = 1.4034, R = 8.314 J mol⁻¹ K⁻¹, M = 28.96 × 10⁻³ kg mol⁻¹. The gas in the insulating layer is argon, where ρ = 1.669 kg m−3, μ = 2.164 × 10⁻⁵ kg m⁻¹ s⁻¹, and C = 0.519 × 10³ J kg⁻¹ K⁻¹. The two inner surface temperatures of the vacuum and insulating layers were obtained using the simulation. The heat transfer coefficient was calculated by substituting the parameters into Equations (1)–(9). The results are shown in Table 6. The different positions of the Low-E coating have a significant effect on the heat transfer coefficient of CVG when comparing Utot. The heat insulation performance is the most significant for scenario 2LC-V, followed by 1LC-V, 1LC-I, and finally NLC.
Table 6. Simulation results of the surface temperature and heat transfer coefficient of CVG with different positions of the Low-E coatings.
The use of Low-E coatings significantly reduces the heat transfer coefficient of CVG, mainly due to the increase in radiant thermal resistance. The increase of Rtot of the Low-E coating on the inner side of the vacuum layer is higher than that on the inner side of the hollow layer. Therefore, the U-value under scenario 1LC-V is lower than that under 1LC-I. Although far-infrared radiation cannot pass through the soda-lime glass, it can be absorbed by the glass, resulting in an increase of the glass temperature. The heat would then dissipate outward in the form of radiation and convection. The high absorptivity and low reflectivity of the glass panes to far infrared radiation is the fundamental reason for the heat loss of the warm side. The use of Low-E coatings can block this heat loss path by reducing glass absorptivity and improving reflectivity.
3.2. Comparison of the Thermal Performance Experiment and Simulation Results
The Uexperiment test results of thermal performance experiments are shown in Table 7. The Uexperiment is generally greater than the Utot (Table 6). By calculating the deviation using Uexperiment as the standard, the deviation between Uexperiment and Utot ranges from 2.7 to 3.8%. These results are considered to be acceptable for engineering applications. The leading cause for the variation between Uexperiment and Utot is that the structure of the CVG system is simplified in the simulation. The influence of the heat conduction of the edge seal and sealant on the heat transfer in the central region was also not considered, creating the discrepancy between Utot and Uexperiment.
Table 7. Uexperiment test results and the deviation between Uexperiment and Utot calculated in the simulation results.
4. Conclusions
This paper described a theoretical analysis and finite element model of heat transfer which analyzed the heat transfer characteristics and thermal resistance component of a CVG system. The heat transfer coefficient of the CVG was predicted by combining a simulation analysis and theoretical calculations. The accuracy of the prediction method was then verified by comparing the results with the thermal performance physical test results. The results indicated that the deviations between Uexperiment and Utot were ≤3.8% for the different scenarios, which shows that the prediction method has high accuracy and can be used to test different system setups. The main reason for the deviation is that the simulation simplified the structure of CVG and did not consider the influence of the edge seal and sealant on the heat transfer in the central region of CVG. The model also ignored the heat transfer of the residual gas in the vacuum layer.
In addition, the influence of different positions of the Low-E coatings on the heat transfer performance of CVG was analyzed. The results showed that different placement positions of the Low-E coating had a significant effect on the heat transfer coefficient of CVG. Low-E coatings located on both sides of the vacuum layer (2LC-V) had the best heat insulation performance, followed by Low-E coatings located on the side of Glass pane II near the vacuum layer (1LC-V), Low-E coatings located on the side of Glass pane I near the insulating layer (1LC-I), and finally without Low-E coatings (NLC).
Overall, the feasibility of applying the 2-D heat transfer model to the analysis of the heat transfer process of composite vacuum glass was verified by comparing the simulation results with thermal performance physical experiments, which showed that the heat transfer coefficient prediction combining simulation with theoretical calculation can be applied to engineering practice. However, this research was performed without any consideration on the applicability of the prediction under different thicknesses of the glass panes, different thicknesses of the insulating/vacuum layer, other specifications and arrangements of the support pillars. In addition, different regulations on the measurement of the U-value in various countries will also give rise to some differences in prediction results. Further work is needed to demonstrate the full range of applications of this model.
Author Contributions
Conceptualization, Y.S. and X.X.; methodology, Y.S., X.X. and Y.Z.; software, Y.S., X.X. and Y.Z.; validation, Y.S., X.X., Y.Z. and J.Z.; formal analysis, Y.S. and Y.Z.; investigation, Y.S., Y.Z. and H.X.; data curation, Y.S. and H.X.; writing—original draft preparation, Y.S.; writing—review and editing, Y.S. and X.X.; visualization, X.X., J.Z. and R.Z.; supervision, X.X., J.Z. and R.Z.; project administration, J.Z. and R.Z.; funding acquisition, X.X. and R.Z. All authors have read and agreed to the published version of the manuscript.
Funding
This project was supported by the National Natural Science Foundation of China (Grants Nos. 51772264 and 51902284), the Science and Technology Project of Yangzhou City (YZ2020017).
Institutional Review Board Statement
Not applicable.
Informed Consent Statement
Not applicable.
Data Availability Statement
Not applicable.
Acknowledgments
The authors would like to thank the technical support of their teachers and supervisors. We also appreciate the assistance provided by the team members during the experiments. Moreover, we would like to thank the Yingtai Group Co., Ltd. for manufacturing the glass. Additionally, we sincerely appreciate the work of the editor and the reviewers for their suggestions and work to better this paper.
Conflicts of Interest
The authors declare no conflict of interest.


.")