Authors: Marius Müller, Stefan Reich, Christian Pfütze & Ingo Stelzer
Source: Glass Structures & Engineering (2024)
DOI: https://doi.org/10.1007/s40940-023-00246-9
Abstract
The damaging of color pigments under UV radiation, usually called fading, is known, the most common is the loose of color intensity of clothes. A high UV-resistance of window and façade glazing is urgent for the conservation and preservation of historical exhibits and interiors. In this contribution, a long-lasting natural weather testing of several glass types, mostly LSG with different interlayer materials, and the effect of the different color patterns of paper and textile specimens are presented. According to the Harrison damage function, the initial damage level starts at 500 nm wavelength. Therefore, besides standard PVB-interlayer (UV-blocking from 360 to 380 nm wavelength) also special UV-blocking interlayer (UV-blocking from 400 nm) are part of the study. The research was conducted over the full summer of the year 2021.
The assessment of the fading effect was measured as color spacing according to the CIELAB color space and verified by human eye perception. The CIELAB color space is the most used color system and combines brightness, yellow-blue and red-green tones. The research shows a significant effect of different glass build-ups on the color spacing value, especially for medium-sensitive pigment papers and textiles. Furthermore, the color shifting of single color scale samples showed demonstrated the limitation of the color spacing value of the CIELAB color space versus the human eye perception.
1 Introduction to color fading protection in conservation
Almost all substances change their properties over their lifetime and are thus affected by the natural aging process, which is caused by their respective environmental influences. However, organic ones are particularly vulnerable, as they are broken down as nature intended for recycling. But even inorganic materials are not necessarily permanent. Their material change is simply much slower. The main goal of the conservation policy is the strong delay of such processes. In terms of damage from light, the most successful preservation of many materials would be a non-irradiation environment (CIE157 2004).
Everyone knows the effect that solar radiation has on the skin in the form of sunburn or on objects in our environment. Be it a photo, a piece of furniture, or a piece of clothing. Over time, they begin to fade or change color. The color intensity decreases and the dark turns gray. This can end in losing any color pigment. The UV-radiation that occurs naturally in sunlight plays a significant role here.
Museums and stores with carpets or clothes in shop windows in particular have to struggle with this phenomenon. When a new museum is built, there are usually no windows or only a few are arranged in such a way that no damage can occur from natural sunlight. Since the sensitive pictures created with the artist's colors (mostly naturally or synthetically organic) are in the shade or are only exhibited in separately protected interior rooms. In the field of monument preservation, this usually cannot be implemented and buildings with projecting wall openings are rarely replanned, although these are ideally suited to the floor plan structure and would be used sensibly.
While museums were forced to take UV protection very seriously, it was largely ignored in the field of monument preservation. In the meantime, a change in thinking can also be observed here, because sensitive furnishings such as canvas paintings, textiles, pieces of furniture, (wall) carpets, plastics, and panel paintings suffer from the effects of radiation. For example, with some restorations or redesigns of the windows, the main focus is now on modern light protection. It should be noted here that damage caused by the irradiance of global radiation and IR-radiation is also considered.
In the case of light protection systems, preference is increasingly being given directly to the glass plane. This makes sense as there are normally no aesthetic impairments or structural changes that could falsify the design and overall impression of the building as blinds, folding shutters or curtains do. Most film-based protection systems are applied either to the existing pane or as interlayer foil between two glass panes of a LSG. Another solution is offered by functional glasses, which have direct protective properties (Löther 2021). This can be achieved with tinted or coated glass panes, but for monument preservation, the latter in particular distorts the building's aesthetics due to the reflecting glass surfaces.
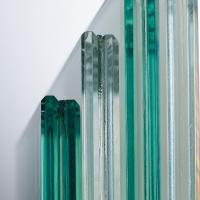
UV protective films, which function as a kind of roller shutter system or subsequently laminated to the window glass, are already well known and have also been tested for years to specify their long-term behavior (Löther 2021). It is relevant taking care to ensure that these films filter out up to 99% of harmful UV-A radiation, as well as light in the short-wave visible range up to 400 nm (Naumović 2021). The already mentioned target groups of such films need a certain safety standard anyway to be able to protect their goods. Regarding the glazing function, predominately laminated safety glass (LSG) is applied. The build-up of LSG consists of at least one interlayer foil between two glass panes.
The question therefore arises as to whether conventional laminated safety glass can already filter out the harmful radiation that is dangerous for preserved goods? Or is there a significant benefit filtering extra 20 nm from the visible light spectre for improved color fading protection in conservation?
These questions are investigated in a natural weathering study on conservation and monument preservation related color types.
2 Background
2.1 Photochemical processes of color fading
The energy input resulting from the incident radiation can be absorbed or reflected by the molecules. If the radiation energy is absorbed, effects such as heating and fluorescence can occur in addition to different chemical reactions, each of which leads to material damage. In general, these processes are referred to as photochemical decomposition. In order to react with another molecule, a certain minimum energy is required for the respective molecule. The respective dissociation (energy difference between two energy levels of a molecule) energy differs from molecule to molecule (Herzberg 2014).
When the absorbed photon energy is equal to or greater than the required dissociation energy, the molecule is placed in an excited state (Fig. 1). In this state, the supplied energy can be released exothermically or fluorescently, for example, transferred to another molecule. In order for the molecule to reach a lower and thus stable energy level, it is also possible that only part of the energy is released for this purpose. Later, the remaining energy is completely released. The supplied energy can also break molecular bonds, also called photolysis.
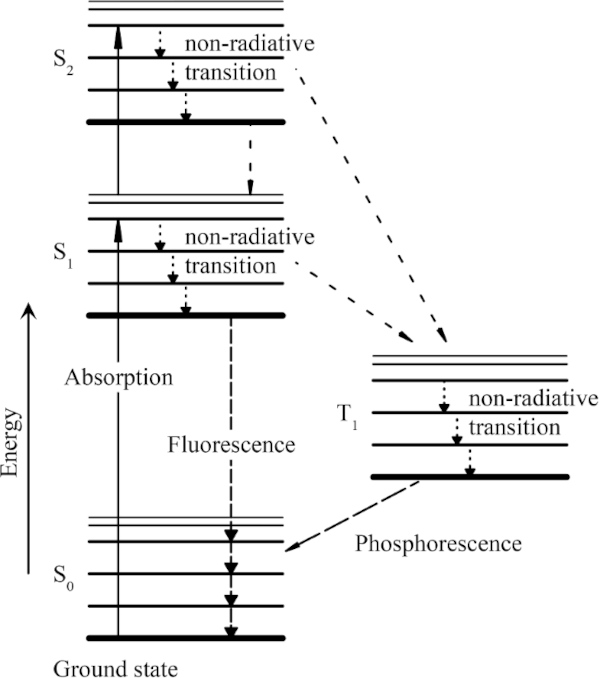
This results in chemical changes to the molecule. In comparison, this process does not appear to be very probable. However, if a molecule has reached a relatively stable excited level and cannot release the absorbed energy within a microsecond, the probability of a photochemical reaction increases rapidly (Schaeffer 2001).
More commonly, however, decomposition occurs in the form of photooxidation. Among other things, foreign molecules such as oxygen, water vapor or other pollutants are involved in this. Further surface contamination can significantly accelerate these processes (Koesling 2000).
The fact that ultraviolet radiation and, to some extent, radiation from the visual range cause photochemical effects in areas close to the surface has already been proven several times. As already mentioned, the environment of the molecule influences the reaction considerably. The presence of the molecule also influences the process and is defined by means of the solution in liquids or solids, the proximity or remoteness of the surface, and the connection or possible proximity to other molecules (Schaeffer 2001).
The types of photochemical reactions can be classified as follows. Photos-cleavage causes free radicals, photo-decomposition splits the molecule into two smaller ones without producing free radicals, photo-oxidation causes a chemical change under the influence of light and oxygen and photo-sensitization describes the energy transport or release to another molecule. In the last process, the energy can also be transferred to another material, where a photochemical reaction occurs again (Schmidt 2000).
The changes caused by these reactions are manifested by color activation of once colorless materials, color veining, or brightness changes in the form of fading or darkening. Color veining can occur, for example, in the form of photo-chromatism. In this case, the substance undergoes a color change depending on the irradiation up to one of the two absorption maxima. These changes in the materials do not necessarily have to occur directly. It is also possible that the molecules involved first undergo other chemical reactions before the photochemical reaction becomes optically visible (Spikes 1977).
Further effects can be yellowing, which is based on the process of fading, loss of strength, fraying of textile fibers, brittle surfaces, or surface cracks. With some exceptions, the listed material changes are irreversible.
The intensity of the photochemical reactions is characterized by irradiance, exposure time, dose, and harmful effect of the respective wavelength ranges of the incident radiation, as well as the action spectrum of the irradiated substance (CIE157 2004).
2.2 Color change depending on irradiation
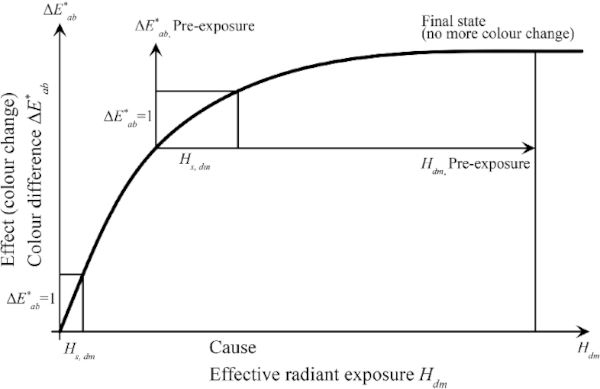
In several experimental investigations, a non-linear relationship between the color spacing and increasing harmful or effective radiation was shown (Herzberg and Völker 2010). As soon as a certain input of the damaging radiation has been reached, a state of equilibrium is achieved and no further color change occurs.
The threshold exposure Hs,dm is defined as the effective exposure that results in an initial color spacing of ΔE*=1 (Table 2) that is perceptible to the eye (CIE157 2004).
Threshold exposure is therefore considered an indicator of a material's light stability. In order to achieve a ΔE* = 1, only a very small threshold exposure is needed at the start of exposure. Pre-aged exhibits require a much higher threshold irradiation. Thus, pre-exposed samples are less sensitive to radiation (FGL 2006).
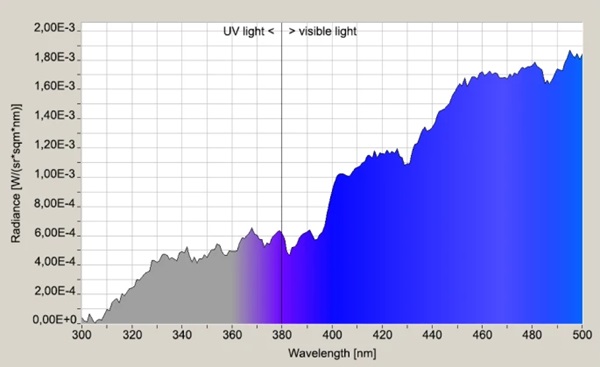
Herschel, also found that light-sensitive colorants were destroyed by light of the wavelengths that formed their complementary color. Red colorants, for example, faded when exposed to green light (Herschel 1842) (Fig. 2).
2.3 Damage potential depending on the wavelength
In 1953, Harrison (1953) proposed a method for evaluating the relative damage potential of different types of light sources and filter combinations (Fig. 3). This is described in a function developed by him, which represents the relative spectral sensitivity of a defined material. This index should be used to determine the damage potential of alternative light sources or filter combinations (CIE157 2004).
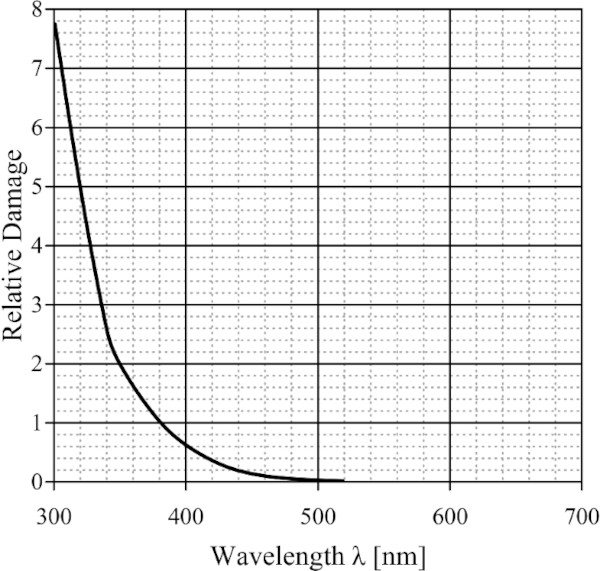
However, Harrison's proposal did not catch on because the function was extrapolated from a very limited number of measurements that were made. Furthermore, a single damage function is not representative of all the different materials found in the conservation field. More volatile materials should have higher potential at visible wavelengths, while stable ones are only damaged by UV, Thomson (1986) said (CIE157 2004).
Nonetheless, Harrison's contribution to the wider museum community was very influential. According to his damage function, damage is almost entirely due to UV-radiation. Furthermore, the relatively low level of damage from visible radiation longer than 500 nm is negligible. This stuck in the minds of many museum directors that the light bulb was deemed safe and natural light had to be removed from the galleries and museums (CIE157 2004).
Since Harrison's approach offers a lot of potential, an attempt was made to develop a function that can map the damage potential. Because the range of photochemical reactions that can take place in a museum is very wide, and the actions themselves are complex, there cannot be a simple spectral response model that is accurate enough or entirely reliable. Nonetheless, an attempt by the researchers (Krochmann 1987; Aydinli et al. 1990) to do this looks as follows:

s(λ)dm,rel relative spectral responsivity, α(λ) spectral absorptance, ƒ(λ) function of wavelength determined by the receiving material.
This model is based on the consideration that, first, energy must be absorbed to cause damage. Second, the probability of a photochemical reaction is related to the energy level of the photon. Third, there is a function of wavelength, which is determined by the inherent properties of the material.
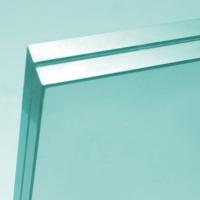
3 Interlayer materials for laminated glass
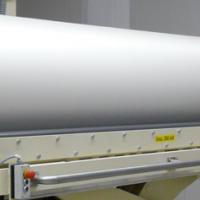
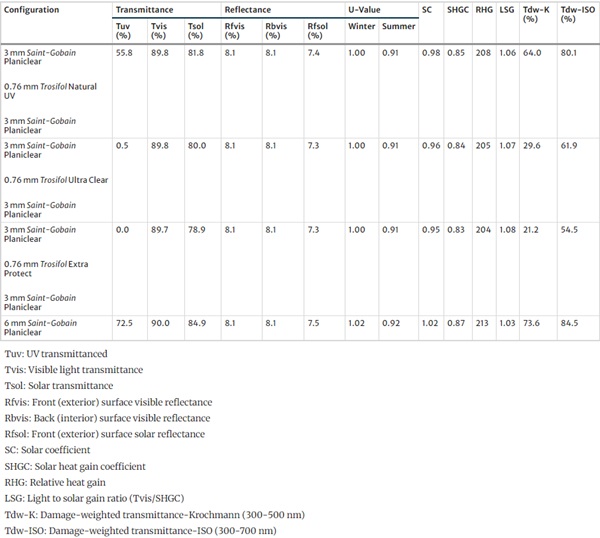
The field study described below was conducted with test specimens from LSG. The clear films from the Trosifol product range were used as interlayer films. They include films with transmission from 310 nm (Trosifol® Natural UV), 380 nm (Trosifol® Clear) and 400 nm (Trosifol® Extra Protect), compare Fig. 4. The characteristic data of the films are listed in Table 1.
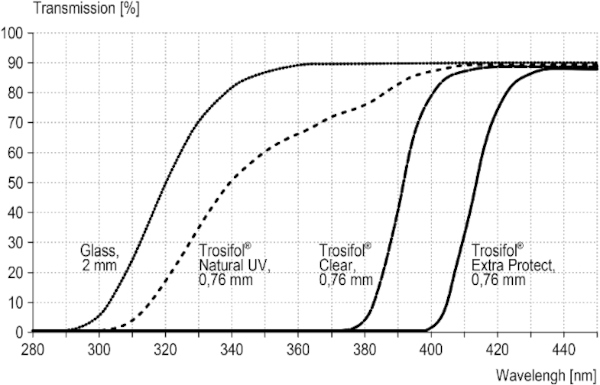
Table 1 Trosifol® interlayers materials used for field study (https://www.trosifol.com) - Full size table
4 Methods for fading assessment
4.1 The CIELAB-system
The CIELAB system created in 1976 (Welsch and Liebmann 2012) is still the most used color space when color distances have to be recorded, described, compared and expressed in numerical values (CIE157 2004). The CIELAB color space was derived from the CIE standard valence system introduced by the International Commission on Illumination in 1931. It served to establish the connection between the physical cause of the color stimulus and human color perception. The standard valence system depicts all visually perceptible color tones of the human eye. A major disadvantage of this system is that color spacing are displayed in a distorted manner. The CIELAB system was developed to approximate the color spacings perceived by humans (Kittel 2006). The CIELAB system is a three-dimensional spherical color space defined by three axes (Figs. 5, 6).
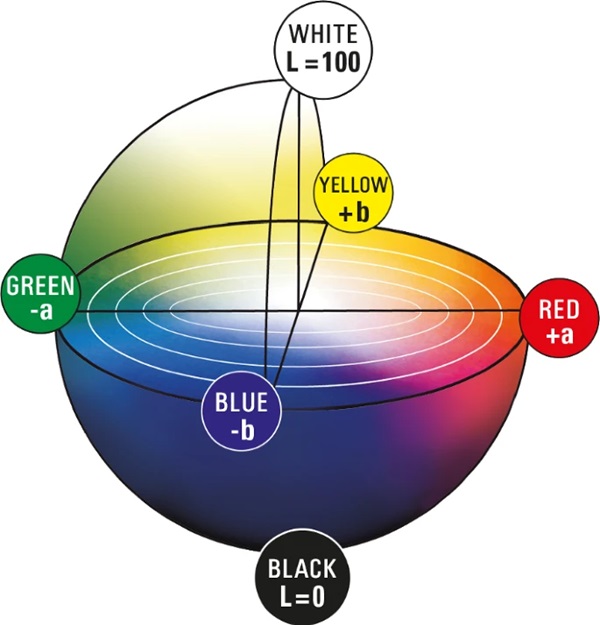
In the conventional x–y–z coordinate system, the z-axis would represent brightness. In the CIELAB system this is marked with L* and ranges from absolute black L*=0 to absolute white L*=100. It is defined as the only axis by a fixed start and end point. Two other axes create a chromatic plane, here denoted by a∗ and b∗. This plane describes the saturation of the hue. The further a color location is shifted outward, the stronger the saturation becomes. If this shifts in the direction of the coordinate origin, the saturation decreases. A positive a∗-value describes red, a negative value green. Also, a positive b∗-value reflects yellow tones and a negative b∗-value reflects blue tones (DIN EN ISO/CIE 11664-4 2020). In the center of the whole is the achromatic point. This is where the purest gray is shown (Eichler 2022). Since this point is located exactly in the center of the system, it has the coordinates P(50;0;0).
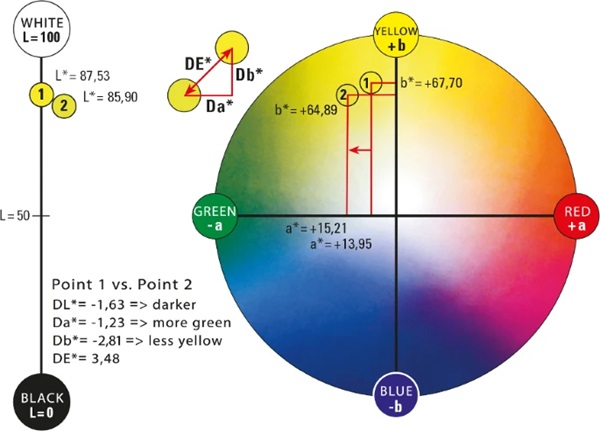
With this system, each hue can be assigned a specific point with the coordinates L*;a∗;b∗ (DIN EN ISO/CIE 11664-4 2020). With the respective coordinates of two color locations, the average overall color spacing ΔE*ab can be calculated as follows:
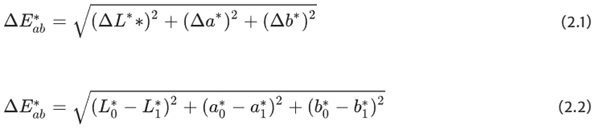
The color spacing between two color locations is the size of the perceived difference between two colors under defined lighting conditions and illustrated in the CIELAB system by a vector ΔE*ab or ΔE*. All changes in the three dimensions are recorded and the Euclidean distance is calculated (ISO 13655 2009).
The CIELAB system allows researchers to collect accurate data on color change due to exposure to light (CIE157 2004). However, this system also has its weaknesses. Empirical studies have shown that the CIELAB color space is particularly suitable for evaluating large color spacings, however, especially in the red range, the perception deviates from the calculated values (Feneis 2020). Furthermore, the human eye first finds deviations in hue, then in saturation, and finally in brightness. Thus, humans do not perceive these quantities as identical. In human color perception, colors do not behave linearly to each other. To be able to represent this visually, the CIELAB color space would have to correspond not to a sphere but to a three-dimensional ellipsoid (Eichler 2022).
In order to bring the color distance calculations closer to human color perception, attempts have been made to develop them further. The color spacing formulas according to CIE94 and CIE2000 originate from this research, but still show deviations (Sharma et al. 2005).
So far, no system has been developed that can accurately reproduce human perception (Eichler 2022), so the CIELAB system remains valid according to the ISO 13655:2009-12 (2009) standard and remains the most used color space (Kittel 2006) (Table 2).
Table 2 Human perception in relation to the color spacing (Feneis 2020) - Full size table
4.2 Measurement methods defined by standardization
Various standards describe guidelines for test methods and their evaluation with regard to the lightfastness of materials, for example for furniture in DIN EN 15187 (2006) or in the various versions of DIN EN ISO 105 for textiles. The standard DIN EN ISO 105-B01 (2014) details the procedure for a color fastness test against daylight, which is similar in its basic concept to the project carried out here.
The most obvious effect of exposure to harmful radiation is fading. This is characterized by an increasing loss of color intensity and is easily perceived as lightening, especially in dark colors. This effect prompted researchers to categorize the damage. Thus, in 1995, the first ISO classification system was created, which is also suitable for the general classification of museum objects. This system is based on the blue wool reference standard (CIE157 2004).
For the test method described in DIN EN ISO 105-B01, lightfastness grades of blue-dyed wool are also required, from which the degree of damage from fading can be derived. The test scales produced and used in Europe are divided into levels from 1 to 8 and must meet the quality requirements of ISO 105-B08. Level 1 has the lowest and level 8 the highest color stability when exposed to light. It also applies that the respective subsequent level is approximately twice as stable to irradiation. In order to achieve this, the individual strips are colored with different degrees of fading (DIN EN ISO 105-B01 2014) (Table 3).
Table 3 Dyes for blue wool light fastness grades 1–8 according to DIN EN ISO 105-B01 (2014) - Full size table
4.3 Non-standard industrial measurement methods
Repro color sample cards of the company Agfa, like other reference cards, served as color scales in the printing trade. They were produced according to the historical DIN 16508 (1967) and used for three- and four-color printing to test color reproduction and brightness gradation. They also specified the order in which the various colors were printed (Kerner and Kerner 2007).
5 Methodology and specimens
5.1 Methodology
In order to investigate the protective effect of the laminated safety glass panes on colors, an experimental empirical test is developed, which is based on standard specifications and applicable industry guidelines.
Previous investigations by the interlayer producer Trosifol have involved only artificial irradiation over 1000 h with a defined light source that reproduces the critical UV-A UV-B spectrum. The artificial light spectrum has significant deviations from natural sunlight.
The conducted field tests in natural sunlight are based on the specifications of the standard DIN EN ISO 105-B01 (2014).
Identical color scale samples are attached to sample carriers located 10 mm under the glazing to be tested. The samples are ventilated and protected against rain. All glass panes are tested in duplicate. The measurement is carried out on each color sample at two always identical points. The measuring points are specified by a gauge.
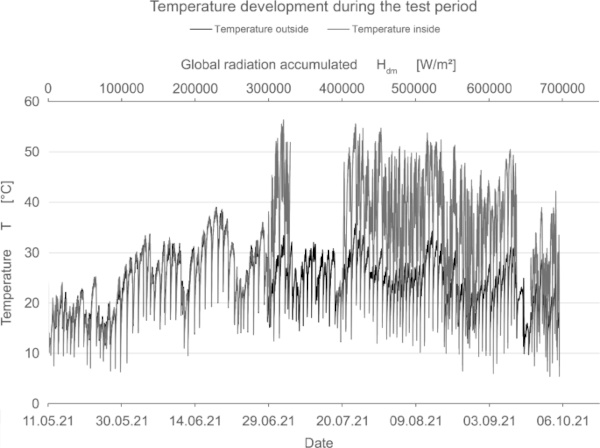
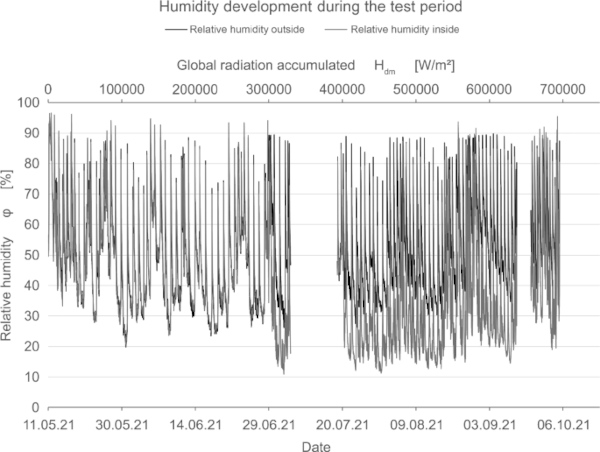
The orientation of the test stand is inclined 50° to the horizontal in the south direction; there is no shading over the day. The measurement of global radiation indicates the amount of radiation acting on the test specimens.
Natural aging without exposure to radiation is determined by a reference sample stored in laboratory climate under absolute darkness. The color scale samples are transported from the test stand to the laboratory for measurement in a darkened transport container. The measurement is performed by the SpectroDens device from TECHKON, which is calibrated to ceramic white. The time interval of the measurements is daily at the beginning and is gradually reduced according to the fading process.
5.2 Color scale samples
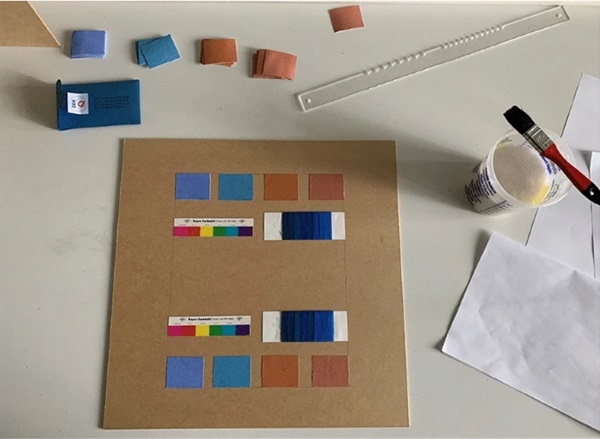
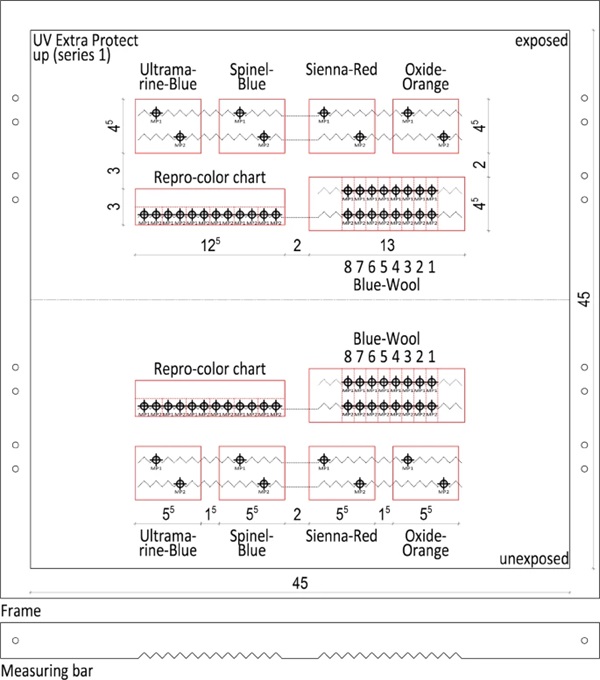
For the investigation of the glasses, several color scales were chosen. They consist of organic and inorganic color pigments of different producers and cover typical materials in conservation application.
In Detail, the inorganic pigments are from the series “Marble Powder Casein shades” of the color producer Kreidezeit and, the organic pigments in printed (Repro color chart from company Agfa according to DIN 16508 (1967) and textile (Blue Wool Standard from James Heal according to DIN EN ISO 105-B08 (2010) form. The selection of the Kreidezeit colors based on recommendation of the producer, as well as the mixing ratio. An opaque, high-pigment mixture (shade A corresponding to a ratio of 1:10) was chosen, and care was taken to apply it evenly in order to create a uniform result. All sample carriers were put to a wood fiber board.
In order to make the changes caused by the temperature and humidity difference visible, the specimen slides were divided in the middle and one half was covered. The samples were each exposed to the same climatic conditions. A blank sample was kept unexposed at laboratory temperature and humidity for the entire test period. The color scale samples were glued only to the back of their support material to exclude any influence due to the change in the organic cellulose binder.
Two sample carriers were prepared for each glass type (Figs. 7, 8).
5.3 Glass specimens
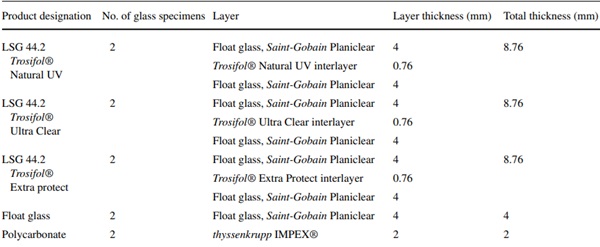
The glass specimens consist of LSG with two 4 mm glass panes and have dimensions of 450 mm × 450 mm. The used interlayer foils comprise transparent PVB-interlayers with UV-blocking-function starting from 310 nm up to 400 nm. All interlayers are produced by the interlayer producer Kuraray. Additionally, beside the LSG also a monolithic float glass pane and a polycarbonate (acrylic glass) pane were investigated. The UV-permeable polycarbonate (2 mm thyssenkrupp IMPEX®, polycarbonate sheets to DIN EN ISO 11963/DIN 16801) was intended to provide additional results of a non- or low-UV-blocking material. In the course of the test series, however, it became apparent that the supposedly UV-permeable polycarbonate achieved a protective effect (Table 4).
Table 4 Glass specimens (450 mm × 450 mm) - Full size table
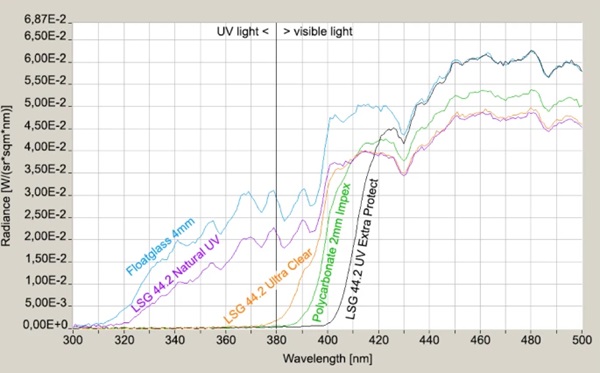
The transmission behavior of all specimens was measured against a slightly cloudy sky by means of a Jeti spectroradiometer specbos 1211UV and is shown in the in the interesting UV-relevant wavelength between 300 and 500 nm (Figs. 9, 10). The significant start of UV-transmission between the three LSG-specimens is obvious. Furthermore, the thickness difference between LSG (8.76 mm) and monolithic glass (4 mm) has to be considered for the radiance level, too.
6 Testing schedule and setup
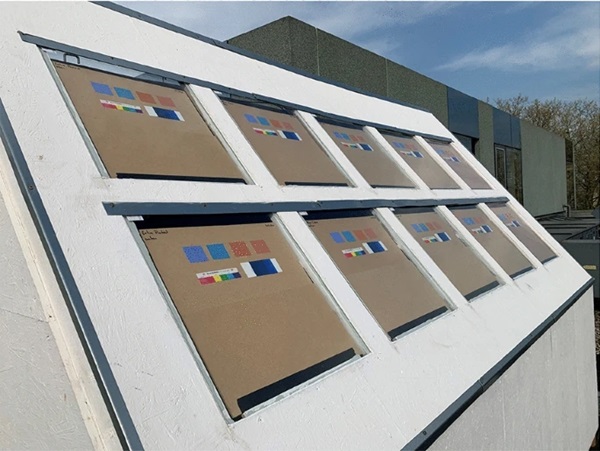
6.1 Experimental setup
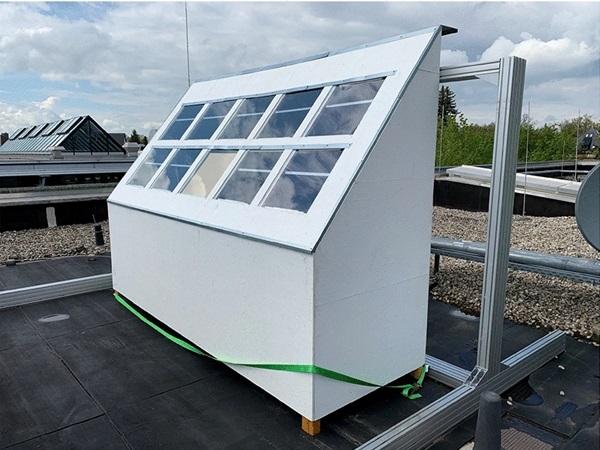
A test rig (Figs. 11, 12, 13) was manufactured to accommodate the glass specimens and the color scale samples. it also served as a weather protection against moisture and humidity as well as heat accumulation. In addition, the specimens should be exposed to a maximum amount of sunlight to obtain the highest possible radiation input. The procedure for testing color fastness under the influence of daylight is described in DIN EN ISO 105-B01 (2014), as are the requirements for the test stand.
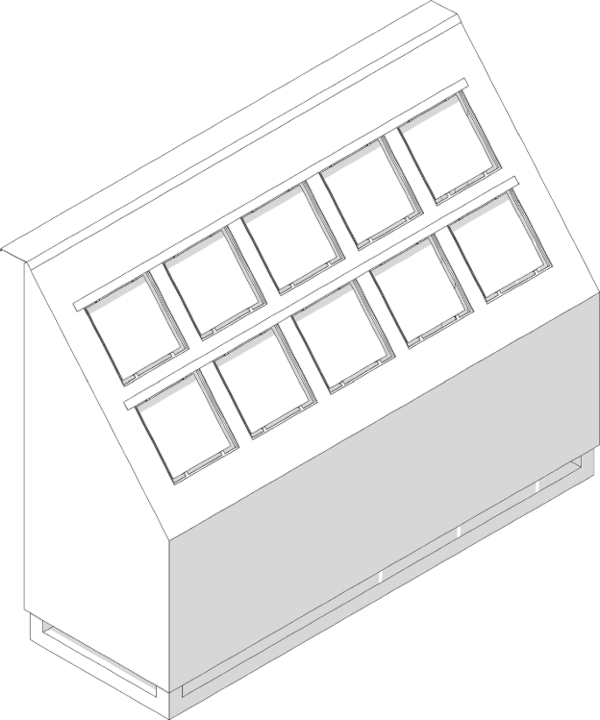
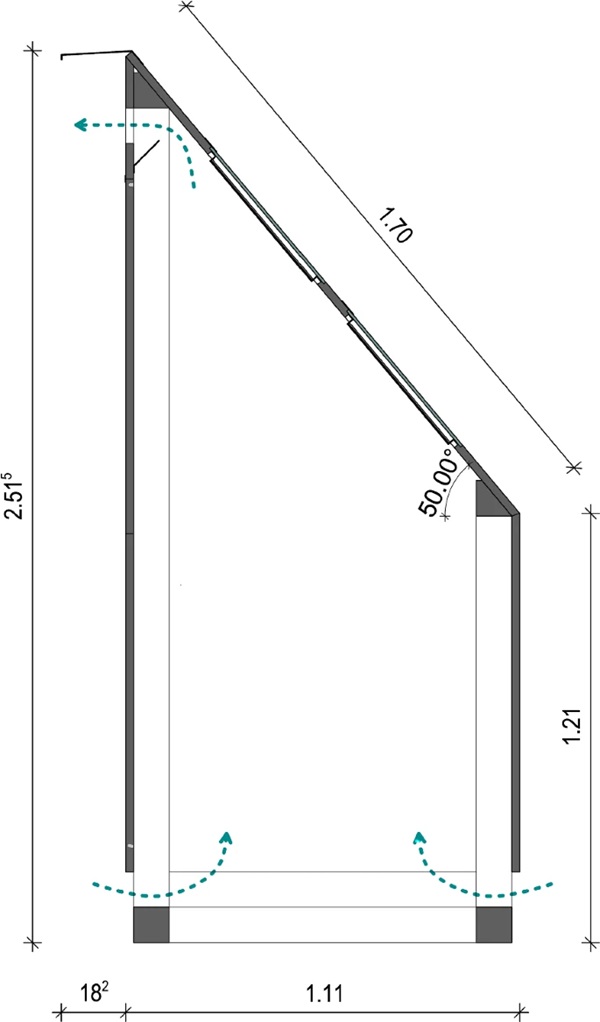
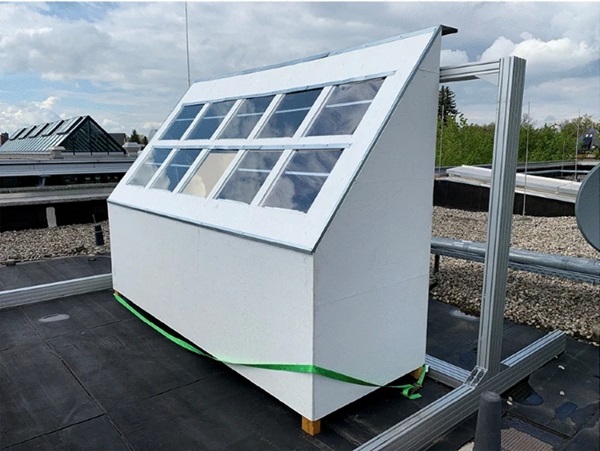
The test rig was set up facing exactly south on an unshaded flat roof. It was also ensured that the construction of the test rig would not cast a shadow on the color scale samples over the course of the day. In order for the solar radiation to strike the samples at an angle of 90° maximum often, the samples and glasses must have an angle to the horizontal that corresponds to the approximate latitude of the installation site, which for the Dessau site is about 51° to the horizontal.
Preferably, an uninhabited and industry-free region would have to be used as the installation site, since fine dust and car exhaust gases could catalyze the resulting reactions. Unfortunately, this was not feasible, but the air quality in Dessau is not polluted by strong industrial emissions.
The glass specimens were embedded in the beveled cover plate of the test rig and bonded to the substructure provided for this purpose. To prevent water penetration, the panes were adhesively bonded at the edges and an additional cover strip was attached to the upper edge of each row. The specimen supports underneath rested on multiple bent sheets and were fixed in this way.
Ventilation of the interior to prevent heat accumulation was ensured by weather-protected air supply and exhaust openings. Effective air circulation is achieved via the resulting chimney effect. To reduce heating of the trainer by radiation absorption, a white paint coating was applied. A rough fleece was applied to the inside of the trainer to minimize reflections and associated light scattering onto the paint scale patterns (DIN EN ISO 105-B01 2014).
6.2 Experiments
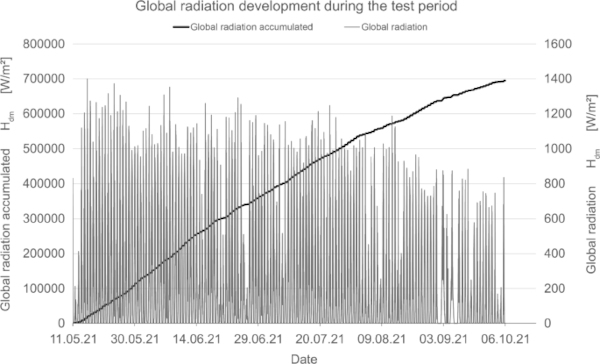
The tests were carried out from 05 May 2021 to 06 Nov 2021 and lasted 148 days.
At the beginning of the experimental period, daily measurements were performed due to the expected rapid changes in color distances. As the irradiation progressed, the intervals were increased to 7 days and finally to 14 days.
All measurements were performed in a darkroom to avoid additional damaging radiation outside the experimental setup. For this reason, the sample carriers were transported only light-tight. The SpectroDens from TECHKON was used for the measurements, a spectral densitometer that feeds the measured data directly into a prepared Excel spreadsheet.
Before starting measurements, the instrument was calibrated to a ceramic white and each sample was measured before exposure to radiation. The zero-value determined in each case is considered the starting point for the associated sample and its further measurements.
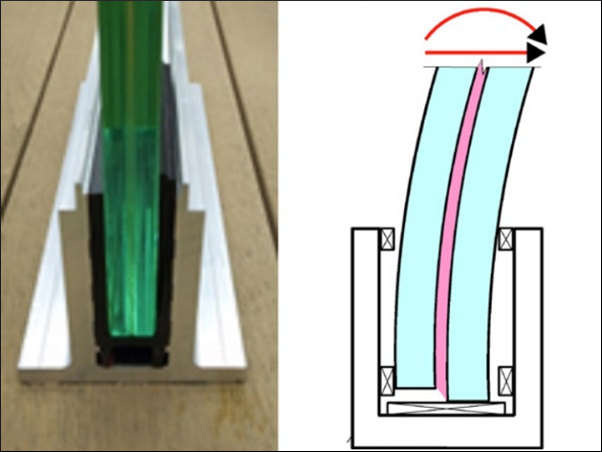
Since the ink application is not exactly the same at every point, incorrect measurements can also occur here. To prevent this, a measuring point network was created and a corresponding measuring point rail (Fig. 14) was made. In this way, the same point could always be recorded and measured. Two measuring points were assigned to each specimen. The two recorded measured values of the respective sample were then averaged. Averaging over the similar test specimens did not take place in order to obtain comparative values.
In this field test, 10 test specimens carriers were measured, each with 36 specimens to be processed individually. All specimens were assigned 2 measuring points and the measurements were performed on a total of 22 days during the test phase. Together with the measurements of the blank sample, appx. 16,000 measured values were determined.
In addition to measuring the color deviation, humidity and temperature inside and outside the test rig were recorded permanently (Fig. 15, 16, 17).
7 Results
7.1 Visual observation of the samples
The measurements were carried out over a period of 20 weeks in summer 2021. As described above, all series of measurements were performed on two test specimens of the respective glasses. Figures 18, 19, 20, 21 and 22 show both sample carriers of every glass type. The upper side was sun exposed for 12 weeks, the lower side unexposed as reference color.
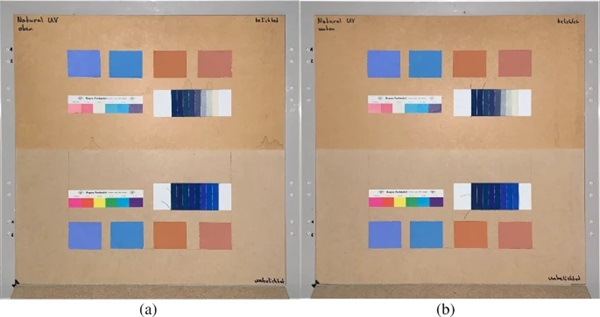
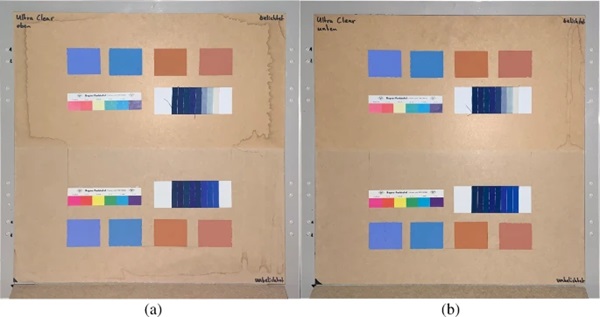
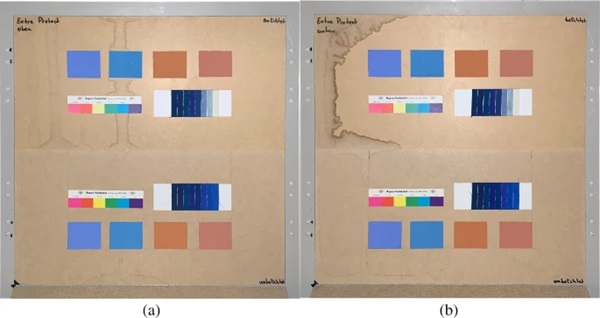
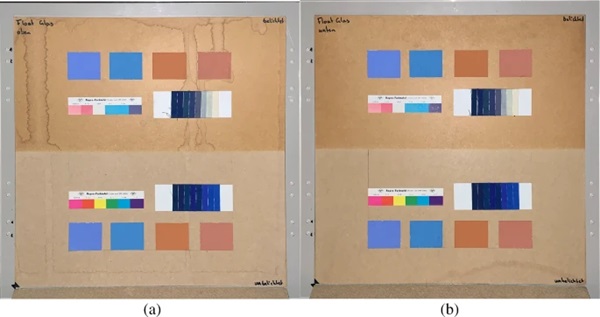
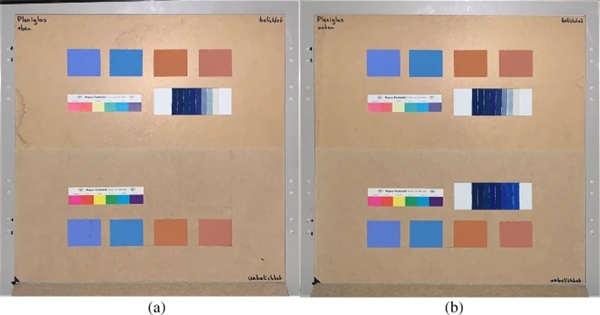
The visual inspection shows fading of the color samples for all glass types, but the intensity depends on the particular color sample and on the glass type. Both test specimens of each glass structure show the same fading of the color samples. At a few color carriers, moisture traces on specimens are visible. They were caused once by leaks in the sealant of the test specimens, which were reworked shortly after they occurred. The moisture traces have no effect on the visual appearance and the measured color spacing values as both specimen of each built-up showed congruent color spacing behaviour.
7.2 Measured color values of the samples
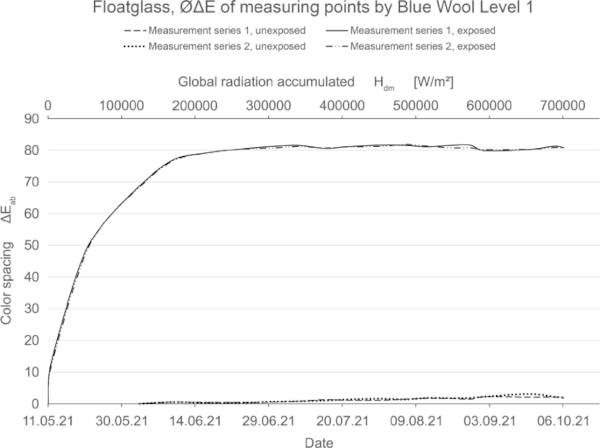
Based on the total number of 16,000 measured values, the fading behavior of the color samples is described in tables and diagrams. In each case, the results of the color spacing values were approximately congruent for both specimen of every glass type, as can be seen for float glass in Fig. 23.
From the large number of color samples, three groups can be identified, namely samples from non-stable, medium-stable and very stable color pigments.
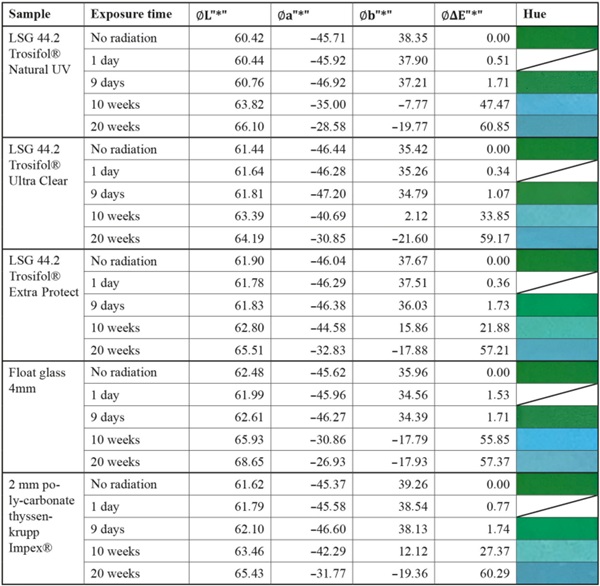
Tables 5, 6 and 7 show the measured changes of the colorants in numerical values of a representative color sample of each of the three groups of non-stable, moderately stable and stable color pigments. In the following, the measured changes of the dyes are presented in numerical values. As an example, the effects of the individual axes of the color space on the color difference can be compared on the basis of a non-stable, a moderately stable and a stable sample. The numerical values shown are in each case the averaged measurement results of measurement point 1 and measurement point 2 of the first sample carrier, which is located at the top in the test arrangement here. For visual comparison, the photographically documented color nuances are shown in the last column. The color representation may be influenced by slight shading, which cannot be ruled out, as well as reflections on the specimens and by electronic components or by the printing itself and may therefore deviate from the material original.
Table 5 Summary of measurement results of the non-stable textile color sample “Blue Wool Standards Level 1” - Full size table
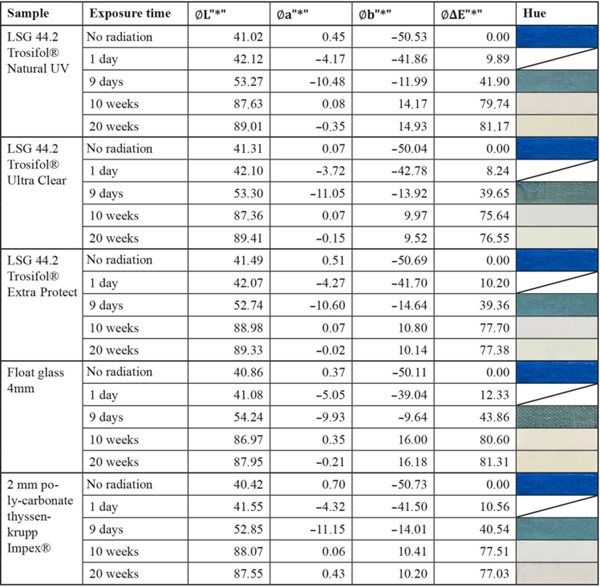
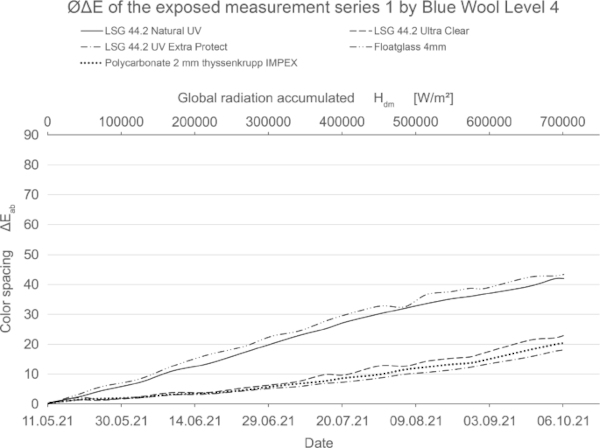
Table 6 Summary of measurement results of the medium-stable textile color sample “Blue Wool Standards Level 4” - Full size table
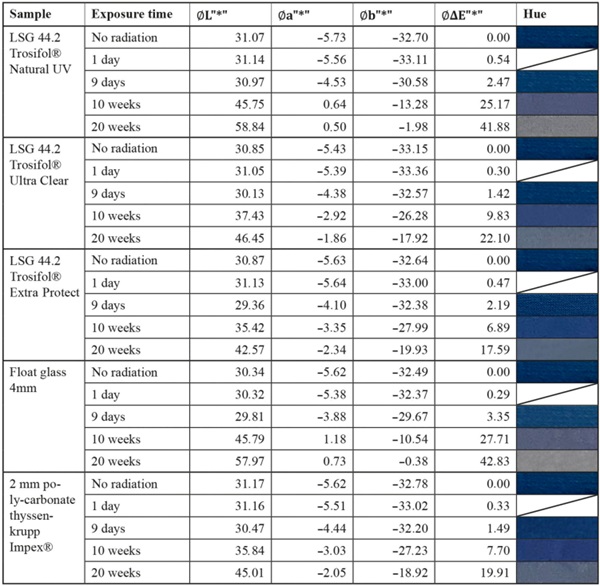
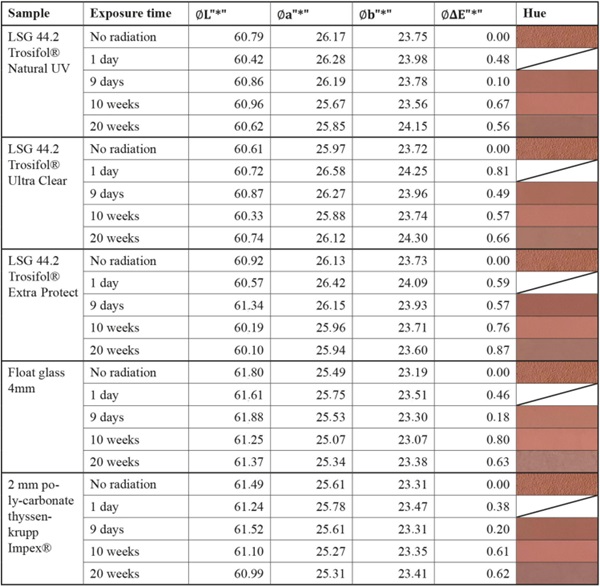
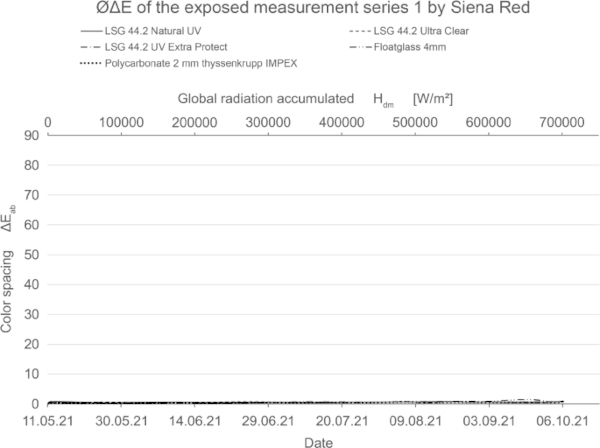
Table 7 Summary of measurement results of the very-stable mineral color sample “Kreidezeit” Sienna Red - Full size table
8 Discussion of results
8.1 Color fading protection
Figures 24, 25, and 26 show the color spacing values from Table 5, 6 and 7 graphically for the three identified groups of non-stable, medium-stable and very stable color pigments.
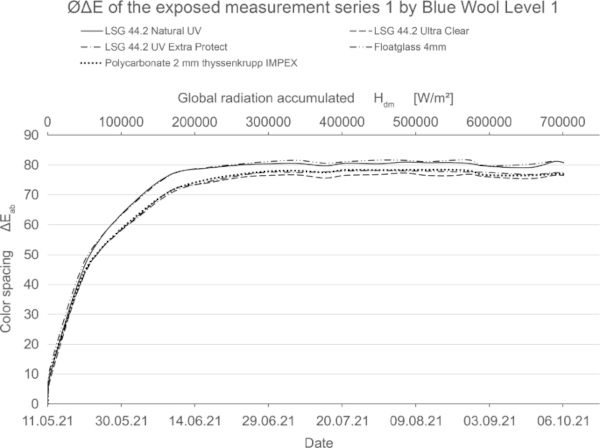
These diagrams show by means of the color spacing ΔE* the time-dependent fading development. Depending on the color pigment and radiation, the color spacing ΔE* plateaus after a certain period of time at about ΔE* ~ 80–90 (Figs. 23, 24).
The size of the increase of the color spacing ΔE* shows how stable the color pigments are against radiation.
If the fading progresses rapidly, the curve is steeper and has reached its maximum earlier. For very stable materials, it is flat or with a slight slope. For some moderately stable materials, the plateau has not yet been reached within the 20-week test period (Fig. 25).
The tested mineral pigments from Kreidezeit confirm the expected high resistance to solar radiation. All samples show very little or no change (Fig. 26). Compared to the blank sample, the authors estimate that this is due to other aging processes, especially in the case of the blue pigments.
The basic colors of the Agfa repro ink, i.e. violet, yellow and cyan, behaved very differently in the test. Yellow proved to be unstable, violet moderately stable, and cyan very stable. It can also be seen that the mixed colors tend to follow the more unstable hue in their damage progression. Only in the case of violet did mixing behavior occur. It should also be noted that glasses with improved UV protection were able to achieve higher color fastnesses in the very sensitive samples, as expected.
The blue wool standard performed largely as expected over the test period. Level 8, which has the highest color fastness, was barely or not at all affected by irradiation for all test samples. Between levels 7 and 4, there is a progression where the materials become increasingly sensitive. In this range, significantly less fading is achieved by LSG with high UV protection. In particular, LSG with Trosifol Extra Protect stands out at levels 5 and 6 compared to LSG with Trosifol Ultra Clear.
In this middle range, the blue wool samples show an expected and also visually clearly visible increase in fading under glasses with Trosifol Extra Protect via Ultra Clear to Natural UV.
From level 3, however, the samples faded very quickly and almost equally among all test specimens up to a certain plateau, with no further progression beyond this. It is possible that increased summer temperature has a noticeable effect on fading in these sensitive blue wool samples level 1–3. This needs to be investigated further.
Table 8 shows an overview of the color samples examined with regard to their fading behavior based on the color spacing ΔE* that occurred using a qualitative 5-level scale.
Table 8 Color stability of the tested pigments in relation to the test specimens - Full size table
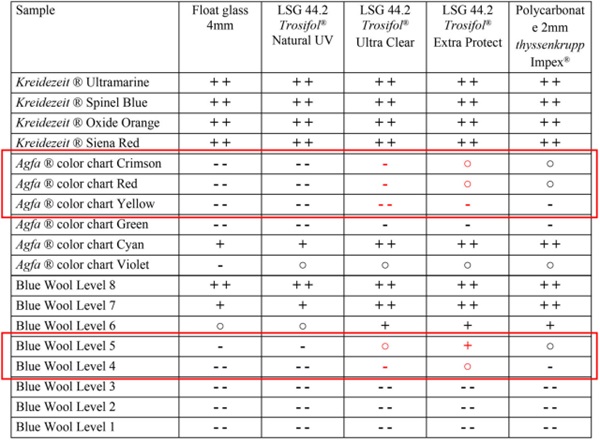
In the case of non-stable or low-stable color pigments, strong fading occurs within a short time in all glasses. The medium-stable color pigments show the greatest influence of the different glazing within the test period of 20 weeks. In the case of the very stable color pigments, no or only slight changes in the color difference could be detected during the test period and thus the protective effect of the different glazing could not be clearly distinguished. It can be assumed, however, that prolonged exposure to radiation will result in similar behavior to the medium-stability color pigments, with visibly reduced fading of the samples under laminated safety glass with interlayers of high UV protection.
The use of LSG with increased UV-blocking interlayer, like Trosifol Extra Protect, instead of standard PVB interlayer, like Trosifol Ultra Clear, significantly delays the fading. This value is depending on several individual color characteristics and cannot be quantified. The absolute fading reduction levels depend on the stability of color pigments and the sun exposure time. The temperature of the color materials should not exceed room temperature levels.
8.2 Effect of a color shift
Besides the fading of the color pigments, there is the effect of color shifting. It can be observed that the values of two of the three axes (Fig. 5) behave very stably and only the values of one axis change significantly.
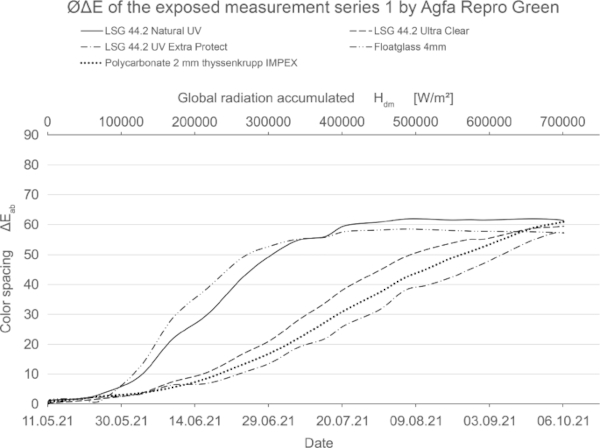
This effect is particularly pronounced with mixed colors and is explained using the color example Agfa Repro Green. The color Repro Green consists of two primary colors, Repro Yellow and Repro Cyan, in approximately equal parts. Repro Yellow was relatively unstable in the test, while Repro Cyan was very stable. Upon exposure to radiation, the mixed color shifts from green to blue. This is due to the fading of Repro Yellow. The pigments of the yellow hue are destroyed and the stable blue pigments remain.
Table 9 shows the measured values of the Agfa Repro Green color sample. This effect is clearly visible in the columns of the L, a and b axes. While the brightness axis L* and the red-green axis a∗ hardly change over the test period, the blue-yellow axis b∗ is strongly affected. The resulting color spacing ΔE* is thus determined by the change of only one axis. The relatively low magnitude of the color spacing ΔE* is not in proportion to the visually clearly recognizable color shift. In the industry, this effect is taken into account in that the protocols for color evaluation always include the positive or negative development of the respective axes (Eichler 2022).
Table 9 Summary of measurement results of the paper color sample “Agfa Repro Green” - Full size table
The value of the color difference alone is therefore not meaningful. In this study, the development of the individual axes was not discussed further, since a color shift was only observed for repro green and no direct evaluation of the pigments was to be made. In the optical comparison, Repro Green and Repro Cyan under VSG with standard interlayers look almost identical at the end of irradiation. Only the use of laminated safety glass with high UV protection such as Trosifol Extra Protect leads to a visually visible slowing down of the effect (Table 9), which can also be seen in the lower increase in color spacing ΔE* in Fig. 27.
9 Conclusions
The performed natural weathering investigations to observe the effect of LSG with different interlayer foils delivered consistent results. The measurement lasted 148 day over the summer 2021 and provided app. 16,000 measurements of the color spacing of color samples. The test rig was built in south orientation on a completely sun exposed roof of a university building in Dessau, Germany. In total 18 colours relevant for monument conservation were used for the samples, covering organic and non-organic colors as prints and as textiles as well as mineral colors. Five different glasses, mainly LSG with different type of PVB interlayers were used as protection cover of the color samples.
The results of the field investigation are as following:
- The color spacing ∆E* shows time-dependent fading
- Depending on the color pigment of the color samples and radiation, the color spacing ∆E* plateaus at ∆E* ~ 80
- The slope of the function ∆E* shows how the stability of the color pigments against radiation
- At non- and little stable colors the fading curve is steeper and reached its maximum early. For moderately stable materials, the plateau has not yet been reached within the 20-week. Mineral pigments colors from Kreidezeit confirm the high resistance to solar radiation.
- The basic colors of the Agfa repro ink, i.e. violet, yellow and cyan, behaved differently in the test. Yellow proved to be unstable, violet moderately stable, and cyan very stable.
- Mixed colors tend to follow the more unstable hue in their damage progression.
- Glasses with improved UV protection starting from 400 nm deliver higher color fastnesses of sensitive color samples.
- Especially the medium color samples blue wool level 4–7 show a significantly lower fading under LSG with Trosifol Extra Protect compared to LSG with standard PVB-interlayer Trosifol Ultra Clear.
- The medium-stable color pigments show within the 20 weeks experiment the largest reaction to the use of LSG with interlayer with increased UV-blocking.
- From blue wool level 3 and lower, however, all samples fade very quickly and almost equally among all test specimens
- In the case of non-stable or only low-stable stable color pigments, such as blue wool grade 1–3, strong fading to a certain plateau occurred in all LSG grades within a short time. The application of Trosifol Extra Protect has no measurable retarding effect.
- In the case of the very stable color pigments, no or only slight changes in the color spacing were detected after 20 weeks, because the test period was too short. It can be assumed, that prolonged exposure to radiation will result in similar behavior to the medium-stable color pigments, with visibly reduced fading of samples under LSG with high UV protection.
Generally, the use of LSG with an interlayer with higher UV-blocking levels (e.g. Trosifol Extra Protect) instead of a standard PVB interlayer (e.g. Trosifol Ultra Clear), that means an additional UV-blocking fraction between 380 and 400 nm, leads to a measurable delay of fading. This value is depending on several individual color characteristics and cannot be quantified. The absolute fading reduction levels depend on the stability of color pigments and the sun exposure time. The temperature of the color materials should not exceed room temperature levels.
Data availability
No data available.
Acknowledgements
The authors would like to thank Kuraray Company for providing the required materials, samples and specimens.
Funding
Open Access funding enabled and organized by Projekt DEAL.
Author information
Authors and Affiliations
Department of Architecture, Facility Management and Geoinformation, Building Envelope Research Group, Anhalt University of Applied Sciences, 06846, Dessau, Germany - Marius Müller, Stefan Reich & Christian Pfütze
Advanced Interlayer Solutions Division, Kuraray Europe GmbH, 65795, Hattersheim, Germany - Ingo Stelzer
Corresponding author
Correspondence to Stefan Reich.
Ethics declarations
Conflict of interest
On behalf of all authors, the corresponding author states that there is no conflict of interest. No funding was received from a third party to assist with the preparation of the manuscript.

.")