Article Information
- Digital Object Identifier (DOI): 10.47982/cgc.8.365
- This article is part of the Challenging Glass Conference Proceedings, Volume 8, 2022, Belis, Bos & Louter (Eds.)
- Published by Challenging Glass, on behalf of the author(s), at Stichting OpenAccess Platforms
- This article is licensed under a Creative Commons Attribution 4.0 International License (CC BY 4.0)
- Copyright © 2022 with the author(s)
Author:
- Mithila Achintha - Department of Mechanical, Aerospace and Civil Engineering, University of Manchester

Abstract
The brittle material behaviour of glass means that stress concentration features, such as geometric discontinuities (e.g., drilled holes) and mechanical connectors can weaken the structural efficiency of some glass structures. The poor structural efficiency due to the stress concentrations usually makes annealed glass unsuitable in applications where stress concentrations present, such as glass–bolted joints. Laminated and tempered glass are preferred in building construction industry due to their high strength and safe failure behaviour, respectively. However, laminated and tempered glasses areexpensive compared to annealed glass. Moreover, laminated and tempered glasses offer limited design and construction flexibility, since the tempering and the laminating processes cannot be done at construction sites. This paper shows that bonding a small strip of Glass Fibre Reinforced Polymer (GFRP) on the surfaces of glass around stress concentration features in annealed glass can enhance the load capacity and ensure post-peak load resistance. The results suggest that the bonded GFRP strips retarded the propagation of a few major cracks causing complete fracture of the glass, thereby ensured higher load capacity and post-peak load resistance compared to unreinforced annealed glass. Since GFRP strips of small size are required in the proposed strengthening technique, the negative visual impact due to the translucent GFRPs are often negligible in most practical applications.
1. Introduction
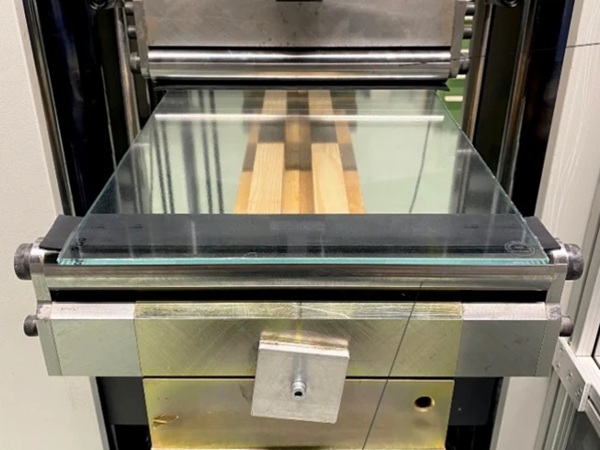
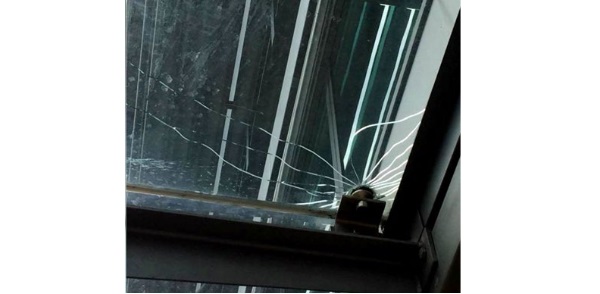
The brittle material behaviour of glass means that fixing glass panels together and/or connecting them onto supporting structures is challenging in building construction industry. Mechanical fixing methods, such as various forms of bolted connections, are commonly used in construction industry because of the construction flexibility they offered, including the ease of replacing damaged glass panels during service life. Despite the popularity in construction industry, glass-bolted joints are structurally inefficient (Watson et al. 2013). Holes must be drilled in glass in order to fabricate the bolted joints where drilling of the holes introduces additional surface defects, thereby weakening the glass in the vicinity of the joints. This is because the presence of larger surface defects/microflaws means that critical flaw(s) that would cause glass fracture can develop at low applied stresses. The combination of the strength deficiency together with the high stress concentrations developed due to the geometric discontinuities (e.g., drilled holes) and the contact between the bolts and the glass make the glass–bolted joints are critical structural features. Fig. 1 shows a typical fracture initiated in glass in the vicinity of a mechanical joint in a real-life application.
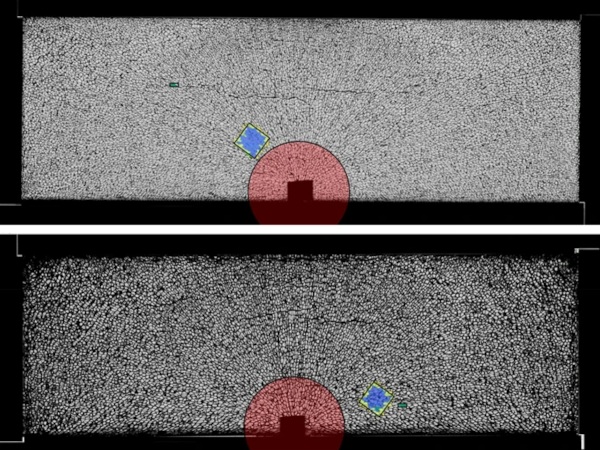
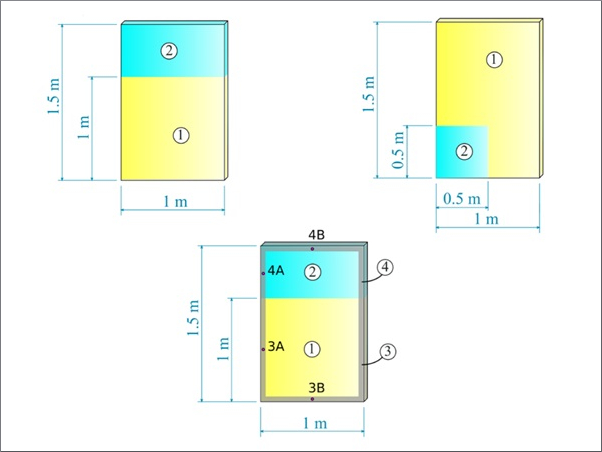
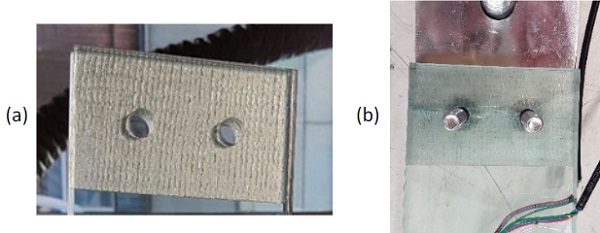
Although the high strength of tempered glass makes them suitable for glass–bolted joints, tempered glass shatters into small pieces during failure with no post-peak load resistance in the structures (Baitinger and Feldman 2010). On the other hand, annealed glass is also brittle but fails into large angular pieces with sharp edges. Fig. 2 shows the typical failure patterns of glass–bolted joints in annealed and tempered glass where in annealed glass, the fracture propagated across the two bolts of the joint whereas tempered glass shattered into small dice causing complete fracture of glass. For more extensive reviews on connectors in glass are referred to already published research works (e.g. Bedon and Santarsiero 2018)
A previous experimental investigation (Achintha and Zirbo 2021) led by the author of the present paper showed that adhesively bonded Glass Fibre Reinforced Polymer (GFRP) strips in the vicinity of the double lap tension joint configurations (see Fig. 3) ensured higher load capacity (~140% increase) and notable post-peak load resistance in annealed glass–bolted joints compared to the respective unreinforced reference glass–bolted joints. Furthermore, the post-cracked load resistance of the GFRP reinforced annealed glass–bolted joints were significantly higher (~280% higher) than similar bolted joints in commercially available laminated-annealed glass. The concept of GFRP reinforced glass–bolted joints is novel, and no research reported in the literature except the previously mentioned experimental investigation paper [9]. The present paper shows an independent validation of the efficacy of the proposed GFRP reinforcement technique using the experimental results of open hole annealed glass test specimens. In the second half of the paper, development of a finite element-based computational methodology for the analysis of GFRP reinforced glass–bolted joints is presented.
2. Open Hole Tensile Test Specimens
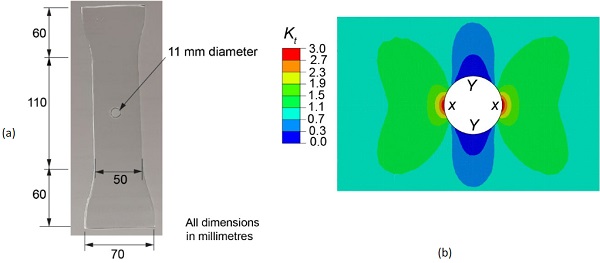
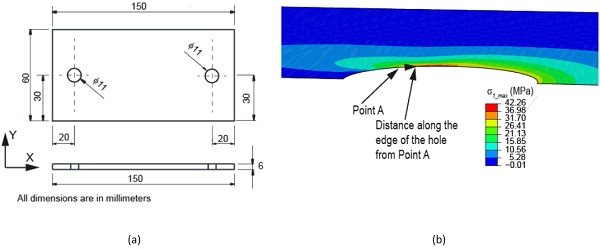
Tensile test specimens with centrally drilled holes (i.e. open hole test specimens) were considered in the present study as a means of further validating the GFRP reinforced technology for stress concentration features in glass structures. Fig. 4 shows the glass test specimen geometry considered in the present study. 4 mm thick annealed glass was used in this study and the width of the central part of the test specimen was 50 mm (all dimensions of the test specimen are shown in Fig. 4a). A 10 mm diameter central hole was drilled using a diamond-drilling tool (note: services of a commercial supplier was used in the present study to drill the holes, and in order to ensure that the experiments were carried out mimicking relevant practical industrial applications, the inner surfaces of the drilled holes were polished up to the ‘‘industry standard” by the commercial supplier).
A tapered geometry with a small cross section area at mid-length region compared to the ends of the test specimen was chosen because of the potential of this geometry for eliminating likely premature failure expects at the ends of regular rectangular geometry glass test specimens. This is because fixing of the test specimen to the loading machine causes additional geometric constraints and high stresses at the ends causing possible failure of the test specimen at one of the ends rather than the required mid-length region failure. A relatively small cross section area in the mid-length region of the test specimen is likely to ensure the failure in the vicinity of the central hole.
The expected stress concentration around the vicinity of the hole when the test specimen is loaded in tension was modelled using finite element (FE) analysis. Commercially available software, Abaqus(ABAQUS/CAE 2019), was used in the present study for the FE analysis. Glass was modelled as a linear elastic material with Young’s modulus 70 GPa and Poisson’s ratio 0.22, values often used in glass engineering literature (Wang et al. 2017). 8-node, linear solid elements of approximately 0.2 mm × 0.2 mm × 0.1 mm size (along the circumferential, radial and thickness directions, respectively) were used to model the glass around the vicinity of the hole. The size of the elements gradually increased towards the far ends of the glass specimens away from the hole. The appropriateness of the size of the elements used in the FE analysis were established through a sensitivity analysis involving an investigation of the stresses along the edge of the hole.
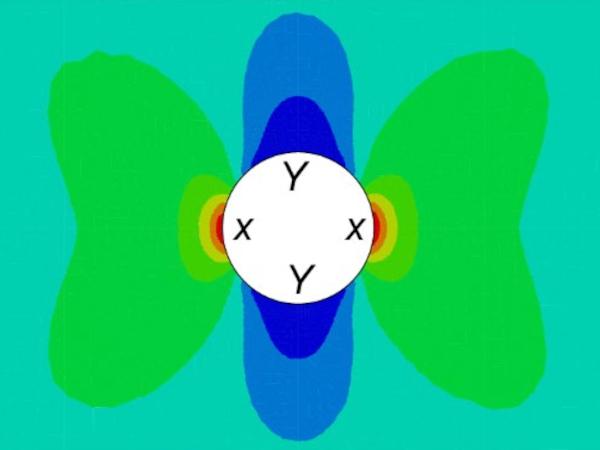
Fig. 4b shows the stress concentration factor (Kt) of the longitudinal component of the stress in the vicinity of the hole if the test specimen was loaded in tension along the longitudinal direction (i.e. length direction of the test specimen). Kt value was defined as the ratio between the stress at the location under consideration and the remote stress (i.e. average stress across the glass specimen, if there was no hole in the middle). The results suggest that high stress concentrations of magnitude of about three present close to the edge of the hole parallel to the loading direction (location X in Fig. 4b). On the other hand stresses lower than the magnitude of the remote stress (i.e. Kt <1) present close to the edge of the hole perpendicular to the loading direction (location Y in Fig. 4b).
2.1. Regions with High Stress Concentration
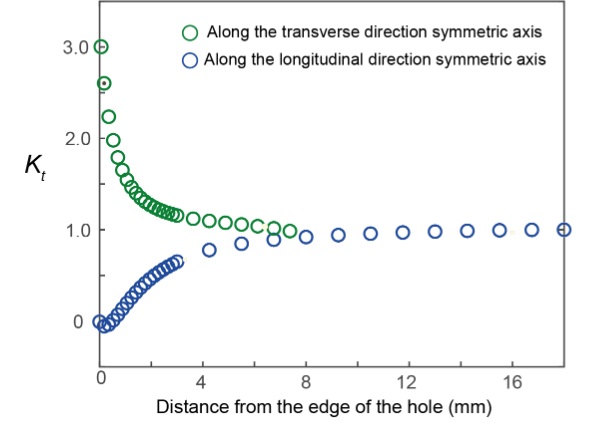
In order to investigate the variation of Kt with respect to the location, a detailed analysis of the variation of Kt along the two central axes of the test specimen (i.e. longitudinal axis and the transverse symmetric axis) was carried out. For example, Fig. 5 shows the variation of Ktalong the distance from the edge of the hole along the longitudinal and transverse symmetric axes of the test specimen. The results suggest that the maximum Kt of about three presents at the edge of hole along the transverse symmetric axis, and the high stress concentration diminishes quite rapidly where Kt drops to about 1.3 at about 2 mm away from the edge. The Kt value then drops gradually to one (i.e. the stress reaches the remote stress) at about 7 mm away from the edge.
Along the longitudinal axis, Kt is zero at the edge of the hole and gradually reaches to one (i.e. stress approaches the remote stress) at about 8 mm away from the edge of the hole. This suggest that no stress concentration presents along the longitudinal axis, in fact a reduction in the stress in the vicinity of the hole compared to the remote stress. The results Kt values are comparable with the theoretical values where for example, Ktvalues of 3 and 0 are reported at the edge of the hole along the transverse and longitudinal direction axes, respectively, in an infinitely large 2D plate.
2.2. Design of GFRP Reinforcement
Since the analysis of the stress concentration around the vicinity of the hole suggests that only a small area adjacent to the edge of hole along the transverse direction (i.e. location X in Fig. 4b) subject to high tensile stresses, it was decided to strengthen/reinforce the glass over this critical area. GFRP strips of 70 mm (length) x 25 mm (width) were bonded in either side (on both top and bottom surfaces) as reinforcement (see Fig. 6). The GFRP strips were made by impregnating an ‘E-glass’ dry fabric using a commercially available two-part epoxy resin in a wet lay-up method. The average thickness of the cured GFRP was 1.35 mm and the ultimate tensile strength and the Young’s modulus of the GFRP were determined to be 450 MPa and 24.5 GPa, respectively (Achintha and Zirbo 2021). A commercially available adhesive, Araldite 2020 (Araldite 2015), was used to bond the GFRP strips onto the glass surfaces. The fabrication details of the GFRP and the bonding process of the GFRP strips on the glass specimens are published elsewhere (Achintha and Zirbo 2021), and therefore, the details are not repeated in the present paper.
2.3. Results
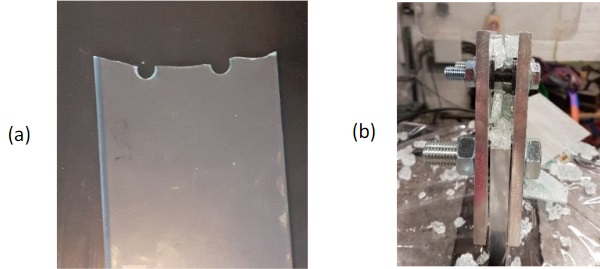
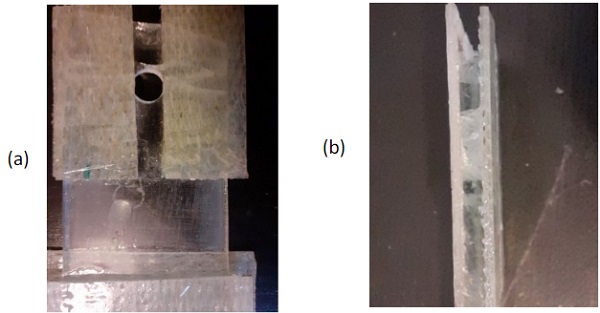
Both reference (i.e. unreinforced) and reinforced test specimens were tested in the present study. Minimum of three test specimens were tested from each category. For brevity, only the results of one specimen from each category of the test specimens are presented here. The variance in the results of the three test specimens are well within the scatter of experimental results expected for annealed glass. As expected, the reference unreinforced specimen failed in a brittle manner across the hole (see Fig. 7a). The load-displacement relationships shown in Fig. 7b (dotted line) shows that the specimen failed at the peak load with no post-peak or post-cracked load resistance.
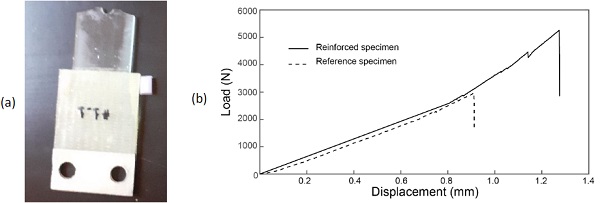
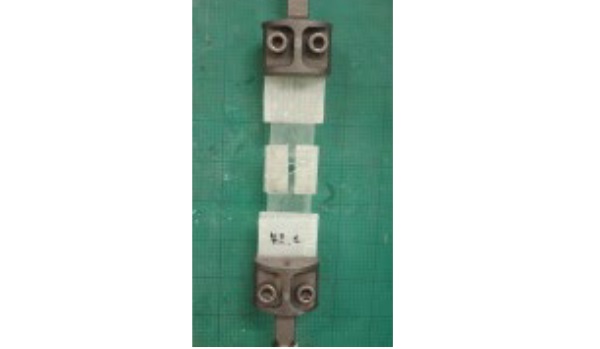
Unlike the reference open hole glass specimen, the reinforced specimen did not fail in a brittle manner. Fig. 8a shows the reinforced test specimen after it was removed from the loading machine. The figure shows that glass had not completely failed across the glass specimen. Fig. 8b shows a close-up of a cracked reinforced test specimen where it is clear that the GFRP reinforcement strips held the broken glass fragments together preventing an overall brittle fracture of the test specimen. The kink in theload-displacement relationships shown in Fig. 7b (solid line in Fig. 7b) suggest that perhaps the first major crack in the reinforced specimen occurred at about load 4.1 kN, however, the test specimen continued to carry more load. The final failure load of this test specimen (5.26 kN) is 78% higher than that of the reference specimen (2.96 kN). The results suggest that similar to the previous application of the GFRP reinforcement technique in glass-bolted joints, the technique also enhance the load capacity whilst ensuring a notable load resistance in the post-cracked regime of the open hole annealed glass test specimen.
3. Simplified Finite Element Analysis Methodology for the Analysis of the Reinforced Glass-Bolted joints
Stress analysis around a drilled hole in annealed glass without and with GFRP reinforcement (i.e. reference and reinforced cases, respectively) under an applied force representative of that due to the force transfer from a bolt to the glass in glass–bolted joints were carried out in order to develop a FE modelling technique for the analysis of the GFRP reinforced glass–bolted joints. The considered case represented a single bolt each at each end of the given glass specimen.
3.1. Reference Glass-Bolted Joint
The geometric details of the 6 mm thick annealed glass specimen is shown in Fig. 9a. It was assumed that M10 bolts used in the glass–bolted joints, and in order to have a gap of 1 mm between the hole and the bolt shank, 11 mm holes were assumed (see Fig. 9a). Similar to the analysis of the open hole test specimen above (Section 2), Abaqus/CAE was used for the FE analysis. Since the yielding and/or failure of the steel bolts is unlikely to occur prior to glass facture (e.g. To et al. 2008; Overend et al. 2013), in the present study, no attempt was made to explicitly model the bolts in the FE analysis. Stress state of the bolts is not critical to the results presented in this paper (i.e. the results of glass fracture). Therefore, the effects of the bolts were simply incorporated as a uniform contact pressure on one-half surface of the drilled hole.
The failure load of the reference open hole test specimen was established by gradually increasing the magnitude of the force transfer from the bolt to glass until the surface Maximum Principal Tensile Stress (MPTS)(σ1_ts_max) in glass reached the tensile strength of glass which was assumed to be 40 MPa(I StructE 2014; Veer et al. 2009). Since glass is a brittle material, surface MPTS (σ1_ts_max) criterion is appropriate to predict the failure of the glass structures (Alter et al. 2017; Ronchetti et al. 2013). Fig. 9b shows maximum principal stress (σ1_max) distribution when σ1_ts_max just reached 40 MPa. The stress distributions shown in the figure were resulted in due to the force transfers of 2.9 KN from the bolt to glass.
3.2. Reinforced Glass–Bolted Joint
Similar to the reinforced strips used in the open hole test specimen, GFRP strips were used to reinforce the drilled hole in this assumed glass–bolted joint test specimen. The same FE modelling approach used for the analysis of the unreinforced glass–bolted joints (Section 3.1) was extended to analyse the GFRP reinforced glass–bolted joints. The GFRP strips which were bonded on both outer sides of the glass specimen were included in the FE models. The GFRP strips were modelled as linear elastic material with Young’s modulus along the fibre direction 24.5 GPa and that along the perpendicular directions 10 GPa (Achintha and Zirbo 2021). The Poisson’s ratio of the GFRP along the fibre direction was assumed to be 0.25 whereas that along the transverse and through-thickness directions was assumed to be 0.1 (Gibson 2016).
Whilst the assumed values were approximations, the magnitudes of the stresses in the GFRP strips were small (often <15 MPa), and therefore, the used linear elastic FE modelling approach and any likely minor inaccuracy in the assumed Poisson’s ratio values are not critical to the results presented in this paper. Similarly, the assumption of the local strain compatibility between the glass and the GFRP (i.e. no slip between glass and GFRP), and hence the use of inbuilt “tie” constraint option available in Abaqus to “bond” the GFRP surface onto the glass surface, is also appropriate given the no premature bond failure of the GFRP were expected given the low stresses in the GFRPs prior to the fracture of glass.
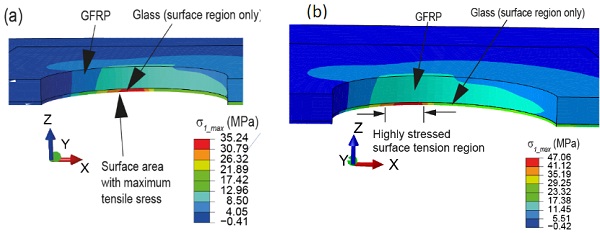
Figs. 10a shows the σ1_max distribution in the GFRP reinforced annealed glass– bolted joints at the applied force that caused the failure of the respective reference test specimen joints (i.e. 2.9 kN force transfers from the bolt to the glass). (Note: for brevity, the surface of the glass specimen in the vicinity of the hole together with the bonded GFRP on the top of the glass specimen is shown in Fig. 10). The results show that the expected σ1_ts_max is ~30 MPa. Since the σ1_ts_max value is below 40 MPa, failure of the reinforced joints is not expected under the considered load value. The reduction in the σ1_ts_max in the reinforced joints compared to the reference joint is due to the contribution of the GFRP reinforcement to the load carrying of the joint.
Unlike the reference joint where the glass fractures causing failure of the glass–bolted joint when σ1_ts_max just reached 40 MPa at the location with the highest tensile stress, in the reinforced joints the adhesively bonded GFRP strips resisted the fracture of the entire glass at once across the bolted joint.In the experimental investigations, it was noted that the formation of a cracked region of the size ~1.5–2 mm caused the first kink in the load response curve of the joints Therefore, in the present computational method, the applied force which caused the formation of the first major crack was established as when σ1_max distribution shows a ~1.5 mm–2 mm long surface zone with σ1_max higher than 40 MPa.
Fig. 10b shows the σ1_max distribution in the reinforced annealed glass–bolted joints at the applied force that expected to cause ~1.5 mm–2 mm long zone of σ1_max higher than 40 MPa. The corresponding load cases were 3.77 kN force transfer from the bolt to the glass. The stresses in the GFRPs under this load case remained small compared to the respective ultimate strength values of the used GFRP. Therefore, the results justify that no GFRP or bond failure prior to the glass fracture. The results suggest high load capacity in the reinforced joint compared to the reference joints.
4. Conclusions
- The experiment results showed that the externally bonded GFRP strips has potential for strengthening stress concentration features such as open hole tensile test specimens in annealed glass. This is due to the role of GFRPs in arresting the propagation of cracks in the critical areas.
- The finite element (FE) results showed that the maximum principal tensile stress (MPTS) based failure of glass can be used to predict the peak load of the reference glass–bolted joints and to predict the formation of first major crack in GFRP–reinforced glass–bolted joints. The failure of the reference joints can be established as when MPTS at the most highly stressed location of the glass surface reaches the tensile strength of glass. In the case of GFRP reinforced glass-bolted joints, the results suggest that the formation of the first major crack may be assumed as when MPTS exceeded the tensile strength of glass over a surface region of ~1.5 – 2 mm long.
- An investigation on the generic validity of the assumptions made in the FE analysis is suggested for a future work. Similarly, extending the FE models for the detailed analysis of the post-peak load response of the reinforced glass–bolted joints, including an analysis of the effects of different design parameters of the GFRP, is proposed for a future study.
Acknowledgements
The author would like to thank Mikhail Bessonov who carried out the experiments of open hole test specimens as part of their MSc research project.
References
ABAQUS/CAE (Standard) (2019). Simulia. https://www.3ds.com/products-services/simulia/
Achintha, M., Zirbo. T.: GFRP reinforced high performance glass–bolted joints: Concept and experimental characterisation. Constr Build Mater. 274 (2021): 122058. https://doi.org/10.1016/j.conbuildmat.2020.122058
Alter C., Kolling, S., Schneider, J.: An enhanced non–local failure criterion for laminated glass under low velocity impact. Int. J. Impact Eng. 109 (2017): 342-353. https://doi.org/10.1016/j.ijimpeng.2017.07.014
Araldite2020. Product sheet. Basel, Switzerland: Huntsman Advanced Materials, 2015.
Baitinger M., Feldmann. M.: Design concept for bolted Glass. In: Bos, F., Louter, C., Veer, F. (Eds.), Proceedings of Challenging Glass 2 Conference, Delft (2010): 237-246.
Bedon, C., Santarsiero, M.: Transparency in Structural Glass Systems Via Mechanical, Adhesive, and Laminated Connections-Existing Research and Developments. Adv. Eng. Mater. 20(5) (2018). https://doi.org/10.1002/adem.201700815
Gibson R. F.: Principles of Composite Material Mechanics. CRC Press, Boca Raton (2016)
IStructE.: Structural use of glass in buildings. 2nd ed. The Institution of Structural Engineers, London (2014).
Overend, M., Nhamoinesu, S., Watson. J.: Structural performance of bolted connections and adhesively bonded joints in glass structures. J. Struct. Eng. 139(12) (2013), 04013015. https://doi.org/10.1061/(asce)st.1943-541x.0000748
Ronchetti, C., Lindqvist, M., Louter, C., Salerno, G.: Stress-corrosion failure mechanisms in soda–lime silica glass. Eng. Fail. Anal. 35(2013): 427-438. https://doi.org/10.1016/j.engfailanal.2013.03.028.
To, Q.D., He, Q. C., Cossavell, M., Morcant, K., Panait, A., Yvonnet. J.: The tempering of glass and the failure of tempered glass plates with pin-loaded joints: Modelling and simulation. Mater. Des. 29(5) (2008): 943-951. https://doi.org/10.1016/j.matdes.2007.03.022
Veer, F.A., Louter, C., Bos, F.P.: The strength of annealed, heat-strengthened and fully tempered float glass. Fatigue Fract. Eng. Mater. Struct. 32 (2009):18-25. https://doi.org:/10.1111/j.1460-2695.2008.01308.x
Wang, X., Yang, J., Liu, Q., Zhang, Y., Zhao, C: A comparative study of numerical modelling techniques for the fracture of brittle materials with specific reference to glass. Eng. Struct. 152 (2017): 493-505. https://doi.org/10.1016/j.engstruct.2017.08.050
Watson, J., Nielsen, J., Overend. M : A critical flaw size approach for predicting the strength of bolted glass connections”. Eng. Struct. 57 (2013): 87-99. https://doi.org/10.1016/j.engstruct.2013.07.026

")